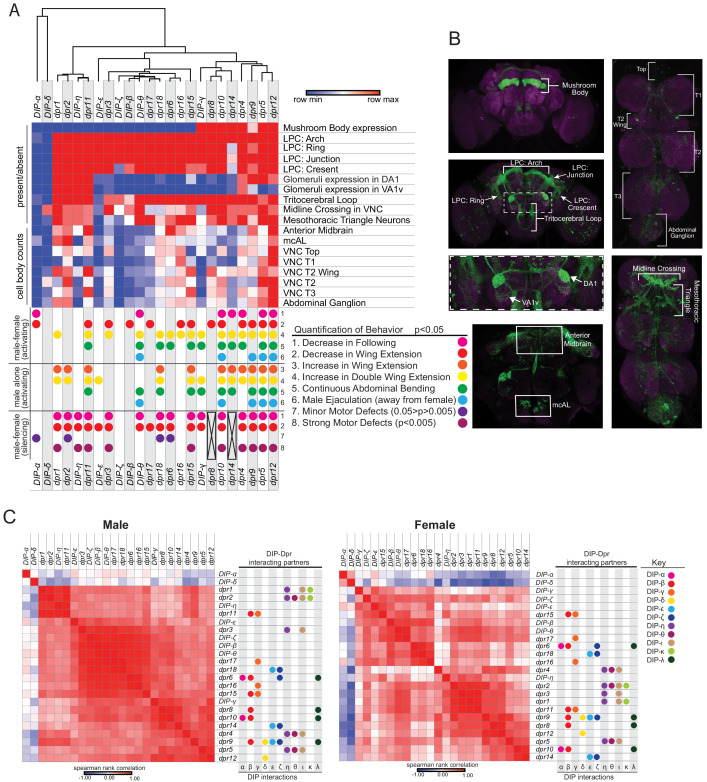
Figure 7. Meta-analysis of expression patterns of fru P1 ∩ dpr/DIP intersecting neurons and behavior data.
Meta-analysis using behavior data and image analysis data of 4- to 7-day-old flies. (A) Heatmap of fru P1 ∩ dpr/DIP intersecting neurons expression patterns in the male adult CNS. For each row, the minimum (blue), middle (white), and maximum (red) values are indicated. The top of the heatmap shows the relationship across the expression patterns of the dprs and DIPs, with a dendrogram. The summary of phenotypic analyses of male sexual behaviors, using either activating or silencing effector genes (see Figures 4–6), is shown below the heatmap. The dot indicates a significant change in behavior (p<0.05, unless indicated). The black X indicates that there was no experimental progeny from the cross, due to lethality, and therefore were not tested behaviorally. (B) Labeled confocal images showing the morphological featured scored. (C) Correlation analysis of GFP expression results (male on left and female on right). The scale for the spearman correlation is −1 (blue) to 1 (red). The dots to the right indicate the DIP interacting partners for each Dpr (left-hand side of each graph) (Dpr-DIP interactome based on Cosmanescu et al., 2018). The full data set is provided (Source data 1).

