

Abstract
BACKGROUND AND PURPOSE: Subacute sclerosing panencephalitis (SSPE) is a rare, progressive, inflammatory neurodegenerative disease. Our aim was to determine the metabolic abnormalities of brain in early- and late-stage SSPE by using MR spectroscopy and to assess areas of involvement in the early stages when MR imaging findings were normal.
METHODS: Children with stage II (n = 3) or III (n = 3) SSPE and 10 healthy, age-matched children underwent MR imaging, multivoxel MR spectroscopy, and short-echo single-voxel MR spectroscopy (SVS). Areas of involvement in the brain were determined with chemical shift imaging. For SVS, 2 × 2 × 2-cm voxels were placed in the frontal subcortical white matter (FSWM) and parieto-occipital white matter (POWM). N-acetylaspartate (NAA)/creatine (Cr), choline (Cho)/Cr, myo-inositol (Ins)/Cr, and NAA/Cho ratios were calculated.
RESULTS: Comparisons of NAA/Cr, Cho/Cr, Ins/Cr and NAA/Cho ratios between patients and control subjects showed significant differences in FSWM and POWM (P < .01). In patients with SSPE, NAA/Cr ratios in POWM were significantly less than those in FSWM (P < .01). NAA/Cr ratios in patients with stage II SSPE and those in the control group were not significantly different; this may reflect the absence of neuronal loss. Decreased NAA/Cr, increased Cho/Cr and Ins/Cr ratios, and increased lactate and lipid peaks were found in patients with stage III SSPE.
CONCLUSION: MR spectroscopy showed findings suggestive of inflammation in stage II and findings of demyelination, gliosis, cellular necrosis, and anaerobic metabolism in stage III. MR spectroscopy could be a promising technique for early diagnosis and treatment planning in cases of SSPE.
Subacute sclerosing panencephalitis (SSPE) is a progressive neurologic disorder of childhood and early adolescence (1). The diagnosis is based on clinical findings, EEG results, and the titer of measles antibodies in the CSF and serum. Brain biopsy or postmortem histopathologic examination shows evidence of astrogliosis, neuronal loss, degeneration of dendrites, demyelination, neurofibrillary tangles, and infiltration of inflammatory cells (2, 3). Inflammation and edema are observed in the early stages, with demyelination and gliosis ensuing later, after resolution of the inflammation (4).
The parieto-occipital region of the brain is most frequently and severely affected, and the involvement is generally asymmetric (2, 5). A significant relationship between clinical stage and neuropathologic findings was reported in a clinicopathologic study (6). MR imaging findings are usually not correlated with the clinical stage of the disease (5, 7, 8). Defining these findings as improvement or progression is not possible on the basis of MR imaging findings alone (1). Because MR spectroscopy provides information regarding in vivo brain metabolism and neuronal function, it is a promising method that may illustrate the pathophysiologic features of SSPE. Although it is not specific or diagnostic for SSPE, MR spectroscopy could show substantial metabolic impairment in the periventricular white matter, even when the MR imaging findings are normal, especially in the early stages (9).
In this study, our aim was to investigate whether clinical stage and the MR spectroscopy findings of SSPE are correlated and to determine the metabolic abnormalities in the periventricular white matter, especially in the early stages when the MR imaging results are normal.
Methods
The study group included six consecutive children (three boys, three girls; mean age, 6.8 years) with the diagnosis of SSPE who were referred to neuroradiology department. MR imaging and MR spectroscopy were performed in these children.
A pediatric neurologist (C.Y.) diagnosed SSPE on the basis of the clinical signs and symptoms, the characteristic EEG patterns (burst suppression in the early stage and a diffuse, random, slow arrhythmia pattern in the late stage), and high titers of measles antibody in the serum (>1:180) and CSF (>1:4). The criteria of Jabbour et al (10) were used for clinical staging, as follows: stage I indicated personality changes or behavioral disturbance or both; stage II, convulsive motor signs, myoclonus, incoordination, choreoathetosis, and tremors; stage III, coma, opisthotonos, decerebrate rigidity, no responsiveness to any stimulus; and stage IV, loss of cerebral cortical function, less frequent myoclonus, and diminished hypertonia. Demographic, clinical, and imaging features of the patients with SSPE are presented in Table 1. Children with SSPE were compared with 10 healthy, age-matched children (six boys and four girls) aged 6–9 years (mean age, 7.8 years).
TABLE 1:
Demographic, clinical, and imaging features of SSPE cases
| Patient/Age, y/Sex | Vaccination | Age at Measles Infection | Time after Diagnosis | Stage at Diagnosis | Clinical and Neurologic Findings | MRI Findings |
|---|---|---|---|---|---|---|
| Stage II at MRS | ||||||
| 1/8/F | No | 7 mo | 1 y | II | Choreoathetosis, myoclonus, difficulty speaking, tonic convulsion, mental deterioration | Normal |
| 2/8/M | Yes | NA* | 6 mo | II | Myoclonus, ataxia, spasticity, tonic-clonic seizures, difficulty speaking | Normal |
| 3/6/F | Yes | 12 mo | 9 mo | II | Myoclonus, ataxia, mental deterioration, walking with assistance | Normal |
| Stage III at MRS | ||||||
| 1/8/M | Yes | 11 mo | 4 y | II | No speech, decerebrate rigidity, bedridden, no responsiveness to any stimulus | Cerebral, cerebellar, and brainstem atrophy, periventricular hyperintensities |
| 2/8/M | No | 6 mo | 3 y | II | No speech, opisthotonos, decerebrate and decorticate rigidity, no responsiveness to any stimulus, bedridden | Cerebral and cerebellar atrophy, periventricular hyperintensities |
| 3/7/F | Yes | 16 mo | 2 y | II | Decerebrate rigidity, bedridden, no speech | Cerebral and cerebellar atrophy, periventricular hyperintensities |
Not applicable.
MR imaging was performed by using a 1.5-T system (Gyroscan Intera; Philips, Best, the Netherlands). T1-weighted images (TR/TE, 560/15) with 5-mm-thick sections were obtained in the axial and sagittal planes . T2-weighted images (4530/100) were obtained in the axial and coronal planes. All children with SSPE were sedated with chloral hydrate (dose, 50–70 mg/kg body weight) or midazolam hydrochloride (dose, 0.1 mg/kg) as needed.
Multivoxel MR spectroscopic (MVS) datasets were acquired by using point-resolved spectroscopy (PRESS) with the acquisition parameters of 1500/136/1 (TR/TE/NEX) and a transverse field of view of 230 mm with a 16 × 16 rectangular sampling array. After three orthogonal baseline images were obtained with automatic shimming of the magnetic field, a 30-mm-thick volume of interest (VOI) was identified. The VOI was placed on the centrum semiovale, parallel to planium sphenoidale and above the body of the corpus callosum, cover-ing the frontal subcortical white matter (FSWM) and parieto-occipital white matter (POWM) bilaterally. The local magnetic homogeneity within the VOI was further optimized by an additional manual shimming to provide the maximum proton signal intensity from water. Starting with shim settings that were known to result in a nearly optimal water signal intensity, additional manual shimming took 2–4 minutes. MR spectroscopic data were accumulated after the optimal water signal intensity was suppressed by using the chemical shift-selective technique. With chemical shift imaging (CSI), abnormal areas were detected in the periventricular white matter. After the evaluation of left and right periventricular white matter on CSI maps from the point of involvement, areas that looked the worst were chosen for short-echo single-voxel MR spectroscopy (SVS). SVS was performed in all patients by using a PRESS sequence (TR/TE/NEX, 2000/31/256). Voxel sizes of 8 cm3 (2 × 2 × 2 cm) were used. Voxels were placed in the FSWM and POWM.
The examination, including MR imaging, CSI, and SVS, was completed within approximately 40 minutes. SVS and MVS of same regions in the brain were available in 10 healthy individuals for comparison.
The spectrum was referenced to creatine (Cr)peak (3.02 ppm). The signals from choline (Cho), Cr, N-acetylaspartate (NAA), and myo-inositol (Ins) were integrated. Resonances were assigned as follows: lipids, 0.9–1.1 ppm; lactate, 1.3 ppm; NAA, 2.02 ppm; Cr, 3.02 ppm; Cho, 3.2 ppm; and Ins, 3.56 ppm. Peak-area metabolite ratios (NAA/Cr, Cho/Cr, NAA/Cho, and Ins/Cr) were calculated. For each patient, two authors (A.A., R.K.) assessed whether the spectra were diagnostic.
A two-tailed Mann-Whitney U test was use to assess for differences in the metabolite ratios of FSWM and POWM between the control group and the patients with SSPE. The Wilcoxon signed rank test was used to assess differences in metabolite ratios between FSWM and POWM in patients with SSPE. A P value less than .01 was considered to indicate a significant difference.
Results
Although MR imaging findings were normal in patients with stage II SSPE, CSI revealed increased Cho levels, which was more prominent in left periventricular white matter. In these patients, SVS showed normal NAA/Cr ratio and increased Cho/Cr and Ins/Cr ratios in the FSWM and POWM (Fig 1). Cho/Cr increases in the POWM were slightly higher than in the FSWM (Fig 2).
Fig 1.

Findings in a 6-year-old girl with stage II SSPE.
A, Axial T2-weighted localizer image (2875/120) shows a 2 × 2 × 2-cm voxel placed in the left FSWM.
B, MR spectrum (single voxel, PRESS; 2000/31/256) shows a normal NAA/Cr ratio and increased Cho/Cr and MI/Cr ratios.
Fig 2.

Findings in an 8-year-old girl with stage II SSPE.
A, Axial T2-weighted image (4530/100) shows normal brain parenchymal findings.
B, Coronal T2-weighted localizer image (2875/120) shows a 2 × 2 × 2-cm voxel placed in the left POWM.
C, MR spectrum (single voxel, PRESS; 2000/31/256) shows a normal NAA/Cr ratio and increased Cho/Cr and MI/Cr ratios.
Cerebral and cerebellar atrophy and periventricular hyperintensities were found in all patients with stage III disease. In addition, brain stem atrophy was noted in one patient (Fig 3). CSI revealed a left-sided asymmetric increase in the Cho level and a decrease in NAA in stage III (Fig 4). Compared with the control spectra, SVS findings in the children with SSPE in stage III showed a significant difference, with much smaller NAA peaks and decreased NAA/Cr ratios in both the FSWM and POWM (P < .01) (Fig 5). A statistically significant difference was noted in the Cho/Cr ratios between patients with SSPE and those in the control group (P < .01). Children with stage III SSPE had larger Cho peaks and higher Cho/Cr ratios. Increased lactate and lipid peaks were also found in this group.
Fig 3.

Findings in an 8-year-old boy with stage III SSPE.
A, Coronal T2-weighted image (4530/100) shows periventricular hyperintensities and cerebral and brain stem atrophy.
B, Axial T2-weighted localizer image (2875/120) shows a 2 × 2 × 2-cm voxel placed in the left POWM.
C, MR spectrum (single voxel, PRESS; 2000/31/256) shows a substantially decreased NAA/Cr ratio, increased Cho/Cr, Ins/Cr ratios, and lipid and lactate peaks.
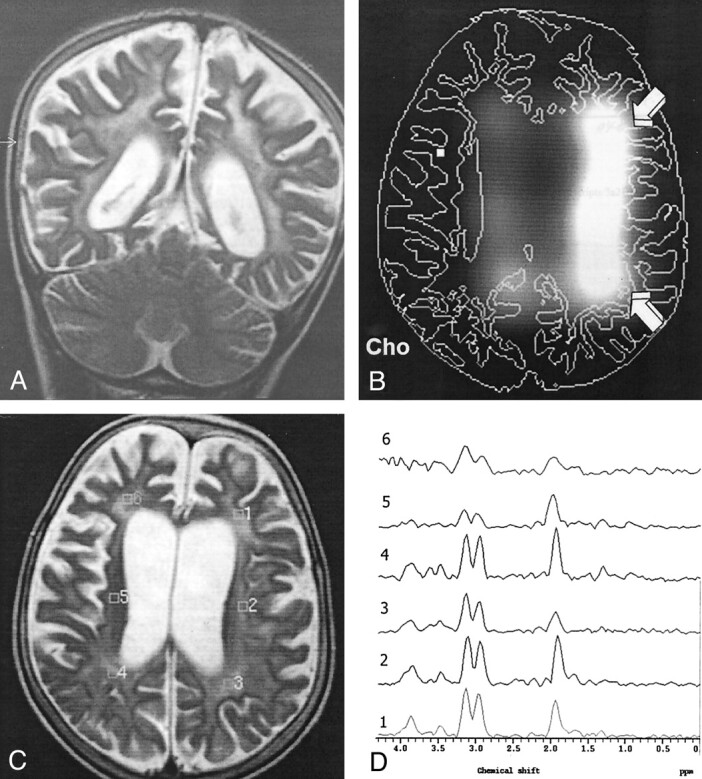
Fig 4.

Findings in a 7-year-old girl with stage III SSPE.
A, CSI map of NAA shows decreased NAA signal intensity in the FSWM (straight arrows) and POWM (curved arrows).
B, Axial T2-weighted localizer image (2875/120) for MVS shows periventricular hyperintensities and cerebral atrophy.
C, MR spectrum (1500/136) (1) shows a normal NAA/Cr ratio and increased Cho/Cr ratios in left periventricular white matter. MR spectrum (2) shows substantially decreased NAA/Cr and increased Cho/Cr ratios in the left POWM.
Fig 5.
Findings in an 8-year-old boy with stage III SSPE.
A, Coronal T2-weighted image (4530/100) shows periventricular hyperintensities and cerebral atrophy.
B, CSI map of Cho shows increased Cho signal intensity in the left periventricular white matter (arrows).
C, Axial T2-weighted localizer image (2875/120) for MVS shows diffuse periventricular hyperintensities and cerebral atrophy.
D, MR spectrum (1500/136) (3) shows significantly decreased NAA/Cr and increased Cho/Cr ratios in the left POWM.
NAA/Cr, Cho/Cr, Ins/Cr, and NAA/Cho ratios obtained from the POWM and FSWM were significantly different between all patients SSPE and the control group (P < 0.01).
The mean NAA/Cr, Cho/Cr, Ins/Cr, and NAA/Cho ratios obtained from the POWM and FSWM of patients with stage II or stage III SSPE are presented in Table 2.
TABLE 2:
Mean metabolite ratios
| Subjects | NAA/Cr |
Cho/Cr |
MI/Cr |
NAA/Cho |
||||
|---|---|---|---|---|---|---|---|---|
| FSWM | POWM | FSWM | POWM | FSWM | POWM | FSWM | POWM | |
| Stage II SSPE | 1.62 ± 0.03 | 1.56 ± 0.05 | 1.05 ± 0.01* | 1.15 ± 0.07* | 1.42 ± 0.15* | 1.34 ± 0.01* | 1.55 ± 0.16* | 1.36 ± 0.13* |
| Stage III SSPE | 1.08 ± 0.22* | 0.91 ± 0.17* | 1.43 ± 0.19* | 1.33 ± 0.23* | 2.35 ± 0.09* | 2.66 ± 0.10* | 0.75 ± 0.18* | 0.68 ± 0.04* |
| Control | 1.74 ± 0.12 | 1.69 ± 0.19 | 0.64 ± 0.11 | 0.66 ± 0.12 | 0.66 ± 0.11 | 0.63 ± 0.12 | 2.78 ± 0.50 | 2.59 ± 0.50 |
Note.—Data are the mean ± SDs.
P < .01 versus control group.
Mean NAA/Cr ratios from the POWM and FSWM in all SSPE cases were 1.23 ± 0.37 and 1.34 ± 0.32, respectively. This decrease in POWM was statistically significant (P < .01).
In stage II SSPE, the NAA/Cr ratios in the POWM did not significantly differ from those in the FSWM (P > .01). However, these ratios were significantly decreased in stage III disease (P < .01).
Mean Cho/Cr ratios from the POWM and FSWM in all SSPE cases were 1.24 ± 0.18 and 1.24 ± 0.25, respectively. Cho/Cr ratios from the POWM and FSWM in stage II or stage III cases were significantly higher than those in the control group (P < .01)
Mean Ins/Cr ratios from the POWM and FSWM in all SSPE cases were 1.99 ± 0.73 and 1.88 ± 0.52, respectively. Ins/Cr ratios from POWM and FSWM in stage II or stage III cases were significantly higher than those in the control group (P < .01)
Discussion
First described in 1934, SSPE is a slow virus infection caused by the measles virus. The incidence of this disease was reported to be one case per million patients with measles a year (11). The history of primary measles infection before age 2 years and a latent period of 6–8 years are present in most patients. SSPE is an incurable disease, one that usually causes death within 2–4 years of onset (2).
Because the clinical profiles of the disease lead to various presentations, early diagnosis and true clinical staging are not always easy (12, 13). The timing of the imaging during the course of the disease, the proportion of early and late cases, and the number of serially studied patients may account for certain discrepancies among reports on the relative frequency of MR imaging findings (14). Usually, MR imaging findings and the clinical stage of SSPE are not correlated (15). MR imaging findings typically remain normal in the early stages. Even patients who are bedridden because of severe disease may still have normal findings at MR imaging (8). Resolution of the MR imaging findings despite disease progression has also been reported (16). Although cortical and subcortical lesions are somewhat correlated with the clinical findings, the extent and location of the periventricular white matter lesions and cerebral atrophy does not reflect the neurologic status in many patients (14). Our study revealed normal MR imaging findings in all patients with stage II disease and widespread periventricular hyperintensities and cerebral and cerebellar atrophies in all patients with stage III disease. In our study, MR imaging findings were consistent with those reported in the literature.
Pathologically, mild inflammation of the cortical gray matter is prominent in the early period of the disease; this later progresses to subcortical and deep white matter involvement (1). Later in the course of the disease, the inflammation subsides, leading to demyelination, necrosis, and gliosis (7). The posterior regions, especially the parieto-occipital and posterotemporal areas, are predominantly affected early in the course of the disease (17).
Although SSPE is an invariably fatal disease, studies about the treatment of SSPE demonstrate that the early initiation of the treatment slows the progression and improves the patient’s quality of life (18, 19). For these reasons, recognizing the early manifestations of the SSPE is important. Nevertheless, SSPE is usually diagnosed after permanent brain damage has already taken place. In the early stages when the only neurologic findings are behavioral changes, routine neuroimaging techniques such as CT and MR imaging do not help in the diagnosis. Thus, in the early stages, additional neuroimaging modalities are needed, apart from neurologic findings.
In vivo brain metabolism can be noninvasively evaluated by means of MR spectroscopy. It could be used to identify distinct metabolic patterns that are characteristic of specific disease processes (20). In the literature that we reviewed, only one report (9) described the MR spectroscopy findings. These were in a 17-year-old patient with SSPE and included MR imaging findings. It suggests that MR spectroscopy is better than MR imaging in showing the diffuse nature of SSPE. Our study included patients with SSPE in both the early and late stages. Thus, our results indicate early and late metabolic abnormalities of the brain in SSPE, and they suggest the possible role of MR spectroscopy in the early diagnosis of the disease.
We performed MVS and SVS in all patients. The rationale behind MVS was to assess CSI maps, which indicated areas of metabolic changes in the white matter. Kulezycki et al (17) observed that the inflammatory process starts in the occipital white matter and proceeds toward the frontal regions in SSPE, as shown on MR images. Short-echo SVS was reported to depict most of the prominent resonances thought to represent NAA, Cho, Ins, lactate, and lipid (21). For that reason, we performed short-echo SVS in FSWM and POWM areas.
In our study, all three of the patients with stage II SSPE and normal MR imaging findings had asymmetric subcortical white matter involvement, as demonstrated with MR spectroscopy. This asymmetric involvement is in accordance with the early clinical and pathologic findings of SSPE that have been reported.
The decrease in the NAA/Cr ratio could reflect neuronal loss, the increase in the Ins/Cr ratio might indicate glial proliferation, and the increase in the Cho/Cr ratio possibly suggests either demyelination or inflammation, as shown with MR spectroscopy (21, 22). In our study, the NAA/Cr ratio was found to be normal in stage II SSPE and decreased in stage III SSPE. This last finding could imply that neuronal loss might be substantial in POWM, when compared with that in the FSWM. The Ins/Cr ratio was increased in all patients with SSPE. This increase was prominent in stage III and in the POWM. Also, the Cho/Cr ratio was increased in all patients. Normal NAA/Cr and increased Cho/Cr ratios in patients with stage II disease might reflect inflammation. In patients with stage III SSPE, MR images demonstrated widespread periventricular hyperintensities and cerebral and cerebellar atrophies. We found increased Cho/Cr ratios and noted increases in the lactate and lipid peaks in stage III disease. These findings might indicate demyelination, areas of cellular necrosis, and anaerobic metabolism (23). All of our MR spectroscopic results are consistent with the reported pathologic findings of SSPE (2–4).
Although this study has some limitations, such as the number of cases, the absence of patients with some stages of SSPE (eg, stage I or IV SSPE), the lack of long-term follow-up of the patients. However, our MR spectroscopic findings could help in identifying stage II and stage III disease; that is, early- and late-stage SSPE. Further studies with larger patient groups and with follow-up are needed to determine the exact value of MR spectroscopy in evaluating SSPE.
Conclusion
Our results indicate increased Cho/Cr and Ins/Cr ratios and normal NAA/Cr ratios; these could reflect glial proliferation and inflammation before neuronal loss occurs in the early stages of the SSPE. For these reasons, we think that MR spectroscopy could be a promising technique in the early diagnosis of the disease and in planning treatment for patients.
References
- 1.Tuncay R, Demir GA, Gokyigit A, et al. MRI in subacute sclerosing panencephalitis. Neuroradiology 1996;38:636–640 [DOI] [PubMed] [Google Scholar]
- 2.Garg RK. Subacute sclerosing panencephalitis. Postgrad Med J 2002;78:63–70 [DOI] [PMC free article] [PubMed] [Google Scholar]
- 3.Dyken PR. Subacute sclerosing panencephalitis: current status. Neurol Clin 1985;3:179–196 [PubMed] [Google Scholar]
- 4.Tsuchiya K, Yamauchi T, Fururi S, Suda Y, Takenaka E. MR imaging vs CT in subacute sclerosing panencephalitis. AJNR Am J Neuroradiol 1988;9:943–946 [PMC free article] [PubMed] [Google Scholar]
- 5.Ozturk A, Gurses C, Baykan B, Gokyigit A, Eraksoy M. Subacute sclerosing panencephalitis: Clinical and magnetic resonance imaging evaluation of 36 patients. J Child Neurol 2002;17:25–29 [DOI] [PubMed] [Google Scholar]
- 6.Begeer JH, Haaxma R, Snoek JW, Boonstra S, le Coultre R. Signs of focal posterior cerebral abnormality in early subacute sclerosing panencephalitis. Ann Neurol 1986;90:200–202 [DOI] [PubMed] [Google Scholar]
- 7.Ohya T, Martinez J, Jabbour JT, Lemmi H, Duenas DA. Subacute sclerosing panencephalitis: correlation of clinical, neurophysiologic, and neuropathologic findings. Neurology 1974;24:211–218 [DOI] [PubMed] [Google Scholar]
- 8.Brismar J, Gascon GG, Steyern KV, Bohlega S. Subacute sclerosing panencephalitis: Evaluation with CT and MR. AJNR Am J Neuroradiol 1996;17:761–772 [PMC free article] [PubMed] [Google Scholar]
- 9.Salvan AM, Confort-Gouny S, Cozzone PJ, Vion-Dury J. Letters to the editor. In vivo cerebral proton MRS in a case of subacute sclerosing panencephalitis. J Neurol Neurosurg Psychiatry 1999;66:547–555 [DOI] [PMC free article] [PubMed] [Google Scholar]
- 10.Jabbour JT, Garcia JH, Lemni H, et al. Subacute sclerosing panencephalitis presenting as simple partial seizures. J Child Neurol 1990;5:146–149 [DOI] [PubMed] [Google Scholar]
- 11.Graves MC. Subacute sclerosing panencephalitis. Symp Neurovirol Neurol Clin 1984;2:267–280 [PubMed] [Google Scholar]
- 12.PeBenito R, Naqvi SH, Arca MM, Schubert R. Fulminating subacute sclerosing panencephalitis: Case report and literature review. Clin Pediatr 1997;36:149–154 [DOI] [PubMed] [Google Scholar]
- 13.Yaqup BA. Subacute sclerosing panencephalitis (SSPE): early diagnosis, prognostic factors and natural history. J Neurol Sci 1996;139:227–234 [PubMed] [Google Scholar]
- 14.Anlar B, Saatci I, Kose G, Yalaz K. MRI findings in subacute sclerosing panencephalitis. Neurology 1996;47:1278–1283 [DOI] [PubMed] [Google Scholar]
- 15.Dietrich RB, Vining EP, Taira RK, Hall TR, Phillipart M. Myelin disorders of childhood: correlation of MR findings and severity of neurological impairment. J Comput Assist Tomogr 1990;14:693–698 [PubMed] [Google Scholar]
- 16.Winer JB, Pires M, Kermode A, Ginsberg L, Rossor M. Resolving MRI abnormalities with progression of subacute sclerosing panencephalitis. Neuroradiology 1991;33:178–180 [DOI] [PubMed] [Google Scholar]
- 17.Kulezycki J, Kryst-Widzgowska T, Sobczyck W, Milewska D, Bocynska A. NMR and CT images in subacute sclerosing panencephalitis. Neurol Neurochir Pol 1994;28:79–90 [PubMed] [Google Scholar]
- 18.Cianchetti C, Marrosu MG, Muntoni F, Fratta A, Zuddas A. Intraventricular (alpha)-interferon in subacute sclerosing panencephalitis. Neurology 1998;50:315–317 [DOI] [PubMed] [Google Scholar]
- 19.Anlar B, Yalaz K, Oktem F, Kose G. Long-term follow-up of patients with Subacute sclerosing panencephalitis treated with intraventricular alpha-interferon. Neurology 1997;48:526–528 [DOI] [PubMed] [Google Scholar]
- 20.Cecil KM, Jones BV. Magnetic resonance spectroscopy of the pediatric brain. Topic Magn Reson Imaging 2001;12:435–452 [DOI] [PubMed] [Google Scholar]
- 21.Zimmerman RA, Wang ZJ. The value of proton MR spectroscopy in pediatric metabolic brain disease. AJNR Am Neuroradiol 1997;18:1872–1879 [PMC free article] [PubMed] [Google Scholar]
- 22.Vion-Dury J, Meyerhoff DJ, Cozzone PJ, et al. What might be the impact on neurology of the analysis of brain metabolism by in vivo magnetic resonance spectroscopy? J Neurol 1994;241:354–371 [DOI] [PubMed] [Google Scholar]
- 23.Ott D, Hennig J, Ernst T. Human brain tumors: assessment with in vivo proton MR spectroscopy. Radiology 1993;186:745–752 [DOI] [PubMed] [Google Scholar]