

Abstract
The current work involves synthesis of hybrid nanomaterial of In2O3/MoS2/Fe3O4 and their applications as photocatalysts for disintegration of esomeprazole under visible light illumination. The data emerged from various analyses testified to the successful construction of the desired nano-scaled hybrid photocatalyst. Tauc plot gave the band gap of In2O3/MoS2/Fe3O4 to be ~ 2.15 eV. Synergistic effects of the integrant components enabled efficacious photocatalytic performances of the nanocomposite. The nanohybrid photocatalyst In2O3/MoS2/Fe3O4 showed photodecomposition up to ~ 92.92% within 50 min. The current work realizes its objective of constructing metal oxide based hybrid nano-photocatalyst supported on MoS2 sheets for activity in the visible spectrum, which displayed remarkable capacity of disintegrating emerging persistent organic contaminants and are magnetically recoverable.
Subject terms: Pollution remediation, Nanoscience and technology, Nanoscale materials, Magnetic properties and materials
Introduction
Water decontamination is currently among the most exhilarating and pioneering fields of science research. For there is a gradual uptick of contamination of water by emerging menaces ranging from dyes to personal care products to pharmaceutical compounds. These emerging, non-biodegradable organic pollutants reach water bodies due to their uncontrolled release from point sources such as factories, plants industries and hospital sewage as well from non-point sources such as runoff. The release of toxic waste filled water into the biosphere brings on its deterioration and undesirable alterations in ecological balance. Among the prominent emerging water pollutants, pharmaceuticals have attracted strong attention of researchers in the field of water purification.
Pharmaceuticals reach water sources through sewage systems carrying the excreta of individuals who have consumed them and from their unregulated disposal. Veterinary pharmaceuticals may be emitted to water either directly as a result of application in fish farming or indirectly via runoff from animal-feeding operations in livestock industry. Pharmaceuticals ridden water exerts tremendous negative impacts on terrestrial and water-dwelling lives. The occurrence of pharmaceutical compounds and their residues and metabolites in wastewater has been an area of growing concern and keen research interest. Esomeprazole, the S-isomer of omeprazole, is a pharmaceutical drug used for the treatment of certain stomach and esophagus problems, such as acid reflux and ulcers. Prominent among its side effects are diarrhea, nausea, constipation, kidney ailment, and autoimmune diseases like, cutaneous lupus erythematosus and systemic lupus erythematosus. Prolonged, interminable use likely lead to a few severe health risks such as vitamin B-12 deficiency, fundic gland polyps, osteoporosis, etc1–3. Therefore, the annihilation of esomeprazole in wastewater is of paramount significance.
Among a host of advanced processes for detoxification of wastewater, advanced oxidation processes (AOPs) have seen a surge in application among researchers engaged in investigations geared towards water decontamination. AOPs usually refer to techniques of generating reactive oxygen species (viz., ·OH, ·O2−, etc.) for thorough destruction of toxic organic substances. Heterogeneous photocatalysis is a type of AOP. It takes on the surface of a semiconductor catalyst. In heterogeneous photocatalysis, the semiconductor particles are excited by photons of energy equal to or greater than the band gap leading to the formation of electron–hole pairs4,5. Thereafter, superoxide anion radicals (·O2−) are formed by the reaction of electrons with oxygen and hydroxyl radicals (·OH) are formed when holes react with water. The energetic radicals thus generated then make indiscriminate onslaughts on the molecules of the organic contaminant breaking them down to less persistent, innocuous organic compounds and simple end products such as CO2, H2O, etc. Superior detoxification ability, inexpensive operation and modest operational conditions of experiment together impart semiconductor photocatalysis a high ground in tackling water contamination. Enormous surface area, chemical stability and size-dependent properties make nano-scaled semiconductor materials apt for application in water decontamination6. Among several semiconductor nanomaterials, TiO2 has attracted attention as efficient, photo-chemically stable and ecofriendly photocatalyst vis-à-vis decomposition of organic pollutants7,8. ZnO, WO3, CeO2, In2O3, Nb2O5, Ta2O5, MOSx, WSx, CdS, ZnS, etc. have also been recently used for photocatalysis9–11. On one hand, narrow semiconductor materials are beset with severe recombination of photo-induced charge carriers, while on the other hand, semiconductors possessing large band gap primarily absorb in the ultra violet region and are therefore incapable of utilizing a large portion of the solar light rendering them exclusively UV active. This has driven development of strategies that rely upon integration of wide and narrow band gap semiconductors for fine tuning band edges and enabling absorption of photons in the visible spectrum while also preventing the rapid recombination of electron and holes. Such integrated photocatalysts have displayed superlative performance in the photodecomposition of organic water contaminants. MoS2/TiO212, Ag3PO4/TiO2/MoS213, Bi2O3/Bi2S3/MoS214, etc. have recently been designed for application in photocatalytic decomposition of emerging organic water pollutants. Additionally to facilitate easy and inexpensive recovery of photocatalysts from reactors, Fe3O4 has been used as the superparamagnetic component in coupled photocatalysts15–17. Fe3O4 has also been known to step up photodecomposition via charge separation through trapping of light-generated electrons by Fe3+ ions18,19. Besides, recently, Fe as a component in electrocatalysts has been reported to play a key role in triggering oxygen evolution reaction (OER)20. The authors of the current work have thus designed an integrated system of photocatalyst that responds in the visible spectrum, is photo-chemically stable, bears the capacity to disintegrate recalcitrant organic pollutants and is magnetically recoverable. Indium oxide (In2O3) is an important n-type semiconductor. It has three phases, namely, hexagonal, cubic and hexagonal corundum. Of late, In2O3 has seen wide applications in solar cells, sensor modules, transparent electrode materials for both electrochromic cells and for liquid crystal display devices, flat-panel displays, light-emitting diodes, thin-film transistors, etc21,22. Chief advantages of In2O3 for use in photocatalysis include high photosensitivity, environmental stability and it being an efficient sensitizer to extend the absorption spectra of metal oxide-based semiconductor photocatalysts from the UV spectrum into the visible spectrum. Its drawback is a rapid recombination of photo-induced electrons and holes21,22.
Coupling In2O3 with Fe3O4 would allow fabrication of a magnetically retrievable photocatalyst besides facilitating charge separation through electron trapping by Fe3+ ions. Loading In2O3/Fe3O4 onto a semiconducting material that could act as support and an integrating moiety for band gap tailoring that ensure further elongation of the lifetime of charge carriers would result into the construction of a visible light active superparamagnetic photocatalyst with superior stability. Therefore, In2O3/Fe3O4 was loaded MoS2 sheets for the fabrication In2O3/MoS2/Fe3O4 hybrid nano-scaled photocatalyst. Molybdenum disulfide (MoS2), a kind of two-dimensional layered transition metal dichalcogenide, has unique advantages in photocatalysis in view of its unique physical, chemical and electrical properties and tunable band structure23,24. MoS2 matrix prevents agglomeration of nanoparticles. Also MoS2 has of late been employed as a cocatalyst in photocatalysis induced decontamination of water25. Facile procedure of synthesis was adopted in the current work for construction of In2O3/MoS2/Fe3O4 hybrid nano-scaled photocatalyst. The ternary nano-scaled photocatalyst was found to exhibit excellent photocatalytic activities disintegrating esomeprazole, the target pollutant, within 50 min. The photodecomposition of esomeprazole by this nano-photocatalyst was found to follow pseudo-first order kinetics. In2O3/MoS2/Fe3O4 attained 92.92 ± 2.01% photodecomposition at a velocity constant of 0.06208 min−1 with TOC and COD reduction up to ~ 77.06% and ~ 66.71%. The fabrication of novel ternary nano-photocatalyst with excellent capacity to disintegrate an emerging water contaminant, esomeprazole, with superlative velocity constants marks the novelty of this work.
Experimental details
Materials and measurement
The following items of AR grade were acquired from Sigma Aldrich and used without further purification: Indium (III) nitrate hydrate (In(NO3)3.xH2O), sodium hydroxide (NaOH), ferrous sulphate heptahydrate (FeSO4 0.7H2O), ferric chloride (FeCl3), molybdenum(IV) sulfide (MoS2), esomeprazole magnesium, deionized water etc.
Most decomposition studies are performed in pure water ignoring the effects of various forms of environmental water on photodecomposition. For better understanding of photocatalysis, it is worth investigating the influences of the attendance of various inorganic ions, organic substances and various water matrices on the performances of the fabricated photocatalysts. A few grab samples of environmental waters namely mineral water, tap water and river water were therefore acquired for the investigation. Packaged sachet mineral water with pH 7.3 and TOC 0.25 ppm was procured from a local supermarket. Tap water with pH 7.8 and TOC 3.5 ppm was obtained from local drinking water systems while river water sample was sourced from the Barak River flowing through the state of Assam in India. The grab river water sample had a pH of 8.34 and TOC 5.3 ppm.
Synthesis
Synthesis of In2O3/MoS2/Fe3O4 and pristine samples
Deionized water was taken in a beaker and to it were added 20 mmol of FeSO4 0.7H2O and 30.8 mmol of FeCl3. Magnetic stirrer was used for dissolving the salts. Thereafter, aqueous solution of sodium hydroxide (NaOH) (224.8 mmol) was slowly added to it. The reaction mixture was left for stirring for 18 h. Next, 20 mmol of Indium (III) nitrate hydrate (In(NO3)3.xH2O) was added to this reaction mixture followed by stirring. An aqueous solution of sodium hydroxide (NaOH) (30 mmol) was then slowly poured into it. The final reaction mixture was stirred and then taken in a Teflon autoclave maintained at 110 °C for 18 h. The precipitate thus obtained was centrifuged and washed thoroughly with ethanol. After collection, the sample was dried and thereafter annealed at 300 °C for 3 h. The brown sample thus obtained was treated as In2O3/Fe3O4.
Next, MoS2 was exfoliated by ultrasonication in distilled water following which In2O3/Fe3O4 was added to it. This mixture was also ultrasonicated for 5 min and then dried to obtain the final nanohybrid of In2O3/MoS2/Fe3O4.
Pristine samples of In2O3, Fe3O4, exfoliated MoS2 and the binary nanohybrid were likewise prepared following the procedure illustrated above but only in presence of the respective starting materials. Indium (III) nitrate hydrate (In(NO3)3.xH2O) was used for fabricating In2O3 while Fe3O4 was prepared using the aforementioned iron salts in aforesaid proportion.
Characterization
In2O3/MoS2/Fe3O4, In2O3/Fe3O4, In2O3, MoS2, and Fe3O4 were analyzed for X-ray diffraction studies on Phillips XPERT powder X-ray diffractometer with Cu-Kα radiation. TEM, HRTEM and SAED were executed on JEOL JEM 2100 instrument for determination of size, morphology and diffraction rings of In2O3/MoS2/Fe3O4. X-ray photoelectron spectroscopy (XPS) of the final nanocomposite was carried out with PHI 5000 Versa Prob II spectrometer to investigate the electronic environment and valence states of elements in the two ternary nanocomposites. Photoluminiscence data were acquired with Hitachi F4600 equipment. Magnetic behaviour of Fe3O4 and In2O3/MoS2/Fe3O4 was ascertained employing Vibrating Sample Magnetometer. HRLCMS graphs were obtained using 1290 Infinity UHPLC System, Agilent Technologies, USA. TOC results were collected following analyses carried out using Elementar, Liqui TOC. GENESYS 10S UV–visible spectrophotometer was used for obtaining the absorbance spectra of various samples.
Evaluation of photocatalytic performance
The esomeprazole photodecomposition experiments were carried out in reaction cells that had working volume of 100 mL. LED light irradiation (with 11,770 lx and radiation intensity of 47.14 Wm−2) from an LED bulb affixed atop (Philips 23 W white LED) was shone over the reaction cell within a homemade chamber. A luxmeter was employed for the measurement of lux and radiation intensity. In a typical photocatalytic experiment, specified amount of the photocatalyst (0.7 gL−1 of In2O3/MoS2/Fe3O4) is suspended in 50 mL of aqueous solution of esomeprazole prepared using distilled water with at an initial pH of 5. Other requisite substances were incorporated before the dispersal of the photocatalyst in order to simulate aqueous matrices. Water matrices replaced distilled water in other investigative studies about the effect of environmental water samples on photodecomposition. Each test was carried out in quintet, putting the suspension in a dark environment under agitation for 30 min to attain adsorption–desorption equilibrium followed by exposure to LED illumination for 50 min for photodecomposition. The photodecomposition was recorded by noting the absorbance at the λmax of esomeprazole at 301 nm after every 10 min.
The photodecomposition efficiency was calculated using the following equation:
| 1 |
where the initial concentration of esomeprazole and the concentration after time t are given by C0 and C.
The photodecomposition kinetics was assessed using the following equation:
| 2 |
where the initial concentration of esomeprazole and the concentration after time t are given by C0 and C and k denotes the velocity constant of the photodegradation reaction proceeding in accordance with pseudo-first order kinetics model.
The error bars in the photodecomposition diagrams represent small standard deviations suggesting fair reproducibility of the experiment for five repetitions under a given set of conditions.
Results and discussion
XRD studies
The XRD diffraction pattern of In2O3/MoS2/Fe3O4 (Fig. 1) recorded prominent peaks corresponding to (222), (400) and (440) planes cubic In2O3 phase (JCPDS 06–0416) at 2θ angles of 30.63°, 35.52° and 51.06° respectively11 besides displaying peaks that could be indexed to (422), (431), (611), (620) and (541) planes at 2θ angles of 21.66°, 41.97°, 43.84°, 45.91°, 56.07°, 57.68° and 59.27° respectively. The presence of a prominent (023) peak at 34.23° along with accompanying peaks of (020), (100) and (151) planes at 18.96°, 32.08° and 60.09° respectively confirmed Fe3O4 phase (JCPDS 89–6466) in the nanohybrid. Furthermore, MoS2 phase (JCPDS 73–1508) could be ascertained by peaks indexed to (002), (100), (102), (103) and (006) planes at 14.45°, 32.86°, 35.21°, 39.72° and 44.34° respectively. The average crystallite size obtained using Scherrer formula in the ternary nanohybrid, In2O3/MoS2/Fe3O4, was 13.47 nm. In the powder XRD pattern of In2O3/Fe3O4 (Fig. 1), the prominent peaks of In2O3 (JCPDS 06–0416) and Fe3O4 (JCPDS 89–6466) phases could be identified. Peaks associated with (222), (400) and (440) planes of the cubic In2O3 phase at 2θ angles of 30.62°, 35.50° and 51.04° respectively along with those corresponding (211), (332), (422), (431), (611), (620) and (541) planes at 2θ angles of 21.62°, 41.90°, 43.79°, 45.81°, 56.02°, 57.61° and 59.19° respectively showed up11. Also were present peaks indexed to (020), (100), (023), and (151) planes at 18.96°, 32.08°, 34.21° and 60.09° respectively of Fe3O4 phase (JCPDS 89–6466) in the XRD plot of In2O3/Fe3O4. The average crystallite size obtained using Scherrer formula in the binary nanohybrid, In2O3/Fe3O4, was 13.78 nm. The XRD plots of the ternary and binary nanocomposites have been reproduced with the corresponding JCPDS cards of the pristine samples in Figure S1 (ESI). The XRD plot of the pristine In2O3 sample (Fig. 1) demonstrated (222), (400) and (440) planes of cubic In2O3 phase (JCPDS 06–0416) at 2θ angles of 30.56°, 35.42° and 51.01° respectively19 as well as other peaks (211), (332), (422), (431), (611), (620) and (541) planes at 2θ angles of 21.57°, 41.86°, 43.78°, 45.79°, 55.97°, 57.54° and 59.14° respectively. The average crystallite size obtained using Scherrer formula of the nano-scaled In2O3 was 14.41 nm. The XRD plot of pristine MoS2 (Fig. 1) showed (002), (100), (103), (006), (105) and (110) planes of MoS2 phase (JCPDS 73–1508) at 14.39°, 32.80°, 39.65°, 44.15°, 49.88° and 58.58° respectively26. The powder XRD pattern of Fe3O4 (Fig. 1) displayed a distinct peak at 30.33° corresponding to (100) plane (JCPDS 89–6466). It was additionally characterized by the occurrence of a superimposition of peaks associated with (023) and (111) planes with respective 2θ values of 34.15° and 34.72°. The plot bore four other minor peaks associated with (131) (115), (061) and (151) planes at 44.38°, 59.65°, 59.65° and 59.98°. The average crystallite size obtained using Scherrer formula of the nano-scaled Fe3O4 was 17.56 nm.
Figure 1.

XRD patterns of different samples of In2O3/MoS2/Fe3O4, In2O3/Fe3O4, In2O3, MoS2 and Fe3O4.
TEM, HRTEM and SAED analyses
The TEM micrographs of In2O3/MoS2/Fe3O4 (Fig. 2a,b) showed nano-scaled particles of In2O3 and Fe3O4 strewn across nanosheet of MoS2. The average diameter of these particles was found to be 13.94 nm. From the HRTEM image (Fig. 2c), distinct lattice fringes were revealed. Interplanar spacings allowed recognition of In2O3 and Fe3O4 nanoparticles over sheet of MoS2. The spacing of 0.292 nm could be linked to the (222) plane of cubic-phased In2O3 particle11 while that of 0.471 nm could be linked to (020) plane of Fe3O4. Although MoS2 nanosheet could not be clearly detected in the higher 2 nm resolution, a slightly lower 5 nm resolution image of the same region revealed flakes of MoS2 having a crystalline phase showing facet (002) that could be recognized from an interplanar spacing of 0.61 nm (Figure S2a ESI). The polycrystalline nature of the nanohybrid was suggested by the presence of concentric rings in the SAED pattern (Fig. 2d). Concentric rings corresponding to (222) plane of In2O3; the (122) and (023) planes of Fe3O4 and the (002) plane of MoS2 nanosheet were identified and marked in the SAED pattern (Fig. 3d).
Figure 2.

TEM (a,b) micrographs, HRTEM (c) micrograph and SAED patterns (d) of In2O3/MoS2/Fe3O4.
Figure 3.

(a) XPS survey spectrum of In2O3/MoS2/Fe3O4, HR-XPS spectra of (b) In, (c) Fe, (d) O, (e) Mo and (f) S in In2O3/MoS2/Fe3O4.
XPS investigation
For proper evaluation of the chemical composition and oxidation state of elements in the synthesized nanohybrid of In2O3/MoS2/Fe3O4, the sample was examined using XPS analysis. The XPS survey spectrum of In2O3/MoS2/Fe3O4 (Fig. 3a) displayed peaks associated with In 3d, Fe 2p, O 1 s, Mo 3d and S 2p. The 3d core level spectrum of In (Fig. 3b) revealed two peaks at 444.23 eV and 451.79 that corresponded to 3d5/2 and 3d1/2 electrons of In3+ 27. The reported values of binding energy of 3d5/2 and 3d1/2 electrons of In3+ hover around 444 eV and 451.50 eV27. This suggests a small shift towards higher binding energy values of 3d5/2 and 3d1/2 orbitals of In3+ in the ternary nanocomposite. The HR-XPS of Fe (Fig. 3c) produced a doublet centered on binding energy values of 710 eV and 722 eV corresponding to Fe 2p3/2 and Fe 2p1/2. Deconvolution further unveiled contributions from Fe2+ in octahedral environment and Fe3+ ions in either octahedral or tetrahedral sites28–31. Peaks at 708.36 eV and 722.51 eV could be assigned to Fe2+ 2p3/2 and Fe2+ 2p1/2 electrons while peaks at 709.48 eV and 711.30 eV could be associated with the Fe3+ ion encased within octahedral and tetrahedral voids respectively. The core level spectrum was also characterized by the presence of three satellite peaks at binding energies of 717.15 eV, 724.79 eV and 730.95 eV28–31. These binding energy values had slightly lower magnitude in pristine samples of Fe3O4 as reported in previous works28,29. The high-resolution O 1 s spectrum (Fig. 3d) contained three peaks positioned at 530.13 eV, 531.59 eV and 535.77 eV that, in all likelihood, were generated lattice bound O2− ions, O2− ion in the oxygen-vacancy zone and chemisorbed oxygen on the nanohybrid surface respectively. Figure 3e contains core level signals of Mo 3d and S 2s26,32,33. The Mo 3d was found to be doublet consisting of 3d5/2 at 229.59 eV and 3d3/2 at 232.73 eV26,32,33. The S 2s signal appears at 226.84 eV32,33. The S 2p core level spectrum (Fig. 3f) was marked by the presence of a doublet at binding energy values of 162.84 eV and 164.04 eV corresponding to S 2p3/2 and S 2p1/2 electrons32,33. However, in pristine sample reported in literature26,32,33, all these peaks took on slightly lower binding energy values. The abovementioned facts, therefore suggest a successful synthesis of a coupled nano-scaled semiconductor system, namely, In2O3/MoS2/Fe3O4. The slight shift in binding energy values observed in core level spectrum of individual elements in comparison with those in pristine samples of previously reported works could be ascribed to the creation of a different electron density arising from transfer of electrons and interactions at the interface caused by the formation of a heterojunction in the nanocomposite34.
SEM and EDAX studies
SEM micrographs (Fig. 4b,c,d) of the nanohybrid again showed nanoparticles of the two metal oxides spread across sheets of MoS2. MoS2 nanosheets were discernible in Figure S2b (ESI). Furthermore, more significant information was extracted from EDAX analysis of In2O3/MoS2/Fe3O4. From the EDAX spectrum (Fig. 4a), Table 1 presenting the elemental composition of the nanohybrid was made. The EDAX spectrum In2O3/MoS2/Fe3O4 showed the Kα lines of Fe and O, at 6.4 eV and 0.50 eV. Lα lines of In and Fe at 3.30 eV and 0.70 eV were also visible. In2O3/MoS2/Fe3O4 EDAX spectrum additionally bore the Lα line of Mo and Kα emission of S both standing superimposed at 2.30 eV. The SEM-EDAX analyses therefore lend credence to the successful formation of the desired nanohybrid photocatalyst.
Figure 4.

(a) EDAX spectrum of In2O3/MoS2/Fe3O4. (b), (c) and (d) SEM micrographs of In2O3/MoS2/Fe3O4.
Table 1.
A chart of the elemental composition of the nanohybrid In2O3/MoS2/Fe3O4 from EDAX spectrum.
| Element | Line Type | Weight% | Atomic% |
|---|---|---|---|
| O | K-series | 9.97 | 32.84 |
| In | L-series | 37.44 | 17.18 |
| Fe | K-series | 23.61 | 22.28 |
| Mo | L-series | 18.20 | 9.99 |
| S | K-series | 10.78 | 17.71 |
| Total | 100 | 100 |
Investigation of optical properties
For evaluation of optical performance of the prepared nano-scaled samples, they were subjected to UV–visible spectrometry (Fig. 5a). The absorption edges of pristine In2O3, and Fe3O4 were found to be around ~ 344 nm35 and ~ 424 nm respectively generating from transition of electrons from the valence band to the conduction band. The hump of the Fe3O4 absorbance curve is readily evident in the enlarged picture of Figure S3a (ESI). The UV–vis absorption spectra of pristine MoS2 (Fig. 5a) revealed a broad absorption peak centered on ~ 450 nm owing to direct excitonic transitions at the point K in the Brillouin zone36,37. On the other hand, peaks at ~ 620 nm and ~ 678 nm could be arising from excitonic transitions from the deep level in the valence band to the conduction band at the M point of the Brillouin zone36,37. The absorption maxima of the binary nanohybrid In2O3/Fe3O4 showed an extended hump centered on ~ 363 nm. Coupling could have resulted in a red shift from the absorption maxima of the pristine In2O3. The UV–visible spectra of final nanocomposite of In2O3/MoS2/Fe3O4 revealed hump centered at ~ 520 nm extending across the visible region. Probable electronic transitions from valence band to conduction band of the ternary nanohybrids and besides substantial interfacial interactions among the moieties of the nanohybrids are thus indicated. Additionally, there could also arise mixing of the outermost s orbitals of In and Fe creating conduction bands at lower energy values. Tauc’s plot (inset of Fig. 7a) was employed to evaluate the band gaps of all the synthesized samples. Pristine In2O3, Fe3O4, and MoS2 had band gaps of 2.79 eV, 1.70 eV and 1.91 eV, respectively. Enlarged diagram of Tauc’s plot is provided in Figure S3b (ESI). The band gap of In2O3/Fe3O4 was found to be 2.88 eV. The final nanohybrid of In2O3/MoS2/Fe3O4 had band gap of 2.15 eV. UV–visible absorbance data confirmed the integration of different moieties in the formation of the intended nanohybrid.
Figure 5.

(a) UV–visible absorbance spectra of the various nanomaterials with an inset showing their respective Tauc’s plot for calculation of band gaps and (b,c,d) Photoluminiscence graphs.
Figure 7.

(a) Photodegradation dynamic curves of esomeprazole at different catalyst loading In2O3/MoS2/Fe3O4 and (b) its corresponding kinetics. (c) Photodegradation dynamic curves of esomeprazole at different esomeprazole concentration loading over /MoS2/Fe3O4 and (d) its corresponding kinetics. (e) Photodegradation dynamic curves of esomeprazole at different pH over In2O3/MoS2/Fe3O4 and (f) its corresponding kinetics.
Photoluminiscence (PL) spectroscopy was carried out to access further insights into the optical properties and to make a comparison of the photoluminiscence behaviour of the as-fabricated nanohybrid samples with the pristine moieties. The emission spectrum of In2O3 (Fig. 5b) is obtained by exciting the sample at ~ 344 nm. A strong blue emission band around ~ 413 nm marked the spectrum. A small peak was observed at ~ 490 nm due to red emission38. The intensity of the emission peak decreased with an increase of doping concentration. A near absence of these emission peaks in the photoluminescence spectra of the nanohybrids suggested a decline in the rate of charge recombination. Further work is to be done in order to grasp a definite insight into the phenomenon. The PL spectrum of pristine MoS2 (Fig. 5c) recorded peaks at ~ 624 nm and ~ 674 nm, associated with the exciton transitions in the K-point of the Brillouin zone, respectively36,37,39–41. The emission peaks at ~ 623 nm and ~ 674 nm are characteristic exciton peaks of MoS2 monolayer whose energy separation is due to spin–orbit splitting at the top of the valence band at the K point of the 1st Brillouin zone41. The emission spectrum of In2O3/MoS2/Fe3O4 recorded a peak at ~ 674 nm with a greatly diminished intensity. Finally, comparison of In2O3/MoS2/Fe3O4 was made with the pristine Fe3O4 sample and for this purpose all the samples of In2O3/MoS2/Fe3O4, In2O3/Fe3O4 and pristine Fe3O4 were excited at ~ 421 nm and the consequent emission spectra were duly registered (Fig. 5d). A sharp peak at ~ 490 nm characterized the Fe3O4 PL spectrum. Minor peaks cluttered around ~ 575 nm, ~ 610 nm and ~ 635 nm. The sharp peak at ~ 490 nm arose as a result of near band-edge emission. Deep level emission induced by several crystal defects might account for the appearance of other minor peaks. In the PL spectrum of In2O3/Fe3O4, all these peaks appear with reduced intensity. In the emission spectrum of In2O3/MoS2/Fe3O4, all the aforesaid peaks were even less intense. Furthermore a slight red shift was observed in the nanocomposites when compared with the emission spectra of pristine In2O3. This was consistent with the results of UV–visible absorbance spectra and could be attributed to interfacial interactions between the moieties of the nanohybrids42–44. The PL data therefore support the interactive integration of the moieties of the two final nanohybrids that resulted in a reduction in the recombination of charge carriers further undermined by the trapping of electrons by Fe3+ ions of the Fe3O4 integrant.
Magnetic behaviour
In order to evaluate the response of pristine Fe3O4 and In2O3/MoS2/Fe3O4 towards externally applied magnetic fields for proper evaluation of their magnetic properties, the initial magnetization versus field measurements of the samples were performed by magnetometer operating at ambient temperatures, with the field sweeping from − 15,000 to 15,000 Oe following which the magnetization hysteresis curves were obtained (Fig. 6a,b). Both the samples so designed demonstrated considerable superparamagnetic nature. The magnetic saturation and coercivity (Hci) of pristine Fe3O4 (Fig. 6a) were 56.58 emu g−1 and 13.892 G respectively, while, In2O3/MoS2/Fe3O4 exhibited magnetic saturation of 31.98 emu g−1 and coercivity (Hci) of 10.768 G (Fig. 6b).
Figure 6.

Magnetic hysteresis curves of (a) Fe3O4 and (b) In2O3/MoS2/Fe3O4.
Evaluation of the impacts of operating parameters on the photocatalytic decomposition of esomeprazole
Influence of photocatalyst loading
The influence of the catalyst content required for the photodecomposition of esomeprazole was put to scrutiny. For this, other operating parameters, such as initial esomeprazole concentration and initial pH were held constant respectively at 25 ppm and 7 and the catalyst content was altered across the range 0.1–1 gL−1. The optimum quantity of 0.7 gL−1 of In2O3/MoS2/Fe3O4 (Fig. 7a) was required for accomplishing esomeprazole photodecomposition of ~ 88.61 ± 2.14% at a velocity constant of ~ 0.04578 min−1 (Fig. 7b and Table 2). A gradual rise in esomeprazole photodecomposition with increase in catalyst dosage was recorded until the optimal limit beyond which photodecomposition declined. With increase in catalyst loading, solution opacity rises. With consequent increased turbidity and light scattering, there occurred increased shortening of photon path-length. As a result, photons could not traverse deep into the suspension. This prevented activation of the entire catalyst surface that eventually led to subdued generation of active radicals, thereby reducing the photodecomposition efficiency. Optimization of photocatalyst content is absolutely necessary to avert inordinate use of it in the experiment.
Table 2.
Photodegradation chart of esomeprazole over In2O3/MoS2/Fe3O4 at different catalyst doses.
| Dose of catalyst (gL−1) | % degradation | k (min−1) | R2 |
|---|---|---|---|
| 0.1 | 81.16 ± 1.98 | 0.03145 | 0.99629 |
| 0.2 | 82.61 ± 2.05 | 0.03392 | 0.99803 |
| 0.3 | 83.96 ± 2.03 | 0.03569 | 0.99780 |
| 0.4 | 85.44 ± 1.99 | 0.03875 | 0.99759 |
| 0.5 | 86.78 ± 1.87 | 0.4155 | 0.99818 |
| 0.6 | 87.57 ± 2.12 | 0.04433 | 0.99881 |
| 0.7 | 88.61 ± 2.14 | 0.04578 | 0.99875 |
| 0.8 | 86.56 ± 2.11 | 0.04298 | 0.99876 |
| 0.9 | 84.03 ± 2.16 | 0.04046 | 0.99863 |
| 1.0 | 82.19 ± 2.13 | 0.03789 | 0.99956 |
Influence of initial esomeprazole concentration
The influence of initial concentration of esomeprazole was investigated next. For this the optimal catalyst content was taken and the pH was held constant at 7. The photodecomposition was carried out using initial concentration of the pharmaceutical varying from 5 to 50 ppm. Over 0.7 gL−1 of In2O3/MoS2/Fe3O4 photocatalyst, esomeprazole decomposition first increased with drug concentration, became highest at 35 ppm and then declined (Fig. 7c). At this optimal drug concentration, In2O3/MoS2/Fe3O4 achieved a photodecomposition efficiency of ~ 90.12 ± 2.06%with a velocity constant of ~ 0.05144 min−1 following pseudo-first order kinetics (Fig. 7d and Table 3). There could be three reasons for a fall in photodecomposition efficiency beyond the optimal value of pharmaceutical concentration. One, with increase in pharmaceutical concentration, the ability of photons to penetrate deep into the solution decreases leading to lower efficiency of photodecomposition. Two, for photodecomposition of the drug beyond the optimal value, extra amount of photocatalyst would be required which would again enhance solution opacity. Three, as the pharmaceutical concentration is increased, greater number of active sites on the photocatalyst surface was occupied by the pharmaceutical species eventually evicting surface-adsorbed hydroxide ions and oxygen molecules from the active sites. The generation of active radicals by the photocatalyst thus suffered a setback leading to reduced photodecomposition efficiency.
Table 3.
Photodegradation chart of esomeprazole over In2O3/MoS2/Fe3O4 at different concentrations of esomeprazole.
| Concentration of esomeprazole (ppm) | % degradation | k (min−1) | R2 |
|---|---|---|---|
| 5 | 86.33 ± 2.07 | 0.03899 | 0.99856 |
| 10 | 86.73 ± 1.97 | 0.04064 | 0.99790 |
| 15 | 87.72 ± 2.05 | 0.04266 | 0.99858 |
| 20 | 88.12 ± 2.16 | 0.04393 | 0.99874 |
| 25 | 88.61 ± 2.14 | 0.04578 | 0.99875 |
| 30 | 89.06 ± 2.17 | 0.04658 | 0.99872 |
| 35 | 90.12 ± 2.06 | 0.05144 | 0.99890 |
| 40 | 89.58 ± 2.26 | 0.04813 | 0.99882 |
| 45 | 88.28 ± 2.19 | 0.04668 | 0.99889 |
| 50 | 86.56 ± 2.09 | 0.04381 | 0.99863 |
Influence of initial pH
The influence of initial pH was examined using fixed initial drug concentration of 35 ppm and an optimum catalyst dosage (0.7 gL−1). There was initially an intensification of photodecomposition behaviour as pH was increased but after a pH of 5, there was a slight reduction in photodecomposition efficiency (Fig. 7e). At the optimal pH, an esomeprazole photodecomposition efficiency of ~ 92.92 ± 2.01% was observed at a pseudo-first order velocity constant of ~ 0.06208 min−1 (Fig. 7f and Table 4). Esomeprazole stays predominantly in protonated form under acidic conditions, however, as the pH rises, deprotonated, anionic form of esomeprazole predominates45,46. As initial pH rises, there hydroxide ions increasingly accumulates over the photocatalyst surface leading to an intensified electrostatic effect that would render the photocatalyst surface repulsive to the deprotonated esomeprazole, which would exert a negative effect on the photodecomposition.
Table 4.
Photodegradation chart of esomeprazole over In2O3/MoS2/Fe3O4 at different pH values.
| pH | % degradation | k (min−1) | R2 |
|---|---|---|---|
| 4 | 92.24 ± 2.05 | 0.05757 | 0.99849 |
| 5 | 92.92 ± 2.01 | 0.06208 | 0.99811 |
| 6 | 91.62 ± 2.05 | 0.05596 | 0.99840 |
| 7 | 90.12 ± 2.06 | 0.05144 | 0.99890 |
| 8 | 88.26 ± 2.20 | 0.04822 | 0.99640 |
Influence of contact time
To determine the influence of contact time, optimum values of operating parameters were employed (Fig. 8a,b). Photodecomposition experiments were executed using 0.7 gL−1 of In2O3/MoS2/Fe3O4 alongside a fixed initial pharmaceutical concentration of 35 ppm and an initial pH of 5. After 50 min no noticeable photocatalytic activity could be observed. This near stoppage in the photocatalytic decomposition of esomeprazole could be due to saturation of the surface of the nano-scaled hybrid photocatalysts so that no active sites are available for further photocatalytic decomposition.
Figure 8.

(a) Photodegradation dynamic curves of esomeprazole and (b) kinetics for different catalysts. (c) Photodegradation dynamic curves of esomeprazole at different H2O2 doses over In2O3/MoS2/Fe3O4 and (d) its corresponding kinetics. (e) Plot of TOC/TOC0 vs. time. (f) Plot of COD/COD0 vs. time.
Influence of H2O2
H2O2 addition has been known to augment decomposition of organic species47–50. Further, the presence of Fe3O4 as a moiety in the nanohybrid of In2O3/MoS2/Fe3O4 could also enable activation of a Fenton-like phenomenon upon incorporation of H2O2 in the photodecomposition reaction mixture. Therefore, it was absolutely necessary to explore the influence of H2O2 on the photocatalytic activities of the fabricated nano-scaled integrated photocatalysts. This was done by varying the dosage of H2O2 in the range of 5–10 µL/50 mL of the reaction mixture. Over the integrated nano-photocatalyst system, decomposition activity initially registered a spike till a value of 7 µL/50 mL H2O2 dosage and then it displayed a minor slump with further addition of H2O2 (Fig. 8c,d). Upon illumination with visible light, there occurred self-disintegration of H2O2 producing ·OH radicals that accounted for the initial surge in decomposition behaviour.
| 3 |
Additionally, Fe on the surface of the nano-photocatalysts could trigger augmented generation of ·OH radicals via FeIII/FeII redox couple.
| 4 |
| 5 |
| 6 |
| 7 |
Ligand displacement leads to the formation of a complex designated by FeIII-H2O2. This complex thereafter undergoes intermolecular electron transfer generating HO2· radicals with the simultaneous reduction of FeIII to FeII. HO2· radicals thus generated undergo reaction with FeIII causing further reduction of FeIII to FeII. Eventually, FeII and H2O2 react together to produce ·OH radicals that makes unselective attacks on the drug species causing its disintegration.
Under alkaline conditions, there could also be the formation of a less reactive ferryl ion species (FeIV-O)51.
| 8 |
Self-absorption of ·OH radical by H2O2 could account for the minor decline in the decomposition efficiency at H2O2 doses beyond the optimal value.
| 9 |
Decomposition profile over In2O3/MoS2/Fe3O4 alongside H2O2 is demonstrated in Table 5. At an optimal H2O2 dosage of 7 µL/50 mL, a photodecomposition efficiency of ~ 94.17 ± 2.03% was registered over In2O3/MoS2/Fe3O4 at pseudo-first order velocity constant of ~ 0.06798 min−1.
Table 5.
Photodegradation chart of esomeprazole over In2O3/MoS2/Fe3O4 at different doses of H2O2.
| Dose of H2O2 (µL/50 mL) | % degradation | k (min−1) | R2 |
|---|---|---|---|
| 0 | 92.92 ± 2.01 | 0.06208 | 0.99811 |
| 5 | 93.55 ± 2.23 | 0.06534 | 0.99814 |
| 6 | 94.17 ± 2.03 | 0.06798 | 0.99881 |
| 7 | 94.78 ± 2.08 | 0.06980 | 0.99948 |
| 8 | 92.30 ± 2.05 | 0.05935 | 0.99756 |
| 9 | 90.77 ± 2.20 | 0.05465 | 0.99852 |
| 10 | 87.28 ± 2.25 | 0.05079 | 0.99817 |
Performances of different photocatalysts
Figure 8a and Table 6 display photocatalytic performances of different photocatalysts while Fig. 8b represents the corresponding photodegradation kinetics. Photolysis carried out in absence of catalysts showed no appreciable decomposition of the pharmaceutical. The pristine samples also showed inferior decomposition capacities. Pristine In2O3 could barely affect appreciable photodecomposition of esomeprazole. Pristine MoS2 brought about ~ 16.43 ± 2.01% of esomeprazole decomposition at pseudo-first order velocity constant of ~ 0.00054 min−1. The binary nanohybrid of In2O3/Fe3O4 attained ~ 43.26 ± 1.51% esomeprazole decomposition obeying pseudo-first order kinetics with a velocity constant of ~ 0.01503 min−1. Esomeprazole photodecomposition over In2O3/MoS2/Fe3O4 was considerably remarkable as the nano-scale integrated photocatalyst was able to bring on ~ 92.92 ± 2.01% of the drug decomposition within 50 min at a pseudo-first order velocity constant of ~ 0.06208 min−1 with TOC reduction and COD reduction up to ~ 77.06% and ~ 66.71% respectively (Fig. 8e,f). In2O3/MoS2/Fe3O4 functioned ~ 2.15 times better than the binary nanohybrid on the efficiency front. As discussed earlier, the presence of H2O2 had an augmenting effect on photocatalysis as decomposition efficiency In2O3/MoS2/Fe3O4 went up to ~ 94.17 ± 2.03%.
Table 6.
Photodegradation chart of esomeprazole over various catalysts.
| Samples | % degradation | k (min−1) | % TOC removal | % COD reduction | R2 |
|---|---|---|---|---|---|
| In2O3/MoS2/Fe3O4 + H2O2 | 94.78 ± 2.08 | 0.06980 | 80.17 | 70.82 | 0.99948 |
| In2O3/MoS2/Fe3O4 | 92.92 ± 2.01 | 0.06208 | 77.06 | 66.71 | 0.99811 |
| In2O3/Fe3O4 | 43.26 ± 1.51 | 0.01503 | 46.77 | 41.33 | 0.97721 |
| Fe3O4 + H2O2 | 38.44 ± 1.52 | 0.01315 | 40.23 | 35.74 | 0.98151 |
| MoS2 | 16.43 ± 2.01 | 0.00054 | 28.96 | 14.86 | 0.99161 |
Reusability of the fabricated ternary nanohybrids
Reusability is absolutely vital for the proper appraisal of the stability, longevity and efficacy of a fabricated nano-scaled photocatalyst. Therefore, after the complete process of esomeprazole photodecomposition, the hybrid nano-scaled photocatalyst was subjected to reusability tests.
The photocatalyst was first magnetically recovered. It was further subjected to regeneration by washing with deionized water and ethanol and then drying in an oven at 70 °C. The photocatalyst was used again for the decomposition of esomeprazole and for five consecutive times and it demonstrated fairly consistent decomposition behaviour (Fig. 9a,b) without any noteworthy slump in photocatalytic performance (Table 7). The slight fall of photodecomposition efficiency registered by the photocatalyst in this course could be attributed to the dislodgement of the moieties from the integrated photocatalyst system. XRD analysis of the photocatalyst was done before and after (Fig. 10) the fifth cycle of the pharmaceutical decomposition for determination of variations in crystallinity. No appreciable variations in crystallinity of In2O3/MoS2/Fe3O4 were noted before and after photocatalytic performance. The crystallographic planes that appeared in the unused photocatalyst also made their presence in the XRD plot of the recycled photocatalysts suggesting retention of crystallographic structure of the photocatalyst after five consecutive runs of photodecomposition experiment. This implied that the integrated photocatalyst was stable, durable and efficient.
Figure 9.

(a) Photodegradation dynamic curves of esomeprazole for five consecutive runs over In2O3/MoS2/Fe3O4 and (b) its corresponding kinetics.
Table 7.
Photodegradation chart of esomeprazole over In2O3/MoS2/Fe3O4 for five cycles.
| Runs | % degradation | k (min−1) | R2 |
|---|---|---|---|
| 1st | 92.92 ± 2.01 | 0.06208 | 0.99811 |
| 2nd | 90.43 ± 2.13 | 0.05658 | 0.99863 |
| 3rd | 88.23 ± 2.12 | 0.05262 | 0.99869 |
| 4th | 85.24 ± 2.18 | 0.04739 | 0.99853 |
| 5th | 82.88 ± 2.11 | 0.04378 | 0.99889 |
Figure 10.

XRD pattern for fresh and recycled In2O3/MoS2/Fe3O4.
Scavenger experiments
The influences of incorporating radical scavengers were also determined. The objective behind this study was to properly asses the roles played by the reactive species such as ·OH, O2−·, e−, and h+. Scavengers were added during photodecomposition experiments for trapping of reactive species for ascertaining the species that actively trigger/s disintegration of esomeprazole in aqueous medium. 4-hydroxy-2,2, 6,6- tetramethylpiperidinyloxy (TEMPOL) is a O2−· scavenger and is widely known to quench the radical leading to a slowdown of the photocatalytic kinetics driven by O2−· radicals. The addition of TEMPOL had a marked negative effect on the photocatalytic decomposition dynamics of esomeprazole decomposition over In2O3/MoS2/Fe3O4. With insertion of 1 mmol of TEMPOL, the esomeprazole photodecomposition efficiency dropped to ~ 20.77%. Likewise, tert-butanol (t-BuOH) is a ·OH scavenger and has been reported to inhibit photocatalysis instigated by ·OH radicals. Indeed, photodecomposition was appreciably but moderately inhibited upon incorporation of 1 mmol of t-BuOH. The insertion of t-BuOH brought on a drastic slowdown in the photodecomposition dynamics of esomeprazole decomposition over In2O3/MoS2/Fe3O4. Efficiency dropped to ~ 51.21% over In2O3/MoS2/Fe3O4. The hole scavenger, triethanolamine TEOA and the electron scavenger, K2S2O8 didn’t have any significant disruptive effects on the photodecomposition dynamics of esomeprazole decomposition evidently suggesting the minor roles played by holes and electrons. Therefore, it emerged from the study that ROS such as O2−· and ·OH were chiefly involved in triggering photodecomposition of aqueous esomeprazole over the photocatalyst. Figure 11 shows the photodecomposition behaviour in presence of the aforementioned scavengers over In2O3/MoS2/Fe3O4.
Figure 11.

Effect of scavengers on photodegradation.
Mechanism of photodecomposition over ternary nanohybrid photocatalysts
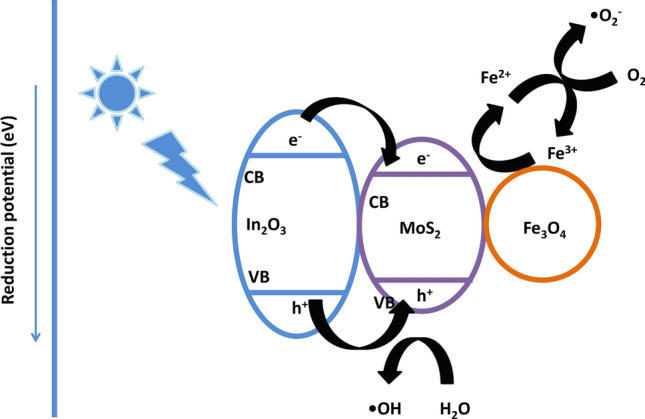
In view of the aforementioned experimental results, the mechanism of photocatalysis by In2O3/MoS2/Fe3O4 is illustrated in Fig. 12. The CB of In2O3 (~ − 0.6 eV versus SHE) being more negative than that of MoS2 (~ − 0.5 eV versus SHE), there was a migration of photogenerated electrons from the CB of In2O3 to that of MoS2 following which there occurred interaction of these electrons with adsorbed O2 species to form O2−· 46,47. With a band gap of 1.91 eV, the VB of MoS2 (~ + 1.39 eV versus SHE) would be placed higher than that of In2O3 (∼ + 2.2 eV versus SHE)52,53. This would drive holes from the VB of In2O3 to that of MoS2. The interaction of holes with H2O would enable production of ·OH. The involvement of FeIII/FeII redox couple would cause additional generation of ·OH radicals. Such interactions to produce reactive species have been previously reported over Fe3O4 containing photocatalytic systems18,19,54–56. In our experiment, we admit, it is difficult to prove the formation of such an intermediate hypervalent Fe-IV species during photodegradation mechanism. However, certain works have cited the possible generation of such species57–59. These reactive species caused decomposition of esomeprazole as illustrated below:
| 10 |
| 11 |
| 12 |
| 13 |
| 14 |
| 15 |
| 16 |
| 17 |
| 18 |
| 19 |
Figure 12.

Schematic diagram of the plausible mechanism of degradation.
Additionally, there might also occur transference of electrons from the conduction band of Fe3O4 to that of MoS2 eventually leading to the generation of the aforementioned reactive species. Furthermore, HRLCMS conducted at a halfway stage of light assisted disintegration of esomeprazole over In2O3/MoS2/Fe3O4, made it possible to outline a plausible pathway of esomeprazole decomposition (Fig. 13). Figure S4 shows liquid chromatograms obtained for esomeprazole decomposition over the two ternary nanohybrid photocatalyst and Figures S5 display the mass spectra corresponding to various intermediates.
Figure 13.
Plausible disintegration pathway of esomeprazole.
Influence of inorganic salts
The influence exerted by inorganic salts on the photocatalytic decomposition of organic contaminants has been investigated in several studies60–62. The impacts of inorganic ions and cations on the photodecomposition efficiency of esomeprazole decomposition over the two ternary photocatalysts were studied.
In this study it emerged that chloride ions hindered the progress of photocatalytic decomposition of aqueous esomeprazole over In2O3/MoS2/Fe3O4. Decomposition dynamics after incorporation of chloride ions in the photocatalysis reaction vessel is illustrated in Fig. 14a. The data reproduced in Table S1 indicates the gradual suppression of esomeprazole decomposition with increase in chloride concentration. This is ascribed to the quenching of hydroxyl radicals by chloride ions. Further, due to preferential adsorption of chloride ions at active sites of the photocatalysts, there might occur encircling of the photocatalysts by chloride ions leading to further slowdown of photocatalysis. Figures S6a depicts the kinetics of these photodecomposition experiments. The equations underneath describe the happenings in presence of chloride ions:
| 20 |
| 21 |
| 22 |
Figure 14.

Photodegradation dynamic curves of esomeprazole in presence of different concentrations of (a) chloride, (b) sulfate and (c) bicarbonate over In2O3/MoS2/Fe3O4. (d) Photodegradation dynamic curves of esomeprazole in presence of different cations over In2O3/MoS2/Fe3O4.
The chloride ions first undergo adsorption on photocatalyst surface and thereafter following reaction with photogenerated holes are oxidized to chlorine free radicals. These radicals further interact with electrons to get reduced to chloride ions. The photodecomposition inhibiting power of chloride ions could be assigned to its non-oxidizable nature. Greater concentration of chloride ions leads to severely intense adsorption and interactions with photo-holes as a result of which esomeprazole decomposition declines.
Next the influence of sulfate ions on the pharmaceutical degradation was examined. It is obvious from Table S2 that the introduction of sulfate ions also had a negative effect on the photocatalytic decomposition of esomeprazole over the ternary photocatalyst. With rise in concentration of sulfate ions, photodegradation gets impeded. This is also illustrated in Fig. 14b. In comparison with chloride ions, the bulkier sulfate ions could be more intensely adsorbed on the photocatalyst surface and its bivalent nature would only reinforce the process. After adsorption, the sulfate ions would undergo interactions with reactive species as illustrated below:
| 23 |
| 24 |
| 25 |
The above reactions readily explain the intense retarding effect exerted by sulfate ion on esomeprazole degradation. Figure S6b depicts the kinetics of these photodecomposition experiments.
The influence of bicarbonate on photocatalysis ions was then studied. A decline in photodegradation of esomeprazole over both the ternary photocatalysts was yet again observed. The two-fold mechanism of competing for reactive species and blockage of active sites on photocatalyst surface by adsorption of bicarbonate ions might account for the impeding effect exerted by the presence of the anion. The following second order reaction explains the interaction:
| 26 |
There is a gradual decrease in the decomposition efficiency with increase in the concentration of bicarbonate ions as illustrated in Table S3. Figures (14c and S6c) portray degradation profiles over the ternary photocatalyst.
Several metal cations are usually present in wastewater and therefore their impacts on the decomposition of organic contaminant were studied. Na+, Ca2+ and Al3+ would not obstruct photocatalytic degradation because they are in their stable oxidation state. In this study to examine the effects of these cations, esomeprazole degradation was carried out in presence of 0.01 M of Na2SO4, CaSO4 and Al2(SO4)3. The data thus generated is presented in Table S4 while degradation dynamics are portrayed in Figs. (14d and S6d). Quite evidently there is a hindrance offered by these salts in varying degrees to photocatalytic degradation although this obstruction could be due to the suppressing influence by sulfate ions of the salts. Highest retarding effect was exerted by aluminum salt and this could be due to adsorption of Al3+ ions at the active sites of the photocatalysts.
Influence of organic acids, other organic compounds and environmental waters
The decomposition of living organism generates organic acids that are found to accumulate in aquatic environment and therefore the influences of a few organic acids like oxalic acid, citric acid, tartaric acid and lactic acid on photodecomposition of esomeprazole was investigated. 0.5 mmolL−1 of each of these acids was incorporated in the photocatalysis reaction vessel and their effects on photocatalytic activity was recorded. All of them accelerated photodecomposition and also the photodecomposition yield. In presence of oxalic acid with two -COOH groups in which one -OH of a -COOH influenced by ortho-COOH functions like α-OH group the highest photodecomposition yield and the maximum magnitude of velocity constant were registered. Citric acid having three -COOH groups and an α-OH group came next followed by tartaric acid (two -COOH groups and two α-OH groups) and then lactic acid (one -COOH group and one α-OH group). While investigating the effect of pH on photodegradation, although a slight initial increase up till pH 5 followed by a slight decrease in the yield was noted, there wasn’t any reduction in the optimal contact time of the reaction. However, in presence of organic acids, there was a marked acceleration of photodecomposition that led to a considerable reduction of optimal contact time to 40 min. Hence, the effect of pH in this phenomenon may be ignored. The number of -COOH and α-OH groups, however, could be correlated to this acceleration of photodecomposition63,64. Although precise elaboration of parameters affecting this phenomenon will require further work along this direction. The decomposition profile is shown in Fig. 15 and its corresponding kinetics in Figure S7. Table S5 demonstrates the photocatalytic performances in presence of the organic acids.
Figure 15.
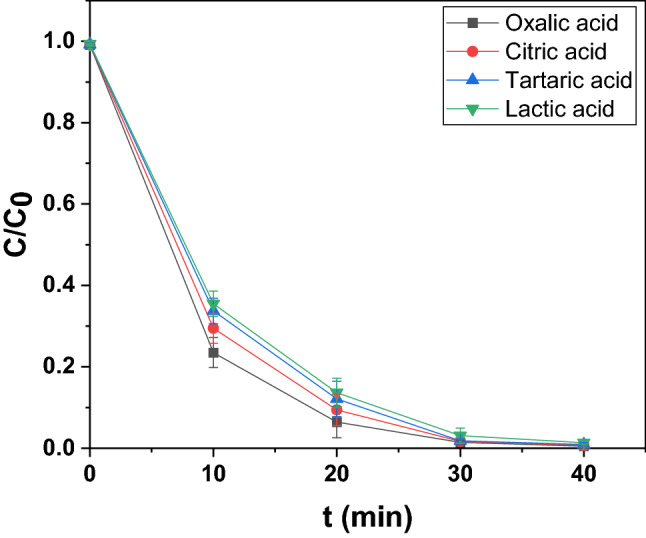
Photodegradation dynamic curves of esomeprazole in presence of different organic acids over In2O3/MoS2/Fe3O4.
The influence of organic moieties such as, acetone, humic acid sodium salt (HAS) and sodium dodecyl sulfate (SDS) on esomeprazole photodegradation over In2O3/MoS2/Fe3O4 was also investigated. With remarkable solvent properties acetone is frequently used in industrial applications and everyday life. Humic acids and SDS are also frequently found in wastewater.
As a photosensitizer, acetone has the repute to enhance photodegradation besides also exerting a decelerating effect. Acetone-photosensitization may proceed through the route delineated below:
| 27 |
| 28 |
| 29 |
| 30 |
| 31 |
In very low doses of acetone (0.001 M), the suppressing effect showed up. However, as the acetone concentration increased, photosensitization took over producing ·OH radicals that led to enhanced esomeprazole decomposition. The retarding drag exerted by acetone could be due to the decomposition of acetone that competed with esomeprazole decomposition. Table S6 shows the results obtained from these experiments, while Figs. (16a and S8a) portray the corresponding degradation profiles.
Figure 16.

Photodegradation dynamic curves of esomeprazole photodegradation in presence of different concentrations of (a) acetone, (b) HAS and (c) SDS over In2O3/MoS2/Fe3O4. Photodegradation dynamic curves of esomeprazole photodegradation in different water matrices over In2O3/MoS2/Fe3O4.
Table S7 shows the influence of HAS on esomeprazole decomposition over In2O3/MoS2/Fe3O4. In both the cases, HAS retarded the rate of decomposition. Besides, lowering the light intensity through water, HAS quenches hydroxyl radicals and also deactivates photocatalyst surface, thereby impeding the process of photocatalytic decomposition of water pollutants. Figures (16b and S8b) depict the corresponding degradation profiles. Retarding effect of SDS upon esomeprazole decomposition over the ternary photocatalyst was observed. Table S8 shows the influence of SDS on esomeprazole decomposition over In2O3/MoS2/Fe3O4. The probable reasons could be the formation of micelles around the drug species and interference by sulfate ions engendered by SDS photolysis. However, in this study, SDS concentrations below its critical micelle concentration (0.0085 molL−1 at 303.15 K) were used and so, the slump in photocatalytic activity upon incorporation of SDS could be chiefly ascribed to competitive adsorption and suppression by sulfate ions. Figures (16c and S8c) depict the corresponding degradation profiles.
Finally, the influence of three different environmental water samples on photocatalytic decomposition of esomeprazole over the ternary photocatalyst was monitored. All these water samples had negative impact on esomeprazole photocatalytic decomposition. Maximum photocatalytic activity was observed in mineral water with TOC less than 0.3 ppm. River water with TOC of 5.2 ppm showed better result than tap water with TOC of 3.4 ppm. Decomposition ability of the photocatalysts diminishes in these samples of environmental waters primarily due to attenuation of light through these media and the cumulative effect arising out of the presence of different mineral species and organic substances in them. Furthermore, lower photocatalytic activity in tap water than in river water could be due to the greater presence of minerals in the former than the latter. Table S9 shows the influence of various water samples on esomeprazole decomposition over In2O3/MoS2/Fe3O4. Figures (16d and S8d) depict the corresponding degradation profiles.
Conclusion
The present study is geared towards making an assessment of the photocatalytic activities of two novel ternary nanohybrids thus obtained vis-à-vis decomposition of aqueous esomeprazole and the interactive influences exerted by operating parameters, co-existing substances and environmental water samples. The target pollutant underwent ~ 92.92 ± 2.01% decomposition over In2O3/MoS2/Fe3O4 at a brisk pseudo-first order velocity constant of 0.06208 min−1 within 50 min. The introduction of an optimum dose of 7 µL/50 mL of H2O2 augmented photodegradation. Decomposition efficiency attained over In2O3/MoS2/Fe3O4 went up to 94.78 ± 2.08% at a velocity constant of 0.06980 min−1. Augmented production of ·OH radicals from H2O2 and by a Fenton like phenomenon could give rise to this intensification of photocatalytic decomposition. Inorganic anions being scavengers of ·OH radicals had pronounced negative impact on decomposition of esomeprazole by photocatalysis over In2O3/MoS2/Fe3O4. Of all the cations used, Al3+ ions exerted the highest retarding effect because of its adsorption at the active sites of the photocatalysts. In very low doses of acetone (0.001 M), the suppressing effect due to its predominant competitive decomposition was evident. But with rise in acetone concentration increased, photosensitization took over producing ·OH radicals that reinforced esomeprazole decomposition. Organic acids like oxalic acid, citric acid, tartaric acid and lactic acid markedly increased photodecomposition yield and pseudo-first order velocity constant. Both HAS and SDS induced marked fall in the photocatalytic decomposition efficiency. Environmental water samples negatively affected photocatalytic performance of the ternary photocatalyst chiefly due to the combined effect exerted by inorganic and organic moieties. The ternary photocatalyst of In2O3/MoS2/Fe3O4 could be further used in esomeprazole photo-decomposition up to five consecutive cycles of the photocatalysis experiment sans any significant downturn in their performances.
Supplementary Information
Acknowledgements
The authors deeply appreciate the Director, NIT Silchar and TEQIP for pecuniary assistance.
Author contributions
S. R. wrote the main manuscript text and figures. M. A. discussed results, commented, revised and corrected the whole manuscript.
Competing interests
The authors declare no competing interests.
Footnotes
Publisher's note
Springer Nature remains neutral with regard to jurisdictional claims in published maps and institutional affiliations.
Supplementary Information
The online version contains supplementary material available at 10.1038/s41598-021-85532-8.
References
- 1.Johnson TJ, Hedge DD. Esomeprazole: a clinical review. Am. J. Health-Syst. Ph. 2002;59(14):1333–1339. doi: 10.1093/ajhp/59.14.1333. [DOI] [PubMed] [Google Scholar]
- 2.Olbe L, Carlsson E, Lindberg P. A proton-pump inhibitor expedition: the case histories of omeprazole and esomeprazole. Nat. Rev. Drug Discov. 2003;2(2):132. doi: 10.1038/nrd1010. [DOI] [PubMed] [Google Scholar]
- 3.Kendall MJ. Esomeprazole—the first proton pump inhibitor to be developed as an isomer. Aliment. Pharmacol. Ther. 2003;17:1–4. doi: 10.1046/j.1365-2036.17.s1.1.x. [DOI] [PubMed] [Google Scholar]
- 4.Bahnemann DW, Hilgendorff M, Memming R. Charge carrier dynamics at TiO2 particles: reactivity of free and trapped holes. J. Phys. Chem. B. 1997;101(21):4265–4275. doi: 10.1021/jp9639915. [DOI] [Google Scholar]
- 5.Fujishima A, Zhang X, Tryk DA. TiO2 photocatalysis and related surface phenomena. Surf. Sci. Rep. 2008;63(12):515–582. doi: 10.1016/j.surfrep.2008.10.001. [DOI] [Google Scholar]
- 6.Wang H, Zhang L, Chen Z, Hu J, Li S, Wang Z, Liu J, Wang X. Semiconductor heterojunction photocatalysts: design, construction, and photocatalytic performances. Chem. Soc. Rev. 2014;43(15):5234–5244. doi: 10.1039/C4CS00126E. [DOI] [PubMed] [Google Scholar]
- 7.Fagan R, McCormack DE, Dionysiou DD, Pillai SC. A review of solar and visible light active TiO2 photocatalysis for treating bacteria, cyanotoxins and contaminants of emerging concern. Mater. Sci. Semicond. Process. 2016;42:2–14. doi: 10.1016/j.mssp.2015.07.052. [DOI] [Google Scholar]
- 8.Al-Hamdi AM, Rinner U, Sillanpää M. Tin dioxide as a photocatalyst for water treatment: a review. Process Saf. Environ. 2017;107:190–205. doi: 10.1016/j.psep.2017.01.022. [DOI] [Google Scholar]
- 9.Colón‐Ibáñez, G., Belver‐Coldeira, C., & Fernández‐García, M. (2007). Nanostructured Oxides in Photo‐Catalysis. Synthesis, Properties, and Applications of Oxide Nanomaterials, 491–562.
- 10.Pan JH, Dou H, Xiong Z, Xu C, Ma J, Zhao XS. Porous photocatalysts for advanced water purifications. J. Mater. Chem. 2010;20(22):4512–4528. doi: 10.1039/b925523k. [DOI] [Google Scholar]
- 11.Chen LY, Zhang WD. In2O3/g-C3N4 composite photocatalysts with enhanced visible light driven activity. Appl. Surf. Sci. 2014;301:428–435. doi: 10.1016/j.apsusc.2014.02.093. [DOI] [Google Scholar]
- 12.Chen B, Meng Y, Sha J, Zhong C, Hu W, Zhao N. Preparation of MoS2/TiO2 based nanocomposites for photocatalysis and rechargeable batteries: progress, challenges, and perspective. Nanoscale. 2018;10(1):34–68. doi: 10.1039/C7NR07366F. [DOI] [PubMed] [Google Scholar]
- 13.Shao N, Wang J, Wang D, Corvini P. Preparation of three-dimensional Ag3PO4/TiO2@MoS2 for enhanced visible-light photocatalytic activity and anti-photocorrosion. Appl. Catal. B. 2017;203:964–978. doi: 10.1016/j.apcatb.2016.11.008. [DOI] [Google Scholar]
- 14.Ke J, Liu J, Sun H, Zhang H, Duan X, Liang P, Li X, Tade MO, Liu S, Wang S. Facile assembly of Bi2O3/Bi2S3/MoS2 np heterojunction with layered n-Bi2O3 and p-MoS2 for enhanced photocatalytic water oxidation and pollutant decomposition. Appl. Catal. B. 2017;200:47–55. doi: 10.1016/j.apcatb.2016.06.071. [DOI] [Google Scholar]
- 15.Akbarzadeh A, Samiei M, Davaran S. Magnetic nanoparticles: preparation, physical properties, and applications in biomedicine. Nanoscale Res. Lett. 2012;7(1):144. doi: 10.1186/1556-276X-7-144. [DOI] [PMC free article] [PubMed] [Google Scholar]
- 16.Wang N, Zhu L, Wang M, Wang D, Tang H. Sono-enhanced decomposition of dye pollutants with the use of H2O2 activated by Fe3O4 magnetic nanoparticles as peroxidase mimetic. Ultrason. Sonochem. 2010;17(1):78–83. doi: 10.1016/j.ultsonch.2009.06.014. [DOI] [PubMed] [Google Scholar]
- 17.Hayat T, Imtiaz M, Alsaedi A, Alzahrani F. Effects of homogeneous–heterogeneous reactions in flow of magnetite-Fe3O4 nanoparticles by a rotating disk. J. Mol. Liq. 2016;216:845–855. doi: 10.1016/j.molliq.2016.01.089. [DOI] [Google Scholar]
- 18.Vestal CR, Zhang ZJ. Synthesis and magnetic characterization of Mn and Co spinel ferrite-silica nanoparticles with tunable magnetic core. Nano Lett. 2003;3(12):1739–1743. doi: 10.1021/nl034816k. [DOI] [Google Scholar]
- 19.Ham MH, Lee JW, Moon KJ, Choi JH, Myoung JM. Single-crystalline ferromagnetic Mn4Si7 nanowires. J. Phys. Chem. C. 2009;113(19):8143–8146. doi: 10.1021/jp901630f. [DOI] [Google Scholar]
- 20.Feng C, Faheem MB, Fu J, Xiao Y, Li C, Li Y. Fe-based electrocatalysts for oxygen evolution reaction: progress and perspectives. ACS Catal. 2020;10(7):4019–4047. doi: 10.1021/acscatal.9b05445. [DOI] [Google Scholar]
- 21.Mu J, Chen B, Zhang M, Guo Z, Zhang P, Zhang Z, Sun Y, Shao C, Liu Y. Enhancement of the visible-light photocatalytic activity of In2O3–TiO2 nanofiber heteroarchitectures. ACS Appl. Mater. Interfaces. 2012;4(1):424–430. doi: 10.1021/am201499r. [DOI] [PubMed] [Google Scholar]
- 22.Liu H, He X, Hu Y, Liu X, Jia H, Xu B. One-step hydrothermal synthesis of In2O3–ZnO heterostructural composites and their enhanced visible-light photocatalytic activity. Mater. Lett. 2014;131:104–107. doi: 10.1016/j.matlet.2014.05.182. [DOI] [Google Scholar]
- 23.Chhowalla M, Shin HS, Eda G, Li LJ, Loh KP, Zhang H. The chemistry of two-dimensional layered transition metal dichalcogenide nanosheets. Nat. Chem. 2013;5(4):263. doi: 10.1038/nchem.1589. [DOI] [PubMed] [Google Scholar]
- 24.Li H, Wu J, Yin Z, Zhang H. Preparation and applications of mechanically exfoliated single-layer and multilayer MoS2 and WSe2 nanosheets. Acc. Chem. Res. 2014;47(4):1067–1075. doi: 10.1021/ar4002312. [DOI] [PubMed] [Google Scholar]
- 25.Sun S, Sun M, Kong Y, Fang Y, Yao Y. MoS2 and graphene as dual, cocatalysts for enhanced visible light photocatalytic activity of Fe2O3. J. Sol-Gel. Sci. Technol. 2016;80(3):719–727. doi: 10.1007/s10971-016-4165-2. [DOI] [Google Scholar]
- 26.Zhou Y, Gao C, Guo Y. UV assisted ultrasensitive trace NO2 gas sensing based on few-layer MoS2 nanosheet-ZnO nanowire heterojunctions at room temperature. J. Mater. Chem. A. 2018;6(22):10286–10296. doi: 10.1039/C8TA02679C. [DOI] [Google Scholar]
- 27.Huang B, Zhang Z, Zhao C, Cairang L, Bai J, Zhang Y, Mu X, Du J, Wang H, Pan X, Zhou J. Enhanced gas-sensing performance of ZnO@ In2O3 core@ shell nanofibers prepared by coaxial electrospinning. Sens. Actuators B Chem. 2018;255:2248–2257. doi: 10.1016/j.snb.2017.09.022. [DOI] [Google Scholar]
- 28.Cîrcu M, Nan A, Borodi G, Liebscher J, Turcu R. Refinement of magnetite nanoparticles by coating with organic stabilizers. Nanomaterials. 2016;6(12):228. doi: 10.3390/nano6120228. [DOI] [PMC free article] [PubMed] [Google Scholar]
- 29.Poulin S, Franca R, Moreau-Bélanger L, Sacher E. Confirmation of X-ray photoelectron spectroscopy peak attributions of nanoparticulate iron oxides, using symmetric peak component line shapes. J. Phys. Chem. 2010;114(24):10711–10718. [Google Scholar]
- 30.Stefan M, Leostean C, Pana O, Toloman D, Popa A, Perhaita I, Senilă M, Marincas O, Barbu-Tudoran L. Magnetic recoverable Fe3O4-TiO2: Eu composite nanoparticles with enhanced photocatalytic activity. Appl. Surf. Sci. 2016;390:248–259. doi: 10.1016/j.apsusc.2016.08.084. [DOI] [Google Scholar]
- 31.Biesinger MC, Payne BP, Grosvenor AP, Lau LW, Gerson AR, Smart RSC. Resolving surface chemical states in XPS analysis of first row transition metals, oxides and hydroxides: Cr, Mn, Fe, Co and Ni. Appl. Surf. Sci. 2011;257(7):2717–2730. doi: 10.1016/j.apsusc.2010.10.051. [DOI] [Google Scholar]
- 32.Kondekar NP, Boebinger MG, Woods EV, McDowell MT. In situ XPS investigation of transformations at crystallographically oriented MoS2 interfaces. ACS Appl. Mater. Interfaces. 2017;9(37):32394–32404. doi: 10.1021/acsami.7b10230. [DOI] [PubMed] [Google Scholar]
- 33.Syari’atiKumarZahidEl YuminYeRudolf ASAAAJP. Photoemission spectroscopy study of structural defects in molybdenum disulfide (MoS2) grown by chemical vapor deposition (CVD) Chem. Commun. 2019;55(70):10384–10387. doi: 10.1039/C9CC01577A. [DOI] [PubMed] [Google Scholar]
- 34.Tang JY, Guo RT, Zhou WG, Huang CY, Pan WG. Ball-flower like NiO/g-C3N4 heterojunction for efficient visible light photocatalytic CO2 reduction. Appl. Catal. B. 2018;237:802–810. doi: 10.1016/j.apcatb.2018.06.042. [DOI] [PubMed] [Google Scholar]
- 35.Li Z, Zhang P, Shao T, Wang J, Jin L, Li X. Different nanostructured In2O3 for photocatalytic decomposition of perfluorooctanoic acid (PFOA) J. Hazard. Mater. 2013;260:40–46. doi: 10.1016/j.jhazmat.2013.04.042. [DOI] [PubMed] [Google Scholar]
- 36.Gan ZX, Liu LZ, Wu HY, Hao YL, Shan Y, Wu XL, Chu PK. Quantum confinement effects across two-dimensional planes in MoS2 quantum dots. Appl. Phys. Lett. 2015;106(23):233113. doi: 10.1063/1.4922551. [DOI] [Google Scholar]
- 37.Van Der Zande AM, Huang PY, Chenet DA, Berkelbach TC, You Y, Lee GH, Heinz TF, Reichman DR, Muller DA, Hone JC. Grains and grain boundaries in highly crystalline monolayer molybdenum disulphide. Nat. Mater. 2013;12(6):554–561. doi: 10.1038/nmat3633. [DOI] [PubMed] [Google Scholar]
- 38.Manoharan C, Jothibas M, Jeyakumar SJ, Dhanapandian S. Structural, optical and electrical properties of Zr-doped In2O3 thin films. Spectrochim. Acta A. 2015;145:47–53. doi: 10.1016/j.saa.2015.02.099. [DOI] [PubMed] [Google Scholar]
- 39.Splendiani A, Sun L, Zhang Y, Li T, Kim J, Chim CY, Galli G, Wang F. Emerging photoluminescence in monolayer MoS2. Nano Lett. 2010;10(4):1271–1275. doi: 10.1021/nl903868w. [DOI] [PubMed] [Google Scholar]
- 40.Mak KF, Lee C, Hone J, Shan J, Heinz TF. Atomically thin MoS2: a new direct-gap semiconductor. Phys. Rev. Lett. 2010;105(13):136805. doi: 10.1103/PhysRevLett.105.136805. [DOI] [PubMed] [Google Scholar]
- 41.Dhakal KP, Duong DL, Lee J, Nam H, Kim M, Kan M, Lee YH, Kim J. Confocal absorption spectral imaging of MoS2: optical transitions depending on the atomic thickness of intrinsic and chemically doped MoS2. Nanoscale. 2014;6(21):13028–13035. doi: 10.1039/C4NR03703K. [DOI] [PubMed] [Google Scholar]
- 42.Yang, S. H., Nguyen, T. P., & Hsu, C. S. (2007). Fabrication of MEH-PPV/SiO2 and MEH-PPV/TiO2 nanocomposites with enhanced luminescent stabilities.
- 43.Shan G, Zhong M, Wang S, Li Y, Liu Y. The synthesis and optical properties of the heterostructured ZnO/Au nanocomposites. J. Colloid Interface Sci. 2008;326(2):392–395. doi: 10.1016/j.jcis.2008.06.027. [DOI] [PubMed] [Google Scholar]
- 44.Wang Y, Zhang S, Wu X. Synthesis and optical properties of mesostructured titania–surfactant inorganic–organic nanocomposites. Nanotechnology. 2004;15(9):1162. doi: 10.1088/0957-4484/15/9/009. [DOI] [Google Scholar]
- 45.Yang R, Schulman SG, Zavala PJ. Acid–base chemistry of omeprazole in aqueous solutions. Anal. Chim. Acta. 2003;481(1):155–164. doi: 10.1016/S0003-2670(03)00076-X. [DOI] [Google Scholar]
- 46.Chen Y, Liu L, Su J, Liang J, Wu B, Zuo J, Zuo Y. Role of humic substances in the photodecomposition of naproxen under simulated sunlight. Chemosphere. 2017;187:261–267. doi: 10.1016/j.chemosphere.2017.08.110. [DOI] [PubMed] [Google Scholar]
- 47.Domingues FS, Freitas TKFDS, de Almeida CA, de Souza RP, Ambrosio E, Palácio SM, Garcia JC. Hydrogen peroxide-assisted photocatalytic decomposition of textile wastewater using titanium dioxide and zinc oxide. Environ. Technol. 2019;40(10):1223–1232. doi: 10.1080/09593330.2017.1418913. [DOI] [PubMed] [Google Scholar]
- 48.Wolski L, Walkowiak A, Ziolek M. Formation of reactive oxygen species upon interaction of Au/ZnO with H2O2 and their activity in methylene blue decomposition. Catal. Today. 2019;333:54–62. doi: 10.1016/j.cattod.2018.04.004. [DOI] [Google Scholar]
- 49.Huy BT, Paeng DS, Thao CTB, Phuong NTK, Lee YI. ZnO-Bi2O3/graphitic carbon nitride photocatalytic system with H2O2-assisted enhanced decomposition of Indigo carmine under visible light. Arab. J. Chem. 2019;13(2):3790–3800. doi: 10.1016/j.arabjc.2019.01.003. [DOI] [Google Scholar]
- 50.Tian F, Zhu R, Song K, Ouyang F, Cao G. Synergistic photocatalytic decomposition of phenol using precious metal supported titanium dioxide with hydrogen peroxide. Environ. Eng. Sci. 2016;33(3):185–192. doi: 10.1089/ees.2014.0153. [DOI] [Google Scholar]
- 51.Luo W, Zhu L, Wang N, Tang H, Cao M, She Y. Efficient removal of organic pollutants with magnetic nanoscaled BiFeO3 as a reusable heterogeneous Fenton-like catalyst. Environ. Sci. Technol. 2010;44(5):1786–1791. doi: 10.1021/es903390g. [DOI] [PubMed] [Google Scholar]
- 52.Cao SW, Liu XF, Yuan YP, Zhang ZY, Liao YS, Fang J, Loo SCJ, Sum TC, Xue C. Solar-to-fuels conversion over In2O3/g-C3N4 hybrid photocatalysts. Appl. Catal. B. 2014;147:940–946. doi: 10.1016/j.apcatb.2013.10.029. [DOI] [Google Scholar]
- 53.Zhang Z, Huang L, Zhang J, Wang F, Xie Y, Shang X, Gu Y, Zhao H, Wang X. In situ constructing interfacial contact MoS2/ZnIn2S4 heterostructure for enhancing solar photocatalytic hydrogen evolution. Appl. Catal. B. 2018;233:112–119. doi: 10.1016/j.apcatb.2018.04.006. [DOI] [Google Scholar]
- 54.Kumar A, Kumar A, Sharma G, Ala'a H, Naushad M, Ghfar AA, Stadler FJ. Quaternary magnetic BiOCl/g-C3N4/Cu2O/Fe3O4 nano-junction for visible light and solar powered degradation of sulfamethoxazole from aqueous environment. Chem. Eng. J. 2018;334:462–478. doi: 10.1016/j.cej.2017.10.049. [DOI] [Google Scholar]
- 55.Shekofteh-Gohari M, Habibi-Yangjeh A, Abitorabi M, Rouhi A. Magnetically separable nanocomposites based on ZnO and their applications in photocatalytic processes: a review. Crit. Rev. Environ. Sci. Technol. 2018;48(10–12):806–857. doi: 10.1080/10643389.2018.1487227. [DOI] [Google Scholar]
- 56.Mousavi M, Habibi-Yangjeh A. Novel magnetically separable g-C3N4/Fe3O4/Ag3PO4/Co3O4 nanocomposites: visible-light-driven photocatalysts with highly enhanced activity. Adv. Powder Technol. 2017;28(6):1540–1553. doi: 10.1016/j.apt.2017.03.025. [DOI] [Google Scholar]
- 57.Xu L, Wang J. Fenton-like degradation of 2, 4-dichlorophenol using Fe3O4 magnetic nanoparticles. Appl. Catal. B. 2012;123:117–126. [Google Scholar]
- 58.Pan L, Shi W, Sen T, Wang L, Zhang J. Visible light-driven selective organic degradation by FeTiO3/persulfate system: the formation and effect of high valent Fe (IV) Appl. Catal. B. 2021;280:119414. doi: 10.1016/j.apcatb.2020.119414. [DOI] [Google Scholar]
- 59.Pham ALT, Lee C, Doyle FM, Sedlak DL. A silica-supported iron oxide catalyst capable of activating hydrogen peroxide at neutral pH values. Environ. Sci. Technol. 2009;43(23):8930–8935. doi: 10.1021/es902296k. [DOI] [PMC free article] [PubMed] [Google Scholar]
- 60.Yajun W, Kecheng LU, Changgen FENG. Influence of inorganic anions and organic additives on photocatalytic decomposition of methyl orange with supported polyoxometalates as photocatalyst. J. Rare Earths. 2013;31(4):360–365. doi: 10.1016/S1002-0721(12)60286-5. [DOI] [Google Scholar]
- 61.Wang C, Zhu L, Wei M, Chen P, Shan G. Photolytic reaction mechanism and impacts of coexisting substances on photodegradation of bisphenol A by Bi2WO6 in water. Water Res. 2012;46(3):845–853. doi: 10.1016/j.watres.2011.11.057. [DOI] [PubMed] [Google Scholar]
- 62.Yang C, Yu J, Li Q, Yu Y. Facile synthesis of monodisperse porous ZnO nanospheres for organic pollutant decomposition under simulated sunlight irradiation: The effect of operational parameters. Mater. Res. Bull. 2017;87:72–83. doi: 10.1016/j.materresbull.2016.11.024. [DOI] [Google Scholar]
- 63.Sun L, Chen D, Wan S, Yu Z, Li M. Role of small molecular weight organic acids with different chemical structures as electron donors in the photocatalytic degradation of ronidazole: synergistic performance and mechanism. Chem. Eng. J. 2017;326:1030–1039. doi: 10.1016/j.cej.2017.06.053. [DOI] [Google Scholar]
- 64.Rizal MY, Saleh R, Taufik A. Characterization and photocatalytic activity of Ag/Mn3O4/graphene composites under visible light irradiation for organic dyes degradation. J. Environ. Chem. Eng. 2020;8(3):103610. doi: 10.1016/j.jece.2019.103610. [DOI] [Google Scholar]
Associated Data
This section collects any data citations, data availability statements, or supplementary materials included in this article.