

Abstract
BACKGROUND AND PURPOSE: Chronic alcohol abuse may cause neuropsychological disorders and result in brain atrophy. The purpose of this study was to evaluate the metabolic, morphologic, and functional cerebral changes in the early stage of abstinence from chronic alcoholism.
METHODS: Seventeen alcohol-dependent patients underwent MR imaging and MR spectroscopy on days 1 through 3 and days 36 through 39 of abstinence. In addition, psychological performance measures testing intelligence, concentration, attention, and memory were applied. Neuropsychological data were correlated with spectroscopic and volumetric results by using a Pearson's product moment correlation. The same measurements were also performed in 12 healthy, age-matched control subjects. Peak integral values for N-acetylaspartate (NAA) and choline (Cho) were referred to the peak integral value of creatine (Cr) as the internal reference.
RESULTS: NAA/Cr was decreased in the patients in both the frontal lobes and cerebellum immediately after cessation of drinking (days 1 through 3). After 36 to 39 days of abstinence, NAA/Cr had significantly increased in the patients and corresponded to performance on psychological tests. The Cho/Cr ratio was decreased in the cerebellum during early abstinence but was recovered on days 36 through 39. The patients had enlarged CSF spaces 1 to 3 days after detoxification, which decreased during sobriety. The extent of brain atrophy did not correspond to performance on psychological performance tests.
CONCLUSION: Regression of brain atrophy and metabolic recovery occurs at an early stage after abstinence from chronic alcohol abuse. MR spectroscopy findings return to normal metabolic levels within weeks after detoxification. The recovery of NAA/Cr is associated with improved performance on neuropsychological tests.
Chronic alcoholism may result in brain atrophy and a variety of neuropsychological disorders (1). Reversibility of brain atrophy has been described in these patients when they abstain from alcohol (2). The structural basis for brain shrinkage in patients with chronic alcoholism and its reversibility in sobriety are poorly understood. Sprouting of dendrites and axons (2), glial hyperplasia (2), and rehydration of brain tissue (3) have been suggested as possible mechanisms. Proton MR spectroscopy allows a biochemical in vivo characterization of brain tissue. Recent MR spectroscopy studies have shown decreased levels of N-acetylaspartate (NAA) in alcohol-dependent subjects (4–6). As yet, it has not been clarified whether this NAA decrease reflects an irreversible neuronal loss or if it is potentially reversible. The purpose of this study was to sequentially analyze the metabolic and morphologic changes in alcohol-dependent patients undergoing detoxification and compare the findings with those in healthy control subjects and to correlate the results with clinical and neuropsychological findings.
Methods
Participants
After providing written informed consent, 21 inpatients (14 men and seven women) consecutively admitted to an alcohol treatment unit were included in this study. Four patients were excluded because of noncompliance, leaving 17 patients (11 men and six women) in the study population. Inclusion criteria consisted of long-lasting primary alcohol dependence (at least 5 years) and satisfaction of at least five of eight International Statistical Classification of Diseases, 10th Revision (ICD-10) criteria for dependence. The disease was diagnosed by a trained interviewer using the Semi-Structured Assessment for the Genetics of Alcoholism (7). This assessment garnered demographic information, personal history of alcohol and/or drug abuse, and occurrence of major alcohol-related life problems. Alcohol consumption was calculated as the average number of drinks per day (one drink corresponds to 8 g of ethanol) during the 3 months before admission. All patients had to be between 21 and 60 years of age. Exclusion criteria were as follows: any concomitant psychiatric disorder other than nicotine dependence, an antisocial personality disorder, and organic liver failure. Characteristic patient data are delineated in the Table.
Characteristics of alcohol-dependent patients (n = 17)

After providing written informed consent, 12 control subjects (seven men and five women) who had been recruited via newspaper advertisement were enrolled in the study. These subjects ranged in age from 30 to 56 years, with a mean age of 43 (SD 7.9) years. Total abstinence was not required; however, they were carefully screened for any past or present alcohol-related problems, leading to exclusion. Additionally, alcohol-sensitive laboratory parameters (γ-glutamyltransferase, mean corpuscular volume, carbohydrate deficient transferrin) had to be within normal range and the CAGE questionnaire (8) had to be negative.
Patients and control subjects were studied at two time points, including measurements on days 1 through 3 and days 36 through 39 after detoxification (same interval for control subjects).
Psychological Performance Measures
Neuropsychological performance testing included the assessment of concentration, attention, memory, and intelligence. The following instruments were applied.
Standard Progressive Matrices (SPM)
The subject is asked to select from a group of six to eight choices of a design that best completes a matrix according to a given principle. The test reflects a person's nonverbal abstracting ability and is regarded as a measure of general intelligence and cognitive functioning (9).
Vocabulary Test (WST)
Since verbal ability is assumed to be relatively resistant to current neuropsychological disturbance, the WST (10) was used to estimate mental ability. The WST is a multiple-choice vocabulary test consisting of 42 items of increasing difficulty. Each item contains one authentic word and five fictitious ones. The number of correctly identified words is regarded as an indicator of verbal mental ability (10).
Concentration-Load Test (d2)
This is a paper-and-pencil test requiring heightened concentration for the quick detection of three subtly different target stimuli. The subject is asked to mark the targets as fast and with as few errors as possible. Apart from testing coordination, the test measures an individual's attention span and concentration ability (11). The total number of letters scanned minus the total number of mistakes were evaluated and standardized using the test manual norm table. Patients were assessed with the d2 test 10 days after admission.
Auditory-Verbal-Learning Test (AVLT)
This test requires a subject to learn a repeatedly presented list of 15 nouns and to recall as many as possible. The nouns are presented verbally and repeatedly. The number of items on the original list recalled immediately after presentation of an intrusion word list is regarded as an indicator of long-term memory (12).
All psychological tests were administered by the same psychologist. The SPM, WST, and AVLT were administered after at least 20 days of in-patient treatment. At this time, all patients were detoxified and without any symptoms of prolonged withdrawal. They were carefully controlled for abstinence and received no psychoactive medication.
Localized Proton MR Spectroscopy and MR Imaging
In alcohol-dependent patients, measurements were performed on days 1 through 3 (median day, 2) and days 36 through 39 (median day, 38) after abstinence from drinking. In the control group, the same protocol was applied twice, with an interval of 36 to 39 days (median, 37 days) in between. All measurements were done on a 1.5-T unit using a circularly polarized head coil. T2-weighted localizer images (TR/TE = 4000/110, slice thickness = 5 mm) throughout the whole brain were acquired in the axial, coronal, and sagittal planes. Additionally, a T1-weighted multiplanar reconstruction (MPR) sequence (TR/TE = 11.4/4.4, slice thickness = 1 mm, in-plane resolution = 0.98 × 0.98 mm) was obtained in the sagittal plane. Localized proton MR spectroscopy included single-voxel measurements in the frontal lobes (30 × 40 × 20 mm) and in the left cerebellar hemisphere (20 mm3). To achieve a reproducible position, the frontal voxel was placed with its inferior edge at the callosomarginal sulcus and its posterior edge at the central sulcus (Fig 1). The cerebellar voxel was placed with its medial edge in the left cerebellar hemisphere, adjacent to the fourth ventricle, and its superior edge adjacent to the tentorium (Fig 2). For every voxel position, a point-resolved spectroscopy (PRESS) sequence (1500/135, with 128 signals acquired) was applied with water suppression (chemical-shift selective, 128 acquisitions). Representative spectra are shown in Figures 1 and 2. Moreover, non–water-suppressed sequences (four acquisitions) with fixed receiver values (receiver gain, 100; receiver amplitude, 0) were applied in the same voxel positions. Typically, resonance linewidths were on the order of 5 Hz. For the assessment of signal-to-noise ratios of the spectra, the postprocessing software VAPRO was used to calculate the SDs of the metabolites from the residual after fit. The SDs were below 5% for all metabolites.
fig 1.

Position and representative spectrum of the frontal voxel of a 35-year-old man 2 days after abstinence from 7 years of alcohol abuse. The voxel was placed with its inferior edge at the callosomarginal gyrus and its posterior edge at the central sulcus
fig 2.
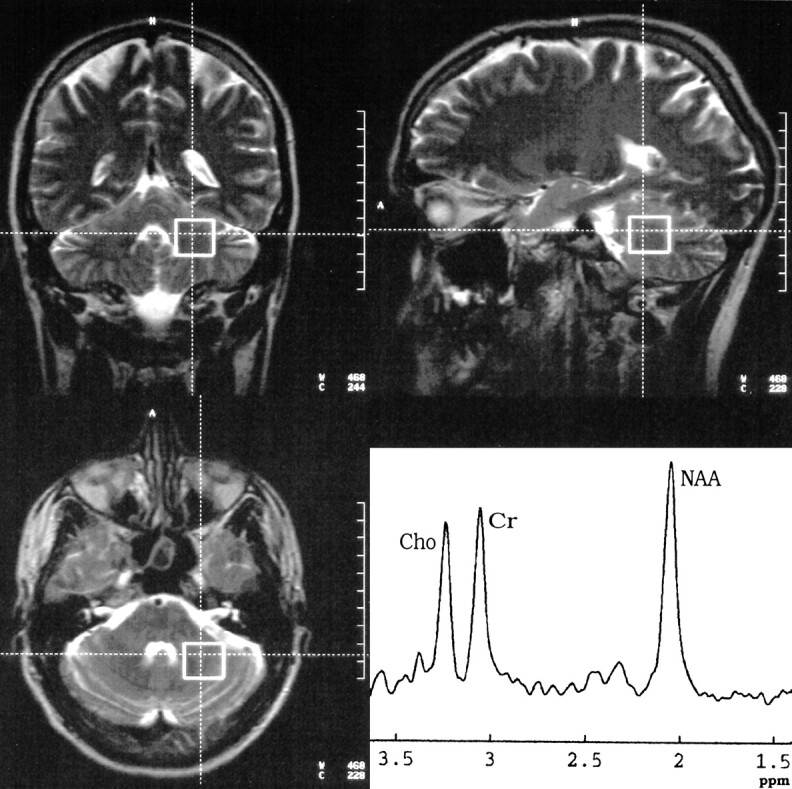
Position and representative spectrum of the cerebellar voxel of the same patient in figure 1 on the same day. The voxel was placed with its medial edge in the left cerebellar hemisphere and its upper dorsal corner at the tentorium
Image Segmentation
For volumetric MR analysis, the 3D-MPR sequence was transferred to a workstation (Silicon Graphics, Mountain View, CA) and images were segmented into external and internal CSF space and brain parenchyma for every section by using the semiautomatic threshold algorithm of a postprocessing software (Virtuoso, Siemens, Erlangen, Germany). Identical thresholds were chosen for all patients. After image segmentation, a 3D model of the internal and external CSF spaces was calculated.
Spectral Postprocessing
Spectral postprocessing was performed using MRUI (v.99.1b) and included 4k zero-filling, gaussian apodization, Fourier transformation, water-reference processing, frequency shift correction, and phase and baseline correction. For the water-suppressed sequences, peak integral values were determined by a fit curve algorithm at 3.0 ppm for creatine (Cr), 3.2 ppm for choline-containing compounds (Cho), and 2.0 ppm for NAA. For the non–water-suppressed PRESS sequences, the peak integral for the water peak at 4.7 ppm was determined. All data postprocessing was performed blinded to the patient data.
Statistical Analysis
Statistical analysis used SPSS version 9.0. A paired Student's t test was applied for the intraindividual comparison between the first and second examinations. A non-paired Student's t test was chosen for comparison between patients and control subjects. To correlate neuropsychological, clinical, and MR data, Pearson's product moment correlation was applied.
Results
MR Spectroscopy
MR spectroscopy data for the frontal and cerebellar voxels are shown in Figures 3 and 4. In comparison with the control group, MR spectroscopy revealed significantly decreased levels of NAA/Cr in the patients upon the beginning of detoxification, both in the frontal lobe (1.57 [SD, 0.13] vs. 1.89 [0.11], P < .001) and in the cerebellum (1.25 [0.14] vs. 1.51 [0.07], P < .001). However, at the second examination, NAA/Cr had increased significantly both in the frontal lobe (from 1.57 [0.13] to 1.81 [0.16], P < .005) and in the cerebellum (from 1.25 [0.14] to 1.5 [0.16], P < .001) of the patients. At this time, there were no significant differences between the patients and control subjects. Compared with the control group, the Cho/Cr ratio was significantly decreased in the cerebellum of the patients on days 1 through 3 after abstinence (0.75 [0.2] vs. 0.91 [0.04], P < .05), whereas in the frontal lobes there was only a tendency toward lower Cho/Cr levels in the patients (0.71 [0.14] vs. 0.8 [0.06], P = .05). Thirty-six to 39 days later, Cho/Cr had increased in the cerebellum of the patients (from 0.75 [0.2] to 0.87 [0.2], P < .05). At this time, no significant differences in the Cho/Cr ratio were detected between patients and control subjects in the cerebellum or frontal lobes. In the control group there were no relevant spectroscopic changes between the first and second examinations (Figs 3 and 4). The peak integral value of the water signal in non–water-suppressed sequences did not show any relevant intraindividual differences between the first and second examination in the patients (883 [79] vs. 881 [97] for the cerebellum, and 948 [74] vs. 943 [81] for the frontal lobe; P > .10) or in control subjects (902 [75] vs. 916 [51] for the cerebellum, and 916 [73] vs. 927 [52] for the frontal lobe; P > .10).
fig 3.

Metabolite ratios for NAA/Cr and Cho/Cr in the frontal voxel on days 1 through 3 (1) and days 36 through 39 (2) after abstinence
MR Imaging
MR data are shown in Figure 5. At the first examination, both external (223 [39] vs. 159 [37] mL, P < .05) and internal (24.9 [4.1] vs. 16.7 [3.2], P < .01) CSF spaces were increased in the patients as compared with those in the control group. Thirty-six to 39 days later, enlargement of both the external (from 223 [39] to 191 [31] mL, P < .001) and internal (from 24.9 [4.1] to 21.6 [4.0] mL, P < .05) CSF spaces had decreased significantly. In the second examination, only the internal CSF spaces were enlarged in the patients as compared with the control group (21.6 [4.0] vs. 16.7 [3.1], P < .05) whereas the external CSF spaces no longer showed a significant difference (191 [31] vs. 162 [36] mL, P > .05).
fig 5.

Volume of the external and internal CSF spaces (mL) on days 1 through 3 (1) and days 36 through 39 (2) after abstinence
Clinical Data and MR Imaging/MR Spectroscopy
The quantity of drinking (number of alcoholic drinks per day during the last 3 months of drinking) correlated with overall CSF volume immediately after abstinence (rp = .57, P < .05). Moreover, the decrease of the CSF spaces during abstinence showed a negative correlation with the quantity of drinking (rp = −.53, P < .05), and the Cho/Cr ratio in the frontal lobe was negatively correlated with the amount of drinking (rp = −.51, P < .05). The duration of dependency had a highly significant negative correlation with the Cho/Cr increase during abstinence (rp = −.84, P < .001). The NAA/Cr regeneration in the cerebellum was negatively correlated with the age of the patient (rp = −.58, P < .05).
Psychological Performance and MR Imaging/MR Spectroscopy
The NAA/Cr values in the cerebellum were positively correlated with performance on the d2 test both on days 1 through 3 (rp = .58, P < .05) and on days 36 through 39 (rp = .54, P < .05). Moreover, the NAA/Cr increase in the frontal lobes between days 1 through 3 and days 36 through 39 was related to performance on the AVLT (rp = .62, P < .05).
Intelligence (WST and SPM measures) was not related to findings at MR spectroscopy or MR imaging. Psychological performance values were not correlated with volumetric data of the CSF.
Discussion
Chronic alcohol abuse is associated with brain atrophy, as demonstrated both neuroradiologically (13) and neuropathologically (14). This has mainly been attributed to a loss of cerebral white matter (15, 16). Neuronal loss due to chronic alcohol abuse has been the subject of debate. Several authors have shown a reduction of large pyramidal neurons in the superior frontal cortex, cingulate gyrus, and inferior temporal cortices (17, 18). Others have not been able to identify significant differences in the neuron count between patients with alcoholism and control subjects (15, 19), and have attributed the cerebral atrophy in these patients to a degeneration of dendrites and axons, which has been demonstrated in humans (20) and animals (21) after long-term alcohol abuse. If the nerve-cell bodies are preserved, regeneration of impaired neuronal connections is, at least in principle, possible. By contrast, regeneration is unlikely in case of lost neurons. MR spectroscopy allows a limited in vivo evaluation of cerebral metabolism. NAA is found exclusively in neuronal tissue (22) and is diminished in conditions associated with loss of neurons, such as cerebral infarction (23). However, NAA is also reduced in potentially intact neurons with an impaired function, such as in an acute multiple sclerosis plaque (23). In this case, a decrease of NAA/Cr may be reversible (24).
In the present study, we found a decrease of NAA/Cr both in the frontal lobe and in the cerebellum in the patients immediately after detoxification as compared with healthy control subjects. Within 5 weeks of abstinence, however, a significant increase in NAA/Cr occurred, indicating either an augmentation of neuronal tissue or reversibility of neuronal dysfunction. The extent of NAA increase in the supratentorial cortex was linked to performance on the AVLT. Moreover, performance on the d2 test, which apart from concentration is dependent on coordination, was related to the NAA/Cr ratios in the cerebellum, also indicating a relationship between biochemical and neuropsychological performance values.
A decrease of NAA/Cr, which has been attributed mainly to neuronal loss, has been described in patients with chronic alcoholism previously (4–6). In the present study, we have demonstrated a normalization of decreased NAA/Cr levels in patients with alcoholism who had abstained. In the only sequential MR spectroscopy study on alcoholic abstinence, Martin et al (25) reported increasing levels of Cho/NAA. They favored the idea of increasing Cho and stable NAA levels as an expression of gliosis or a partially reversible cholinergic deafferentation. In that study, however, the first examination was between days 1 and 41 after abstinence. Neuropsychological (26) and imaging (13) studies have shown that the most extensive functional and morphologic changes in the brain of these patients occur within the first weeks of abstinence. Thus, different intervals from abstinence may alter the spectroscopic results.
Like other investigators (5, 6), we found a decreased Cho/Cr ratio in the cerebellum in patients with chronic alcoholism, which has been attributed to an altered cerebral metabolism of lipids in membranes or myelin. We observed an increase of Cho/Cr in abstinent patients, which was negatively correlated with the duration of dependency, perhaps indicating a limited potential for membrane regeneration in patients with chronic alcoholism.
We did not observe relevant changes in the water signal on non–water-suppressed sequences in patients or control subjects, which opposes the hypothesis that the reversibility of brain atrophy in these patients is due to rehydration (3). The integral areas of metabolite peaks are directly proportional to the concentration of the nuclei; however, other variables, such as TE and relaxation time, also influence the relation between intensity of the signal and concentration of the nuclei (27). We are well aware that our approach of measuring the water integral area on non–water-suppressed images is limited from a methodological point of view. However, use of the same sequence parameters with identical receiver values may allow an intraindividual semiquantitative estimate of the intravoxel water content.
We did not perform measurements of the T1 and T2 relaxation times, so we cannot exclude the possibility that the observed metabolite changes were due to changes in relaxation time. However, measurements of the T1 and T2 relaxation times would have at least doubled the study time, which, especially in recently detoxified images, was impracticable.
Reversibility of brain shrinkage in patients with alcoholism has been documented in the early stages of abstinence (13). In the present study, there was also a significant reduction in the CSF volume within 5 weeks of abstinence. The degree of alcoholic brain damage (ie, quantity of drinking) was correlated with the extent of brain atrophy and the regression of brain atrophy. Neuropsychological and metabolic findings did not correlate with the extent of brain atrophy, which may indicate different patterns of alcoholic brain damage.
Conclusion
Our data indicate that in the early stage of abstinence from chronic alcoholism reversibility of brain atrophy occurs. Moreover, regeneration of depleted NAA/Cr levels is accompanied by improved performance on neuropsychological measures. The extent of regression of brain atrophy is associated with the quantity of drinking but not with changes in psychological performance values.
fig 4.

Metabolite ratios for NAA/Cr and Cho/Cr in the cerebellar voxel on days 1 through 3 (1) and days 36 through 39 (2) after abstinence
Acknowledgments
We thank Tanja Horn for help with the data analysis and Herbert Köstler for support in the analysis of the spectroscopy data.
Footnotes
Address reprint requests to Dr. Martin Bendszus, Josef-Schneider-Str. 11, D-97080 Würzburg, Germany.
References
- 1.Charness ME, Simon RP, Greenberg DA. Ethanol and the nervous system. N Engl J Med 1989;321:442-454 [DOI] [PubMed] [Google Scholar]
- 2.Carlen PL, Wotzmann G, Holgate RC, Wilkinson DA, Rankin JG. Reversible brain atrophy in recently abstinent alcoholics measured by computed tomography scans. Science 1978;200:1076-1078 [DOI] [PubMed] [Google Scholar]
- 3.Besson JAO, Glenn AIM, Foreman EL, et al. Nuclear magnetic resonance disorders in alcoholic disorder and the role of vasopressin. Lancet 1981;2:923-924 [PubMed] [Google Scholar]
- 4.Fein G, Meyerhoff DJ, Di Sclafani V, et al. 1H magnetic resonance spectroscopic imaging separates neuronal from glial changes in alcohol-related brain atrophy. In: Alcohol and Glial Cells, Research Monograph 27. Bethesda, MD: National Institutes of Health; 1994:227–241
- 5.Jagannathan NR, Desai NG, Raghunathan P. Brain metabolite changes in alcoholism: an in vivo proton magnetic resonance spectroscopy (MRS) study. Magn Reson Imaging 1996;14:553-557 [DOI] [PubMed] [Google Scholar]
- 6.Seitz D, Widmann U, Seeger U, et al. Localized proton magnetic resonance spectroscopy of the cerebellum in detoxifying alcoholics. Alcohol Clin Exp Res 1999;23:158-163 [PubMed] [Google Scholar]
- 7.Buchholz KK, Cadoret R, Cloninger DR, et al. A new, semistructured psychiatric interview for use in genetic linkage studies: a report on the reliability of the SSAGA. J Stud Alcohol 1994;55:149-158 [DOI] [PubMed] [Google Scholar]
- 8.Ewing JA. Detection of alcoholism: the CAGE questionnaire. JAMA 1984;252:1905-1907 [DOI] [PubMed] [Google Scholar]
- 9.Raven JC. Standard Progressive Matrices. London: Lewis; 1938
- 10.Schmidt KH, Metzler P. Wortschatztest. Weinheim: Beltz; 1992
- 11.Brickenkamp R. Der d2 Aufmerksamkeits-Belastungstest. Göttingen: Hofgrefe; 1994
- 12.Heubrock D. The auditory-verbal-learning test (AVLT) in clinical and experimental psychology: administration, evaluation, and research findings. Z Differen Diagn Psychol 1992;13:161-174 [Google Scholar]
- 13.Zipurski RB, Lim KO, Pfefferbaum A. MRI study of brain changes with short-term abstinence from alcohol. Alcohol Clin Exp Res 1989;13:664-666 [DOI] [PubMed] [Google Scholar]
- 14.Harper CG, Kril JJ, Holloway RL. Brain shrinkage in chronic alcoholics. Br Med J 1985;290:501-504 [DOI] [PMC free article] [PubMed] [Google Scholar]
- 15.Jensen GB, Pakkenberg B. Do alcoholics throw neurons away? Lancet 1993;342:1201-1204 [DOI] [PubMed] [Google Scholar]
- 16.De la Monte SM. Disproportionate atrophy of cerebral white matter in chronic alcoholics. Arch Neurol 1988;45:990-992 [DOI] [PubMed] [Google Scholar]
- 17.Harper C, Kril J, Daly J. Are we drinking our neurons away? BMJ 1987;294:534-536 [DOI] [PMC free article] [PubMed] [Google Scholar]
- 18.Kril JJ, Halliday GM, Svoboda MD, Cartwright H. The cerebral cortex is damaged in chronic alcoholics. Neuroscience 1997;79:983-998 [DOI] [PubMed] [Google Scholar]
- 19.Harding AJ, Wong A, Svoboda M, Kril JJ, Haliday GM. Chronic alcohol consumption does not cause hippocampal neuron loss in humans. Hippocampus 1997;7:78-87 [DOI] [PubMed] [Google Scholar]
- 20.Ferrer I, Fabregues I, Rairiz J, Galofre E. Decreased numbers of dendritic spines on cortical pyramidal neurons in human chronic alcoholism. Neurosci Lett 1986;69:115-119 [DOI] [PubMed] [Google Scholar]
- 21.McMullen PA, Saint-Cyr JA, Carlen PL. Morphological alterations in rat CA1 hippocampal pyramidal cell dendrites resulting from chronic alcohol consumption and withdrawal. J Comp Neurol 1984;225:111-118 [DOI] [PubMed] [Google Scholar]
- 22.Miller BL. A review on chemical issues in proton NMR spectroscopy: N-acetyl-aspartate, choline and creatine. NMR Biomed 1991;4:47-52 [DOI] [PubMed] [Google Scholar]
- 23.Dujn JH, Matson GB, Maudsley AM, Hugg HW, Weiner MW. Proton magnetic resonance spectroscopy in human cerebral infarction. Radiology 1992;183:711-718 [DOI] [PubMed] [Google Scholar]
- 24.Arnold DL, Matthews DM, Francis G, Antel J. Proton magnetic resonance spectroscopy of human brain in vivo in the evaluation of multiple sclerosis: assessment of the load of disease. Magn Reson Med 1990;14:154-159 [DOI] [PubMed] [Google Scholar]
- 25.Martin PR, Gibbs SJ, Nimmerrichter AA, Ridle WR, Welch LW, Willcott MR. Brain proton magnetic resonance spectroscopy studies in recently abstinent alcoholics. Alcohol Clin Exp Res 1995;19:1078-1082 [DOI] [PubMed] [Google Scholar]
- 26.Bauer LO. Motoric signs of CNS dysfunction associated with alcohol and cocaine withdrawal. Psychol Res 1993;47:69-77 [DOI] [PubMed] [Google Scholar]
- 27.Kauppinin RA, Williams SR. Nuclear magnetic resonance studies of the brain. Prog Neurobiol 1994;44:87-118 [DOI] [PubMed] [Google Scholar]