

Abstract
BACKGROUND AND PURPOSE: Administration of contrast material before proton MR spectroscopy may allow more accurate placement of the volume of interest, particularly in tumors; yet, some data have suggested that contrast material may alter the results of MR spectroscopy. To determine the validity of this contention, we performed pre- and postcontrast MR spectroscopy in patients with brain tumors and compared the results with those obtained from a phantom.
METHODS: Ten patients with astrocytomas were examined with single-volume MR spectroscopy before and after administration of contrast material. Voxel placement was identical for all studies. Peak area, peak height, and width at half maximum were measured for N-acetyl aspartate (NAA), creatine (Cr), and choline (Cho) in all studies. A phantom containing a 10-mmol concentration of NAA, Cr, and Cho was prepared in phosphate-buffered saline and mixed with contrast concentrations varying from 0.1 to 1.0 mmol. The phantom was studied by MR spectroscopy with the same parameters as used for the clinical studies.
RESULTS: No significant differences were found between the pre- and postcontrast MR spectroscopy studies for the three parameters measured. In phantom studies, there was a significant decline in the Cho peak area and height and an increase in the width at half maximum as the concentration of contrast material increased from 0.1 to 1.0 mmol. NAA and Cr peaks showed no significant changes in peak height or area.
CONCLUSION: Contrast material may be administered before clinical MR spectroscopy without affecting its interpretation.
Proton MR spectroscopy has gained more widespread use in clinical settings as commercial software has become more available and reimbursement more feasible. Some theoretical and experimental data have suggested that MR spectroscopy should be performed before contrast administration (1–4); however, because the need for MR spectroscopy may not be determined until after contrast material has been administered, and because abnormal enhancement may be useful in guiding volume of interest (VOI) localization, it would be useful in many cases to perform these studies after contrast administration.
The purpose of our study was to determine whether the administration of contrast material affects the results of MR spectroscopy in patients with brain tumors.
Methods
Patient Studies
Ten patients with astrocytomas (anaplastic, n = 4; glioblastoma multiforme, n = 6) had single-volume MR spectroscopy before and after intravenous administration of gadolinium-based contrast material at the standard dose of 0.1 mmol/kg. All MR spectroscopy examinations were performed on a 1.5-T clinical MR system using a standard receive-only head coil and were obtained before and 10 to 20 minutes after contrast administration. Single-volume spin-echo point-resolved spectroscopy (PRESS) was performed with parameters of 1600/270/128 (TR/TE/excitations) in all patients. VOIs (5–27 cm3, depending on the size of the lesion) were defined from noncontrast T1- and T2-weighted images and from previously obtained MR imaging studies. These volumes encompassed approximately 80% of each tumor. Contrast material was administered while the patient was in the MR unit, and the patient was instructed not to move. Contrast-enhanced studies were obtained with voxel placement in the exact position as the noncontrast studies and were manually reshimmed to obtain a half-maximum water linewidth of less than 6 Hz before data acquisition. Spectroscopic data were analyzed using the automated analysis software provided by the vendor. The peak area, peak height, and width at half maximum for N-acetyl aspartate (NAA), creatine (Cr), and choline (Cho) were compared for the pre- and postcontrast studies using a repeat-measure analysis of variance. Significance was assumed if P < .05
One of the authors was shown all the spectra in a blinded, random fashion and asked to examine each for the presence or absence of neoplasm. The results from the blinded reader were interpreted as representing a significant change if spectra obtained before contrast administration were interpreted as showing tumor while spectra obtained after contrast administration were interpreted as showing no evidence of tumor (or vice versa), and, in either case, prompting a change in the patient's management.
Phantom Studies
A phantom containing a 10-mmol concentration of NAA, Cr, and Cho was prepared in phosphate-buffered saline (pH = 7.4). For the studies testing the effect of concentration of contrast material, concentrations were varied from 0.1 to 1.0 mmol. These concentrations were chosen on the basis of an estimated maximum concentration of this contrast agent in human extracellular space of about 0.4 mmol, based on a dose of 0.1 mmol/kg and a volume of distribution of 0.266 L/kg (per package insert). The same standard receive-only head coil was used in this study and volumes of 8 cm3 were examined using a PRESS technique identical to that used in the patients. Peak area, intensity, and width at half maximum for NAA, Cr, and Cho were determined for each concentration of contrast material used. As in the patient studies, the water in the VOI was manually shimmed to less than 6 Hz. Each measurement was performed three times and the results averaged.
Results
Patient Studies
In the 10 patient studies, no significant changes were found between the pre- and postcontrast findings for the peak area and width at half maximum of the three metabolites when analyzed using the repeat measures analysis of variance (see Table and Figs 1-3). In two cases, we found an approximately 20% postcontrast decrease in the peak height of Cho (Fig 4). This level of change was judged not to affect the interpretation of the spectra. There was no change in the interpretation of any of the postcontrast studies when they were interpreted in a blinded, randomly presented fashion.
Table of peak height, peak area, and width at half maximum for NAA, Cho, and Cr peaks in 10 patients with high-grade brain astrocytomas
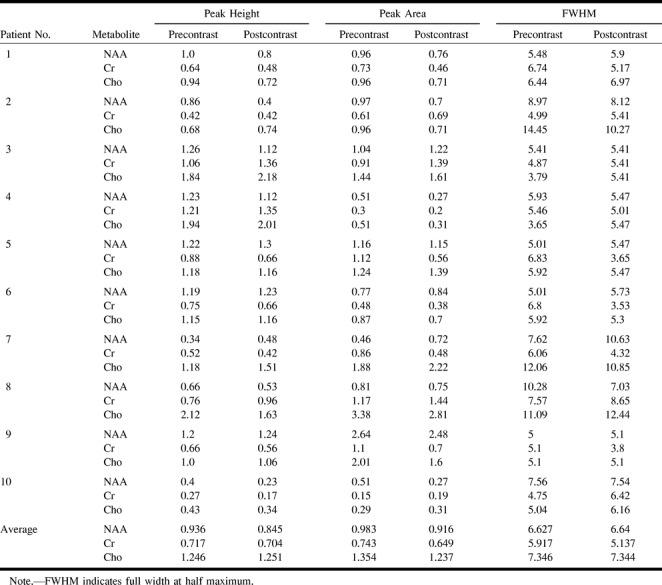
fig 1.

A–C, Graphs comparing peak height (A), peak area (B), and width at half maximum (C) for NAA, Cho, and Cr in 10 patients with high-grade brain astrocytomas. There are no significant differences in the studies obtained before and after contrast administration
fig 4.

Recurrent glioblastoma multiforme.
A, Axial contrast-enhanced T1-weighted image (560/15/1) shows placement of VOI containing mostly enhancing tumor.
B, Pre- (top panel) and postcontrast (bottom panel) MR spectroscopy studies show reduction of the Cho (1) resonance from 1.0 before to 0.7 after contrast administration. Despite this reduction, the Cho peak remains markedly elevated in relation to the NAA peak (2), indicating an increase in number and/or activity of tumor cells.
Phantom Studies
As the concentration of contrast material increased from 0.1 to 1.0 mmol, there was a significant decline in the peak area and peak height, and an increase in the width at half maximum for Cho (Fig 5A). NAA and Cr peaks showed no significant changes in peak height or peak area. Some peak broadening occurred with all metabolites (Fig 5B and C).
fig 5.

A–C, Graphs depicting the effect of variable concentrations of contrast material on peak height (A), peak area (B), and full width at half maximum (FWHM) (C) in a phantom containing a 10-mmol concentration of NAA, Cho, and Cr in phosphate-buffered saline. As the concentration of contrast material increases from 0.1 to 1.0 mmol, there is a significant decline in peak height and area for Cho. The NAA and Cr peaks show no significant alterations. Some peak broadening occurs for all the metabolites with increasing contrast material concentration. Vertical line indicates estimated extracellular space concentration of contrast material in an average patient, based on dose and volume of distribution.
Discussion
MR spectroscopy is being increasingly used for the evaluation of brain neoplasms. MR spectra of brain tumors show elevated levels of Cho and decreased levels of NAA relative to normal brain, reflecting increased cellularity (5, 6). Theoretical and experimental evidence suggests that spectroscopic data, or metabolic measurements, may be affected by contrast material (1–4). If this is true, then the presence of tumor or its degree of malignancy could be masked. Because in some cases the need for MR spectroscopy may not be determined until after contrast material has been administered, and because abnormal enhancement may be useful in guiding VOI localization, it would be useful to perform spectroscopy after contrast material has been administered. Our study was performed to determine whether contrast material affects interpretation of MR spectra in patients with primary brain tumors.
The T1 paramagnetic effects of contrast material are mediated through a dipole-dipole interaction between the protons of the metabolite and the unpaired electrons of the gadolinium (+3) ion. This interaction has a distance requirement and falls off as 1/r6 (r = radius) (5, 7). For a T1 shortening effect to occur, contrast material and the metabolite must, therefore, have a very close interaction. The gadolinium complex is a large molecule that does not freely pass through intact cell membranes. Thus, it is unlikely that the gadolinium complex could exert T1 shortening effects on the spectra of metabolites located inside intact cells.
These theoretical considerations are supported by the results of our study. A significant effect of contrast material was demonstrated on the metabolite spectra in the phantom containing a 10-mmol concentration of NAA, Cr, and Cho prepared in phosphate-buffered saline. In this solution, the gadolinium complex could attain proximity to metabolites and exert T1 shortening effects.
Gadolinium affects the spectral peak of the N-methyl groups of Cho (3.2 ppm) more so than the N-methyl group of Cr (3.0 ppm) or the N-acetyl methyl group of NAA (2.0 ppm) (Fig 5). This may be attributed to the electrostatic attractive or repulsive interactions of these compounds with the penta-acetic acid groups of the gadolinium complex. At pH 7.4, Cho has a fully positive charge associated with it, owing to the quaternary amino group, which should favor an interaction with the negatively charged gadolinium complex. NAA, on the other hand, has a net negative charge, owing to the two carboxyl groups, which are not protonated at pH = 7.4 and, thus, should be repulsed by the gadolinium complex and result in a lesser observed effect. The resonance at 3.0 ppm is due to the N-methyl group of Cr and Cr phosphate. At pH 7.4, Cr is zwitterionic (with regions of positive and negative charge in near balance), whereas Cr phosphate has an overall negative charge. Thus, the amount of interaction with the gadolinium complex depends on the relative amounts of Cr phosphate and Cr. Regardless, the level of interaction of these two compounds is less than that of Cho.
The studies performed in our patients showed no significant effect of contrast material on the spectra of metabolites. This result is not surprising, since the cell membranes of intact cells are expected to prevent proximity between extracellular gadolinium complex and intracellular metabolites.
Sijens and coworkers (1, 2) reported a 15% average decrease in the peak area of Cho-containing compounds after administration of contrast material. These investigators studied enhancing brain tumors with chemical-shift imaging (CSI) and obtained results similar to ours. CSI may be more sensitive than single-volume MR spectroscopy for detecting small changes in metabolite levels, since normal brain areas are included in the CSI volume to serve as a baseline for comparison. In two of our cases, we noted an approximately 20% postcontrast decrease in the peak height of Cho. Sijens and coworkers suggested that this decrease may be due to the effect of contrast material on an extracellular pool of Cho. In neither of our patients was the decrease in Cho levels sufficient to alter the interpretation of the MR spectroscopy study as reflecting a high-grade neoplasm.
Campeau et al (3) found more dramatic decreases in Cho levels by using a technique that rapidly measures sequential spectra immediately after a power injection of a 0.1 mmol/kg bolus of contrast material. These authors postulated that this finding may be due to magnetic susceptibility effects, which most likely are much greater in the first minute after bolus contrast injection. The spectra in our patients were obtained between 10 and 20 minutes after contrast administration, when the magnetic susceptibility effects would probably be significantly lower. In addition, we manually reshimmed the gradients immediately before obtaining the postcontrast spectra, which might further decrease any effect of magnetic field changes. Because of these effects, it is prudent to reshim the gradients and not to acquire clinical MR spectroscopy within the first minute after contrast administration. We used a PRESS sequence with a TE of 270. The stimulated-echo acquisition mode spectroscopy technique is likely to be affected more by contrast administration, because it is more sensitive to T2* effects, such as magnetic susceptibility artifacts (8).
Conclusion
Our study indicates that single-volume MR spectroscopy using long TEs may be performed after administration of contrast material in regions that show enhancement. The presence of contrast material did not alter the diagnostic quality of MR spectroscopy studies in our patients with high-grade astrocytomas. Our findings were supported by results obtained from our phantom study.
fig 2.

Recurrent glioblastoma multiforme.
A, Axial contrast-enhanced T1-weighted image (560/15/1) shows placement of VOI encompassing mostly enhancing tumor.
B, Pre- (top panel) and postcontrast (bottom panel) MR spectroscopy studies show no significant differences. There is significant elevation of Cho (1) and reduction of NAA (2) on both examinations.
fig 3.

Recurrent anaplastic astrocytoma.
A, Axial contrast-enhanced T1-weighted image (560/15/1) shows placement of VOI containing mostly enhancing tumor.
B, Pre- (top panel) and postcontrast (bottom panel) MR spectroscopy studies show no significant differences. The Cho level is high and the NAA level is low on both examinations.
Footnotes
Address reprint requests to J. Keith Smith, MD, PhD.
References
- 1.Sijens PE, Oudkerk M, van Dijk P, Levendag PC, Vecht CJ. 1H MR spectroscopy monitoring of changes in Cho peak area and line shape after Gd-contrast administration. Magn Reson Imaging 1998;16:1273-1280 [DOI] [PubMed] [Google Scholar]
- 2.Sijens PE, van den Bent MJ, Nowak PJ, van Dijk P, Oudkerk M. 1H chemical shift imaging reveals loss of brain tumor choline signal after administration of Gd-contrast. Magn Reson Med 1997;37:222-225 [DOI] [PubMed] [Google Scholar]
- 3.Campeau NG, Wood CP, Felmlee JP. Mechanism of Gd-DTPA effects on proton MR spectroscopy. In: Proceedings of the Joint Meeting of ASNR/ASHNR/ASPNR/ASITN/ASSR, May 1999. Oak Brook, IL: American Society of Neuroradiology 1999;72
- 4.Ricci PE, Schepkin V, Elster AD, Hamilton CA. Effects of three gadolinium chelates on cerebral metabolite levels measured by single-voxel proton MR spectroscopy. In: Proceedings of the Joint Meeting of ASNR/ASHNR/ASPNR/ASITN/ASSR, May 1999. Oak Brook IL: American Society of Neuroradiology 1999;71
- 5.Miller BL, Chang L, Booth R, et al. In vivo 1H MRS choline: correlation with in vitro chemistry/histology. Life Sci 1996;58:1929-1935 [DOI] [PubMed] [Google Scholar]
- 6.Usenius JP, Vainio P, Hernesniemi J, Kauppinen RA. Choline-containing compounds in human astrocytomas studied by 1H NMR spectroscopy in vivo and in vitro. J Neurochem 1994;63:1538-1543 [DOI] [PubMed] [Google Scholar]
- 7.Engelstad R, Wolf GL. Contrast agents in magnetic resonance imaging. In: Stark DD, Bradely WG, eds. Magnetic Resonance Imaging. St Louis: Mosby; 1988;164
- 8.Moonen CT, von Kienlin M, van Zijl PC, et al. Comparison of single-shot localization methods (STEAM and PRESS) for in vivo proton NMR spectroscopy. NMR Biomed 1989;2:201-207 [DOI] [PubMed] [Google Scholar]