Abstract
BACKGROUND AND PURPOSE: Functional connectivity MR (fcMR) imaging is used to map regions of brain with synchronous, regional, slow fluctuations in cerebral blood flow. We tested the hypothesis that focal cerebral lesions do not eradicate expected functional connectivity.
METHODS: Functional MR (fMR) and fcMR maps were acquired for 12 patients with focal cerebral tumors, cysts, arteriovenous malformations, or in one case, agenesis of the corpus callosum. Task activation secondary to text listening, finger tapping, and word generation was mapped by use of fMR imaging. Functional connectivity was measured by selecting “seed” voxels in brain regions showing activation (based on the fMR data) and cross correlating with every other voxel (based on data acquired while the subject performed no task). Concurrence of the fMR and fcMR maps was measured by comparing the location and number of voxels selected by both methods.
RESULTS: Technically adequate fMR and fcMR maps were obtained for all patients. In patients with focal lesions, the fMR and fcMR maps correlated closely. The fcMR map generated for the patient with agenesis of the corpus callosum failed to reveal functional connectivity between blood flow in the left and right sensorimotor cortices and in the frontal lobe language regions. Nonetheless, synchrony between blood flow in the auditory cortices was preserved. On average, there was 40% concurrence between all fMR and fcMR maps.
CONCLUSION: Patterns of functional connectivity remain intact in patients with focal cerebral lesions. Disruption of major neuronal networks, such as agenesis of the corpus callosum, may diminish the normal functional connectivity patterns. Therefore, functional connectivity in such patients cannot be fully demonstrated with fcMR imaging.
In healthy subjects, functional connectivity MR (fcMR) imaging provides a means of mapping auditory, sensorimotor, and other regions of eloquent cortex. fcMR imaging identifies these regions because of their synchronous fluctuations of blood flow when the brain is not performing a prescribed task (1, 2). In functionally related regions of brain, even those separated by substantial distances, regional cerebral blood flow fluctuates synchronously. The synchrony of the bloodflow fluctuations in functionally related brain regions implies the existence of neuronal connections that facilitate coordinated activity.
Whereas conventional functional MR (fMR) imaging acquires high-contrast echo-planar images used to map the location of increased blood flow when a stimulus is applied or a cognitive task is performed, fcMR echo-planar images are used to map the location of changing signal intensity in the brain when no stimulus is presented or task performed. Therefore, fMR localizes regions of increased blood flow as a result of a task or stimulus, whereas fcMR detects functionally connected brain regions that are fluctuating synchronously in baseline blood flow. During fcMR studies, the subject is instructed to refrain from any cognitive activity (the “resting” state). These fcMR studies use the periodic, slow fluctuations in signal intensity in the brain to measure the effective neural connections between different brain regions. Functional connectivity in auditory, motor, and language cortices in the brain has been demonstrated with fcMR studies (1, 3). fcMR imaging provides a means of mapping functional connectivity in the human brain noninvasively, safely, and economically.
Although the effectiveness of fcMR imaging has been confirmed in healthy volunteers, its study in patients has been limited. To our knowledge, no one has reported a change in functional connectivity caused by a cerebral lesion. The purpose of this study was to test the hypothesis that focal cerebral lesions do not eradicate the functional connectivity in adjacent brain regions. We prepared functional connectivity maps for auditory, sensorimotor, and language regions of the brain in a series of patients with focal and diffuse cerebral lesions. In each case, we compared one fcMR map with a task-activation map in the same subject.
Methods
Patients who were referred for fMR imaging, and who had cerebral tumors, cysts, or vascular malformations near eloquent cortices, were enrolled in the study. One patient with agenesis of the corpus callosum was also included to evaluate connectivity in the absence of large, white matter interhemispheral connections. Informed consent was obtained for all examinations. fMR imaging was performed in a 1.5-T commercial imager equipped with high-speed gradients. Preliminary anatomic images were obtained with multislice spin-echo sequences. fMR and fcMR images were acquired in the coronal, axial, or sagittal planes as prescribed by the radiologist supervising the clinical imaging study. Whole-brain images were acquired every other second for 270 seconds. Technical parameters for these images included 18 slices, 64 X 64 matrix, 90° flip angle, 2000/50 (TR/TE), 24-cm field of view, 7-mm slice thickness, and 2-mm gap. Each volunteer performed three tasks, intermittent finger tapping, passive text listening, and silent word generation, according to a standard on/off block-type paradigm with four 30-second epochs of task interspersed with five 30-second epochs of rest. For passive listening to text, a recorded narrative was played for the patient. For the finger-tapping task, the subject was instructed to tap each finger successively to the thumb on both hands when cued (4–8). For word generation, the patient was instructed to think of as many words as possible beginning with a specific letter when cued (by use of a recording). To obtain the fcMR maps, the subject was instructed to rest and perform no specific cognitive exercises. The fcMR test was performed prior to the fMR test.
Signal intensity for the fMR and fcMR images was plotted as a function of time for each voxel. For both the task and resting time-course data, a three-point Hanning filter was applied for temporal smoothing of the signal. Signal intensities in each slice were time-corrected by a shift of the smoothing filter corresponding to the temporal offset. A low-pass filter was applied in the frequency domain to remove respiratory and other noise frequencies greater than 0.1 Hz. A band-reject filter was not required for the small effect of aliasing of the cardiac frequency. A Hamming filter applied to the echo-planar raw data in the spatial frequency domain provided a first low-pass filter in order to increase the signal-to-noise ratio (9, 10).
The fMR time course was analyzed with a locally developed program. A least-squares fitting algorithm was used to compare the observed data, voxel by voxel, to a constant (baseline signal intensity), to a ramp (signal drift), and to a boxcar function (idealized expected response to the task or stimulus). The boxcar function, smoothed by convolution with a Poisson function with a 6-second mean, had a unit amplitude and period matching the on/off cycles of the task or stimulus. The amplitude and the uncertainty of the fit to the boxcar reference function were calculated. Student's t test was used to estimate the significance of the response to the task. Activation maps were created by setting a threshold t value. The t maps were merged with anatomic images and viewed with AFNI software (11).
Seed voxels were selected for the fcMR maps by referring to the activated regions for each task in the fMR results. The correlation coefficients of the selected seed voxels, and every other voxel in the resting dataset, were then calculated. The voxels with correlation coefficients greater than or equal to a threshold of 0.40 were mapped on the anatomic images.
The locations of the voxels in the fcMR maps were compared to the locations of task activation in the fMR maps. Concurrence between the fMR and fcMR results was measured by creating an intersect map for each task for each patient, showing only those voxels that passed the thresholds for both the fMR and fcMR methods. A computer program (using basic Boolean AND logic) was used to select the voxels present in both maps to produce the intersect map. A concurrence ratio was then calculated by dividing the number of concurrent voxels in the intersect map by the average of the number of voxels that passed the thresholds of the fMR and fcMR methods independently. This ratio was used as a relative measurement of agreement.
Results
Standard fMR task-activation maps of good technical quality were obtained for all patients. Activation was identified in the superior temporal lobe during text listening; in the sensorimotor cortices, supplementary motor areas, and dentate nucleus during finger tapping; and in the left inferior or middle frontal gyrus during word generation. A small number of voxels were identified in other regions in some subjects.
fcMR maps were also obtained for each patient based on seed voxels in the superior temporal gyrus, the sensorimotor cortex, or the left inferior or middle frontal gyrus. The map for each seed voxel had clusters of voxels in the same locations in which activation was seen in the task data. As in the fMR maps, the voxels passing the threshold in the fcMR maps were located predominantly in the superior temporal gyri bilaterally for a seed voxel in one auditory cortex; in the sensorimotor cortex bilaterally for a seed voxel in one sensorimotor cortex; and in the left middle and inferior frontal gyri for a seed voxel in the left inferior frontal or middle frontal gyrus.
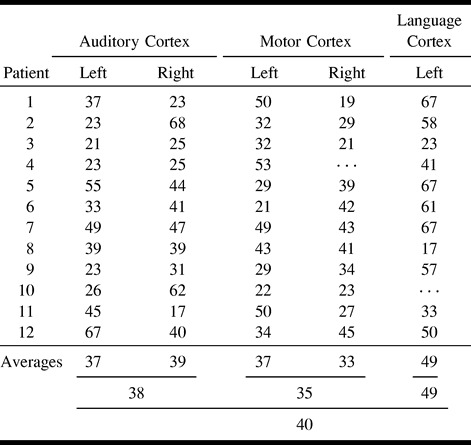
In the 11 patients with focal cerebral lesions, the fMR and fcMR maps were similar. The concurrence ratios, including averages, are listed in the Table. The average concurrence ratio for seed voxels chosen from the left and right auditory cortices was 37% and 39%, respectively, for a combined average concurrence for the auditory cortex of 38%. The average concurrence ratio for seed voxels chosen from the left and right sensorimotor cortices was 37% and 33%, respectively, for an average concurrence for the sensorimotor cortex of 35%. The average concurrence ratio for seed voxels selected from Broca's area (in the left hemisphere) was 49%. In Broca's area, functionally connected voxels were identified in some cases in the right middle and inferior frontal lobes, but these were not included in the tabulation because task-activated voxels were not identified in the right frontal lobe in all patients. Overall concurrence ratios for all fMR and fcMR maps averaged 40%, and ranged from 17% to 68%.
TABLE 1:
Percent concurrence for each patient for each task, including averages

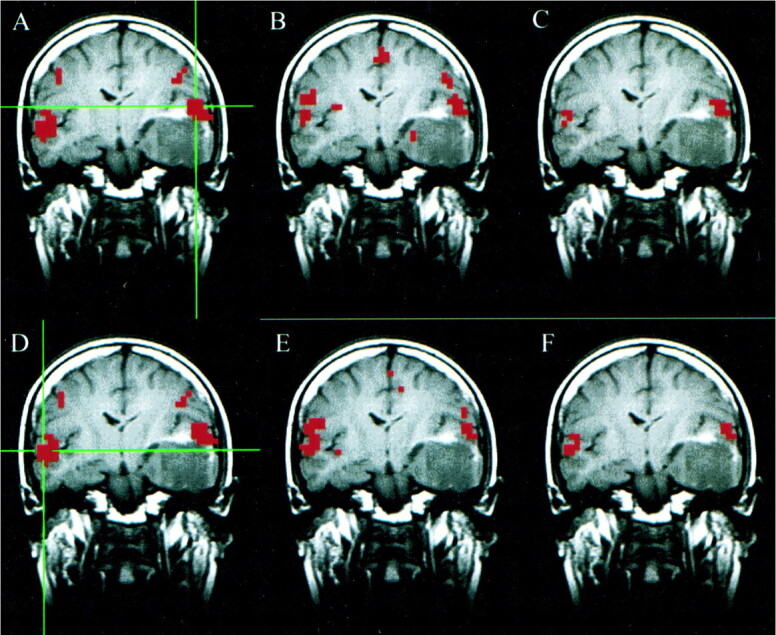
The results of the auditory task paradigm for a patient with a left temporal oligodendroglioma are shown in Figure 1. Significantly correlated voxels were found in the ipsilateral and contralateral auditory cortex regions for a seed voxel selected in the superior temporal gyrus in the resting acquisition. The fcMR map of voxels with synchronous fluctuations resembled the fMR map of activation secondary to the text-listening task. The concurrence ratio, reflecting the similarity between the fMR task-activation map and the fcMR map resulting from a seed voxel selected from the left hemisphere, was 33%, whereas the concurrence for the right seed voxel was 41%.
fig 1.

A–F, Coronal images in a patient with a left temporal oligodendroglioma. Student's t test, task-activation map for the auditory, text-listening paradigm (A and D) shows activation in the superior temporal gyri bilaterally. The functional connectivity map (B) based on a seed voxel in the left superior temporal gyrus (crosshairs in A) shows synchronous blood flow changes bilaterally in the superior temporal gyri. The intersect map (C) shows voxels that passed the thresholds in both the fMR (A) and fcMR (B) maps. It reflects a 33% concurrence ratio between the activation and connectivity analyses for this left hemisphere seed voxel. The functional connectivity map (E) based on a seed voxel in the right superior temporal gyrus (crosshairs in D) also shows synchronous blood flow changes bilaterally in the superior temporal gyri. The intersect map (F) reflects a 41% concurrence ratio between the activation map (D) and connectivity map (E) for this right hemisphere seed voxel
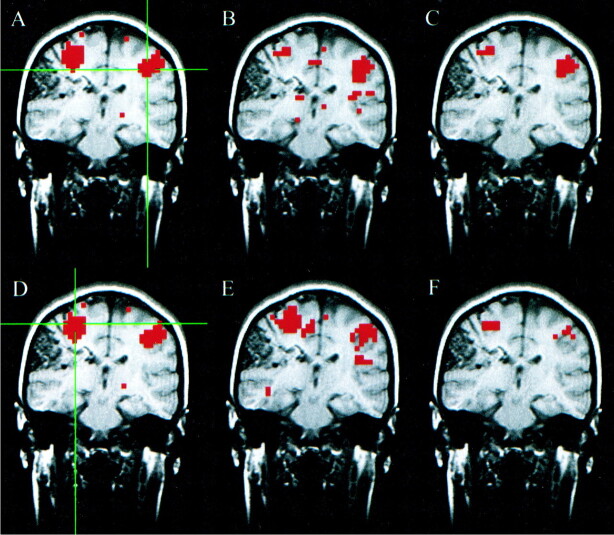
The results of the motor task paradigm for a patient with a right parasylvian arteriovenous malformation are shown in Figure 2. For a seed voxel selected in the sensorimotor cortex, significantly correlated voxels were present in the resting acquisition in the ipsilateral and contralateral sensorimotor cortex regions and in the supplementary motor area. The fcMR map resembled the task-activation map for bilateral finger tapping. Concurrence ratios for the selected left and right seed voxels were 49% and 43%, respectively.
fig 2.
A–F, Coronal images in a patient with a right parasylvian arteriovenous malformation. Student's t test, task-activation map for the motor, finger-tapping paradigm (A and D) shows activation in the sensorimotor cortices bilaterally. The functional connectivity maps (B and E) based on seed voxels chosen from the left and right sensorimotor cortices (crosshairs in A and D, respectively) show synchronous blood flow changes bilaterally in the sensorimotor cortices. The intersect maps (C and F) show the voxels common to both the task-activation and functional connectivity maps. They reflect a 49% and 43% concurrence ratio between the activation and connectivity analyses for these left and right hemisphere seed voxels, respectively.
The results of the language task paradigm for a patient with a left parietal cavernous angioma is shown in Figure 3. For a seed voxel in the left inferior frontal gyrus, correlated voxels were found in the ipsilateral inferior frontal lobe and middle frontal lobe. The region showing functional connectivity in the left inferior frontal lobe corresponded well to the region activated by word generation. The concurrence ratio for the seed voxel chosen from Broca's area in the left hemisphere was 51%. For this patient, because activation was seen bilaterally in the fMR map, a seed voxel was also selected from the right hemisphere to produce another fcMR map for the less dominant language area. In this instance, a 56% concurrence between the fMR and fcMR analyses was seen. Analysis of bilateral functional connectivity in language was not tabulated and reported in this study, however, because bilateral language activation was not seen in all patients.
fig 3.
A–F, Coronal images in a patient with a left parietal cavernous angioma (not seen in this slice). Student's t test, task-activation map for the language, word-generation paradigm (A and D) shows activation in the left inferior and middle frontal gyri, and to a lesser extent in the right middle and inferior frontal gyri. The functional connectivity map (B) based on a seed voxel in the left inferior frontal gyrus (crosshairs in A) shows a pattern of connectivity in the left and right frontal lobes. The intersect map (C) shows voxels in both hemispheres passing the threshold in both the fMR and fcMR maps. It reflects a 51% concurrence ratio between activation and connectivity analyses for this left hemisphere seed voxel. The fMR (D), fcMR (E), and intersect (F) maps are shown for a seed voxel in the right inferior frontal gyrus (crosshairs in D). For this right hemisphere seed voxel, there was a 56% concurrence between the activation and connectivity maps. These data were not included in our tabulation because bilateral activation for language was not seen in all patients.
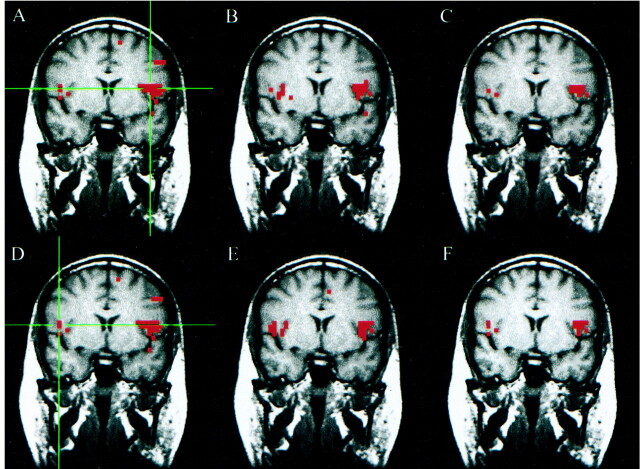
fcMR results for the patient with agenesis of the corpus callosum differed from those of the other patients. Significantly correlated voxels were found only in the ipsilateral sensorimotor cortex region for seed voxels selected in the right sensorimotor cortex (Figs 4A, B, and C). Concurrence ratios were 50% and 27% for seed voxels in the left and right sensorimotor cortices, respectively. Correlation between hemispheres for the motor task could be detected, but only at lower thresholds (and therefore lower statistical significance). As in the patients with focal lesions, voxels in both the ipsilateral and contralateral superior temporal gyri correlated at the chosen threshold for a seed voxel in the left primary auditory cortex (Figs 4D, E, and F). Concurrence ratios for seed voxels in the left and right auditory cortices were 45% and 17%, respectively. The concurrence ratio was 33% for the seed voxel in Broca's area. In this patient, only voxels in the ipsilateral sensorimotor cortex had correlation coefficients with the seed voxel exceeding the threshold.
fig 4.
A–F, Axial images in a patient with agenesis of the corpus callosum and midline cystic structures. Student's t test, task-activation map for the motor, finger-tapping paradigm (A) shows activation in the sensorimotor cortices bilaterally as well as in the supplemental motor area. The functional connectivity map (B) based on a seed voxel in the right sensorimotor cortex (crosshairs in A) shows synchronous blood flow changes in the ipsilateral sensorimotor cortex only. The intersect map (C) shows voxels that passed the thresholds in both the fMR (A) and fcMR (B) maps. It reflects a 27% concurrence ratio between the activation and connectivity analyses for this right hemisphere seed voxel. Student's t test, task-activation map for the auditory, text-listening paradigm (D) shows activation in the superior temporal gyri bilaterally. The functional connectivity map (E) based on a seed voxel in the left superior temporal gyrus (crosshairs in D) shows synchronous blood flow changes in both the ipsilateral and the contralateral superior temporal gyri. The intersect map (F) reflects a 45% concurrence ratio between the activation (D) and connectivity (E) maps for this left hemisphere seed voxel.
Discussion
This study shows that the effect of solitary focal lesions on functional connectivity is minimal. The patterns of functional connectivity in patients resemble those in healthy volunteers (3). Concurrence ratios averaged 40% and were comparable to those in control subjects (3). Lesions affecting the large distributed networks, such as agenesis of the corpus callosum, may decrease functional connectivity. Specifically, interhemispheral connectivity was reduced for the sensorimotor and language cortices, but not for the auditory cortices.
The patterns of functional connectivity identified in these patients have been reported previously in studies of healthy subjects. Functionally connected voxels in the ipsilateral and contralateral sensorimotor cortices and supplementary motor areas characterize healthy subjects (1, 10). The synchronous fluctuations in signal intensity in these regions theoretically reflect synchronous changes in blood flow, a feature of large distributed networks. Robust connectivity in language, visual, and auditory regions has also been reported (3). Functional connectivity also characterizes subcortical nuclei (12).
The pattern of functional connectivity in frontal lobe language regions has, to our knowledge, not been studied previously with fcMR imaging. Because our patient population had tumors in the left frontal lobe, we measured the functional connectivity in Broca's region. For a seed voxel in Broca's area, functionally connected voxels were found in the ipsilateral and, sometimes, contralateral middle and inferior frontal gyri. In most cases, the word-generation task predominantly activated the left frontal lobe, as reported previously (6). Because activation was present in most cases only in the left frontal lobe, the concurrence ratio was based on activation and connectivity in that lobe alone. The objective of language tasks in most clinical fMR applications is to determine the hemispheric dominance. Investigations of language dominance have therefore been based on tasks intended to activate the dominant left hemisphere. Nonetheless, some language tasks, such as rhyming, produce activation in the right hemisphere (13). Presumably, the right frontal lobe regions that are functionally connected to the seed voxel from Broca's area represent language regions. Further studies to correlate the functionally connected regions of the right frontal cortex and language activation are warranted.
Comparison of the functional connectivity in these patients with normal patterns by use of qualitative methods was beyond the scope of this preliminary study. The sample was too small to permit statistical analysis or to assess all types of focal or diffuse cerebral lesions. A major limitation was the variability in results depending on the seed voxel chosen. The optimal size of the seed voxel or seed cluster has not been determined. Automated methods of choosing the seed voxel would reduce the possibility of bias caused by voxel selection. Strategies for measuring functional connectivity that obviate the selection of the seed voxel would reduce the investigator's time and the possibility of selection bias. Thresholds were not optimized for maximizing the concurrence ratio. Therefore, additional studies are needed.
The significance of this study is that fcMR imaging is a useful tool for studying functional connectivity in patients with neurologic disorders. Whereas fMR imaging probes the function of regional cortical and subcortical structures, fcMR imaging may effectively probe the large distributed neuronal networks that characterize a healthy human brain. It may also be useful to detect abnormalities in the networks that hypothetically occur in various psychiatric and neurologic disorders, such as schizophrenia, autism, and dyslexia (14–16).
Footnotes
Address reprint requests to Michelle Quigley, Ph.D., Department of Medical Physics, University of Wisconsin, E3/311 Clinical Sciences Center, 600 Highland Avenue, Madison, WI 53792-3252.
References
- 1.Biswal B, Yetkin FZ, Haughton VM, Hyde JS. Functional connectivity in the motor cortex of resting human brain using echo-planar MRI. Magn Reson Med 1995;34:537-541 [DOI] [PubMed] [Google Scholar]
- 2.Fasano VA, Urciuoli R, Bolognese P, Mostert M. Intraoperative use of laser doppler in the study of cerebral microvascular circulation. Acta Neurochir (Wien) 1988;95:40-48 [DOI] [PubMed] [Google Scholar]
- 3.Cordes D, Haughton VM, Arfanakis K, et al. Mapping functionally related regions of brain with functional connectivity MR imaging. AJNR Am J Neuroradiol 2000;21:1636-1644 [PMC free article] [PubMed] [Google Scholar]
- 4.Morris III GL, Mueller WM, Yetkin FZ, et al. Functional magnetic resonance imaging in partial epilepsy. Epilepsia 1994;35:1194-1198 [DOI] [PubMed] [Google Scholar]
- 5.Mueller WM, Yetkin FZ, Hammeke TA, et al. Functional magnetic resonance mapping of the motor cortex in patients with cerebral tumors. Neurosurgery 1996;39:515-521 [DOI] [PubMed] [Google Scholar]
- 6.Yetkin FZ, Hammeke TA, Swanson SJ, et al. A comparison of functional MR activation patterns during silent and audible language tasks. AJNR Am J Neuroradiol 1995;16:1087-1092 [PMC free article] [PubMed] [Google Scholar]
- 7.Yetkin FZ, Mc Auliffe TL, Cox R, Haughton VM. Test-retest precision of functional MR in sensory and motor task activation. AJNR Am J Neuroradiol 1996;17:579-584 [PMC free article] [PubMed] [Google Scholar]
- 8.Rao SM, Binder JR, Bandettini PA, et al. Functional magnetic resonance imaging of complex human movements. Neurology 1993;43:2311-2318 [DOI] [PubMed] [Google Scholar]
- 9.Lowe MJ, Mock BJ, Sorenson JA. Functional connectivity in single and multislice echoplanar imaging using resting state fluctuations. Neuroimage 1998;7:119-132 [DOI] [PubMed] [Google Scholar]
- 10.Lowe MJ, Sorenson JA. Spatially filtering functional magnetic resonance imaging data. Magn Reson Med 1997;37:723-729 [DOI] [PubMed] [Google Scholar]
- 11.Cox RW. AFNI: software for analysis and visualization of functional magnetic resonance neuroimages. Comput Biomed Res 1996;29:162-173 [DOI] [PubMed] [Google Scholar]
- 12.Stein T, Moritz C, Quigley M, Cordes D, Haughton V, Meyerand E. Functional connectivity in the thalamus and hippocampus studied with functional MR imaging. AJNR Am J Neuroradiol 2000;21:1397-1401 [PMC free article] [PubMed] [Google Scholar]
- 13.Shaywitz BA, Shaywitz SE, Pugh KR, et al. Sex differences in the functional organization of the brain for language. Nature 1995;373:607-609 [DOI] [PubMed] [Google Scholar]
- 14.Geschwind N. Disconnection syndromes in animals and man. Brain 1965;888:231-294 [Google Scholar]
- 15.Paulesu E, Frith U, Snowling M, et al. Is developmental dyslexia a disconnection syndrome? Evidence from PET scanning. Brain 1996;119:143-157 [DOI] [PubMed] [Google Scholar]
- 16.Randall PL. Neuroanatomical theory on the aetiology of schizophrenia. Medical Hypotheses 1980;6:645-658 [DOI] [PubMed] [Google Scholar]


