

Abstract
BACKGROUND AND PURPOSE: Pelizeaus-Merzbacher disease (PMD) is a clinically and molecularly heterogeneous disorder linked to deletion, mutations, or duplication of the proteolipid protein (PLP1) gene locus at Xq22. The current study was conducted to characterize the results of proton MR spectroscopic (MRS) imaging in PMD.
METHODS: Three boys with PMD (one with the severe connatal form and two with a more mild clinical phenotype [spastic paraplegia type 2]). and three age-matched healthy control subjects (age range, 2–7 years) underwent MR and MRS imaging . All imaging was performed at 1.5 T. For MRS imaging, oblique-axial sections (thickness, 15 mm; intersection gap, 2.5 mm) were recorded parallel to the anterior commissure–posterior commissure line (TR/TE/NEX, 2300/272/1) with lipid and water suppression. Ratios of metabolite peak areas were calculated, and spectra were bilaterally evaluated.
RESULTS: Diffuse or focal reductions in N-acetylaspartate were observed in the affected white matter in all three cases. These reductions seemed to be consistent with axonal damage. In addition, mild increases in choline and creatine levels were observed; these may have been due to astrocytic changes.
CONCLUSION: Proton MRS imaging may be helpful in evaluating regional pathophysiologic abnormalities in PMD and in distinguishing PMD from other leukodystrophies, which exhibit different metabolic profiles.
Pelizeaus-Merzbacher disease (PMD) is a clinically and molecularly heterogeneous disorder linked to deletion, mutations (15–20% of cases), or duplication (60–70% cases) of the proteolipid protein (PLP1) gene locus at Xq22 (1, 2). The expression of PLP1 gene in the central nervous system is limited to myelin-forming cells, the oligodendrocytes (3). PLP1, a four-helix spanning membrane protein, and its splice isoform, DM20, are major components of the compact myelin sheath, accounting for 50% of myelin proteins (3). The range of PMD phenotypes include the most severe, connatal form characterized by congenital nystagmus beginning in the first year of life, delayed achievement of motor and cognitive milestones, ataxia and seizures, and a relatively mild form with spastic paraparesis called spastic paraplegia type 2 (SPG2) (4). Most individuals with PLP1 duplications and missense mutation substitutions generally present with connatal PMD. However, some milder missense mutations (eg, the Rumpshaker variant) do not result in either substantial hypomyelination or disability. Mutations that prevent any PLP1 from being made somewhat paradoxically result in a syndrome that is usually milder than classic PMD, which is characterized by childhood-onset spastic paraplegia, mild cognitive impairment, ataxia, athetosis, and peripheral neuropathy. In these cases, neurologic signs typically progress at a gradual rate, with periods of relative stability (5).
In PMD, MR images generally show either diffuse or patchy (tigroid) T2 hyperintensity in the cerebellar, brain stem, and supratentorial white matter. This appearance is believed to be the result of the lack of formation of myelin (hypomyelination or dysmyelination) (6). Diffuse, confluent involvement is usually seen in the severe connatal form, whereas the tigroid pattern is more common in the patients with SPG2. Atrophy and decreased white matter volume may also occur. In addition to the lack of myelination, axonal degeneration has recently been shown to occur in PMD, which may be at least partly responsible for the clinical disability observed (5). The techniques of MR spectroscopy (MRS) and MRS imaging may be potentially useful in evaluating both axonal integrity (on the basis of N-acetylaspartate [NAA] levels) (7) and myelination (related to the signal intensity of choline [Cho]) (8). However, reports of either MRS or MRS imaging in PMD have been relatively few, and the results are somewhat variable (5, 9–16) (Table 1). Some groups have found either near-normal levels of all metabolites (10, 12), decreased levels of Cho (interpreted as due to hypomyelination) (13), or decreased levels of NAA (interpreted as reflecting axonal loss or dysfunction) (5, 14, 16). These findings might be related to different clinical phenotypes, genotypes, or stages of disease progression (17). However, they may also partially reflect the different spectroscopic techniques used. The current study was conducted to characterize the results of proton MRS imaging in three patients with PMD and three age-matched control subjects.
TABLE 1:
Summary of findings from prior MR spectroscopic studies of PMD
| Study | No. of Patients | Age, y | Genetics | Technique* | Findings |
|---|---|---|---|---|---|
| Grodd et al, 1991 | 4 | 0.7–5.7 | Not given | SV MRS, ratios | 2 patterns: increased Cho and decreased NAA levels or decreased Cho and normal NAA levels |
| Takanashi et al, 1997 | 2 | 5, 6 | Point mutations: exon 5 (Pro210(4)→Leu[CTA]), exon 2 (Leu45[CTA]→Arg[CGA]) | SV MRS, ratios | Normal MRS results, trend for increased creatine levels |
| Lam et al, 1998 | 1 | 19 | Not given | SV MRS, quantitation | Slightly decreased NAA level in basal ganglia |
| Spalice et al, 2000 | 2 | 1.5, 6 | Connatal PMD, no mutation or duplication detected | SV MRS, ratios | Decreased Cho level |
| Bonavita et al, 2001 | 9 | 6–43 | Duplication (n=1), mutations G431A (n=6) and K150N (n=2) | MRSI, ratios | Decreased NAA level |
| Garbern et al, 2002 | 2 | 11, 17 | Deletion, mutation (G to A) | MRS, MRSI, quantitation | Decreased NAA level |
| Hobson et al, 2002 | 1 | 11 | Deletion 19 base pairs intron 3 PLP1/DM20 | SV MRS, ratios | Increased Cho, decreased NAA levels |
| Takanashi et al, 2002 | 5 | 4–10 | Duplication (classic PMD, mild form, n=4; severe connatal form, n = 1) | SV MRS, quantitation | Mildly increased NAA, creatine, and myo-inositol levels; normal Cho level |
MRS indicates MR spectroscopy; SV, single voxel.
Methods
Three boys with PMD and three age-matched healthy control subjects (age range, 2–7 years) underwent MR imaging and MRS imaging between June 1993 and September 2001. Single-strand conformation polymorphism (SSCP) analysis of the PLP1 gene was performed as described previously by researchers in the Department of Molecular Genetics, Indiana University, Indianapolis, Indiana (18). Control subjects were the healthy siblings of patients (with other non-PMD diseases). These subjects were examined with the same MR protocol. Informed consent was obtained in all cases, and the research protocol was approved by the local institutional review board.
All imaging was performed at 1.5 T (Signa; General Electric Medical Systems, Milwaukee, WI). For proton MRS imaging, four oblique-axial sections (thickness, 15 mm; intersection gap, 2.5 mm) were recorded parallel to the anterior commissure–posterior commissure line with a TR/TE/NEX of 2300/272/1, a field of view of 24 cm, and a matrix of 32 × 32. Outer volume saturation pulses were used for the suppression of lipid and water signals originating from the skull and scalp, and a chemical shift-selective saturation pulse was used for water suppression. The nominal voxel size was 0.8 cm3. Full technical details are given elsewhere (19). MRS imaging data were processed as described previously (20). Ratios (NAA/Cho, NAA/creatine (Cr), Cho/Cr) of metabolite peak areas measured by using numeric integration were calculated. Spectra were bilaterally evaluated in voxels in the frontal white matter, the centrum semiovale, the parietal white matter, and the mesial parieto-occipital gray matter. For this evaluation, one section at a level slightly above the lateral ventricles was used (Fig 1). Metabolite peak areas for white matter voxels were also expressed after they were normalized to peak areas of the same metabolites measured in unaffected gray matter.
Fig 1.
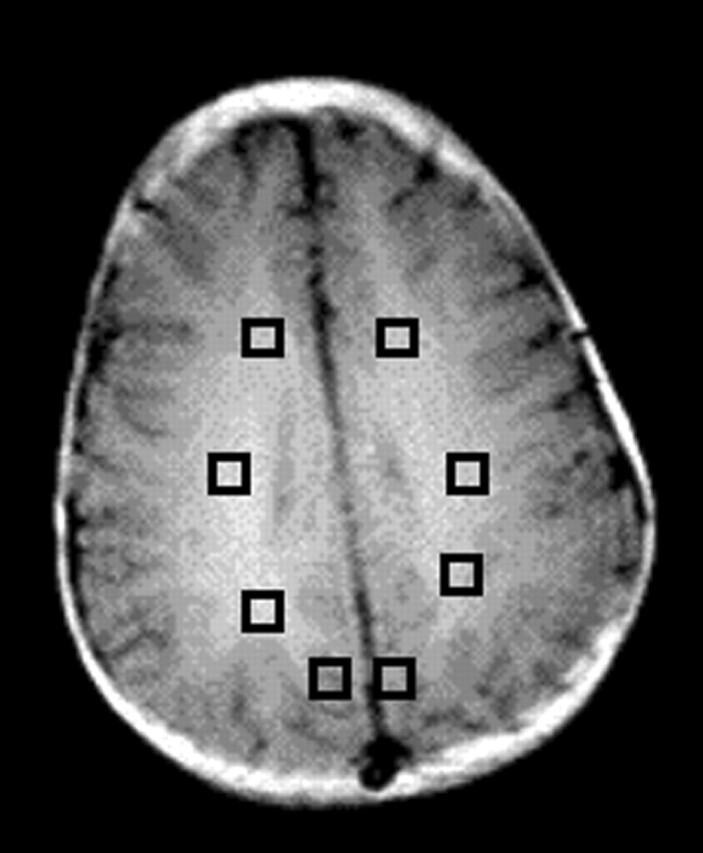
Regions of interest (squares) in the frontal-lobe white matter, centrum semiovale, and parietal white matter and gray matter were chosen for analysis.
Results
Table 2 shows the metabolite ratios in the frontal white matter, the centrum semiovale, the parietal white matter, and the parieto-occipital gray matter in the patients and control subjects.
TABLE 2:
Metabolite ratios
| Individual | Metabolite Levels Relative to Gray Matter |
Metabolite Ratios |
||||
|---|---|---|---|---|---|---|
| Cho | Cr | NAA | NAA/Cho | NAA/Cr | Cho/Cr | |
| A. Frontal white matter | ||||||
| Patient 1 | 1.17 | 1.19 | 0.84 | 1.16 | 1.63 | 1.41 |
| Patient 2 | 1.28 | 1.01 | 1.02 | 1.62 | 2.63 | 1.63 |
| Patient 3 | 1.68 | 0.95 | 0.87 | 1.27 | 2.32 | 1.83 |
| Control subject 1 | 1.64 | 1.00 | 0.81 | 1.09 | 2.17 | 2.00 |
| Control subject 2 | 1.51 | 0.92 | 0.94 | 1.26 | 2.57 | 2.03 |
| Control subject 3 | 1.14 | 0.61 | 0.85 | 1.89 | 4.17 | 2.21 |
|
B. Centrum semiovale |
||||||
| Patient 1 | 1.38 | 1.11 | 0.74 | 0.87 | 1.55 | 1.79 |
| Patient 2 | 1.28 | 0.95 | 0.89 | 1.42 | 2.43 | 1.71 |
| Patient 3 | 1.61 | 1.02 | 0.96 | 1.46 | 2.38 | 1.63 |
| Control subject 1 | 1.35 | 0.81 | 0.82 | 1.34 | 2.71 | 2.03 |
| Control subject 2 | 1.38 | 0.85 | 0.99 | 1.46 | 2.90 | 1.99 |
| Control subject 3 | 1.55 | 0.85 | 0.99 | 1.61 | 3.46 | 2.15 |
|
C: Parietal white matter |
||||||
| Patient 1 | 1.31 | 1.03 | 0.61 | 0.76 | 1.37 | 1.81 |
| Patient 2 | 1.13 | 0.97 | 0.93 | 1.69 | 2.50 | 1.48 |
| Patient 3 | 1.65 | 1.03 | 0.81 | 1.20 | 1.98 | 1.66 |
| Control subject 1 | 1.42 | 0.92 | 0.84 | 1.29 | 2.42 | 1.87 |
| Control subject 2 | 1.42 | 0.84 | 0.96 | 1.37 | 2.84 | 2.07 |
| Control subject 3 | 1.45 | 0.66 | 0.84 | 1.46 | 3.80 | 2.60 |
|
D: Parieto-occipital gray matter* |
||||||
| Patient 1 | NA | NA | NA | 1.61 | 2.31 | 1.43 |
| Patient 2 | NA | NA | NA | 2.03 | 2.60 | 1.28 |
| Patient 3 | NA | NA | NA | 2.44 | 2.52 | 1.04 |
| Control subject 1 | NA | NA | NA | 2.19 | 2.67 | 1.22 |
| Control subject 2 | NA | NA | NA | 2.03 | 2.50 | 1.23 |
| Control subject 3 | NA | NA | NA | 2.52 | 2.99 | 1.18 |
Note.—Patient 1 was aged 2 years 5 months; patient 2, 3 years, 8 months; patient 3, 7 years, 6 months; control subject 1, 1 year, 9 months; control subject 2, 3 years, 2 months; and control subject 3, 7 years, 0 months.
NA indicates not applicable.
Patient 1
Patient 1 (male, aged 2 years 5 months) was born after a full-term unremarkable pregnancy and delivery. His Apgar scores were normal. The patient presented with hypotonia; nystagmus; severe motor, cognitive, and language delay; little head control; hyperreflexia throughout the upper and lower extremities; and bilateral Babinski signs. His visual and brain stem auditory evoked response potentials were abnormal. Other laboratory studies, including serum amino acid and urine organic acid levels, were within normal limits. The patient’s family history included a maternal uncle who had strabismus and limited language skills with no history of ambulation.
Genetic studies of the PLP1 gene revealed a G-to-T transversion at nucleotide 449 in the third exon of the PLP1 gene, which leads to a lysine 150–to-asparagine replacement and to the loss of the Hph I restriction site (21). MR imaging showed diffuse T2 hyperintensity within the supratentorial white matter, midbrain, and cerebellum (Fig 2). The splenium of the corpus callosum and the basal ganglia had a normal MR imaging appearance. MRS imaging revealed substantially decreased levels of NAA in the affected white matter and also mildly increased levels of Cho and Cr (particularly in the centrum semiovale) (Fig 2, Table 2). Spectra from the gray matter had ratios of NAA/Cho and NAA/Cr lower and a ratio of Cho/Cr higher than those of the age-matched control subject.
Fig 2.

Severe PMD. T2-weighted MR images (T2); metabolic images of Cho, Cr and NAA; and selected spectra from the parietal white matter (WM) and parieto-occipital gray matter (GM). T2-weighted MR images show diffuse hyperintensity throughout the white matter, which also has markedly decreased NAA levels. Cho and Cr levels are also mildly elevated in the centrum semiovale. Gray matter spectra also show a lower ratio of NAA/Cho and NAA/Cr in the patient compared with that in the control subject.
A, Patient 1, aged 2 years 5 months.
B, Control subject 1, aged 1 year 9 months.
Patient 2
Patient 2 (male, aged 3 years 8 months) was born after a full-term pregnancy that was unremarkable except for the occurrence of hypertension during the last 2 weeks. He was the only affected child in the family. He presented with a delay in motor skills but with normal cognitive and language development. Neurologic examination revealed hyperreflexia and spasticity in the lower extremities, with a positive Babinski sign, some dysmetria, an action tremor in the upper extremities, and fine pendular nystagmus. His auditory and visual somatosensory evoked potentials were normal. Laboratory results for serum amino acids were normal, whereas urine organic acid levels were slightly increased for lysine, 2037–4411 μmol/L/g creatinine (normal range, 98–559 μmol/L/g). The plasma lysine level was normal (156 μmol/L/L).
Genetic study of the PLP1 gene revealed a transition in codon 186, which changes the isoleucine residue to threonine in exon 4 (the Rumpshaker mutation) (22). MR imaging performed when the patient was aged 3 years 8 months showed extensive, patchy, T2 hyperintensity throughout the white matter, with more evidence within the occipital and parietal lobes (Fig 3). Perivascular spaces were prominent. The corpus callosum, basal ganglia, cerebellum, and brain stem appeared normal. At this age, MRS imaging showed reduced NAA levels in the parietal white matter and an increase in Cr levels in all three white matter regions evaluated (Fig 3, Table 2). Spectra from the gray matter were normal. To date, the patient has remained stable in terms of motor spasticity (dependent on baclofen), and he has continued to do well clinically.
Fig 3.

Mild PMD. T2-weighted MR imaging; metabolic images of Cho, Cr, and NAA; and selected spectra from the parietal white matter and parieto-occipital gray matter. T2-weighted MR images show patchy hyperintensity with greatest involvement in the centrum semiovale. NAA levels are bilaterally decreased in the parietal white matter. Gray-matter spectra are normal.
A, Patient 2, aged 3 years 8 months.
B, Control subject 2, aged 3 year 2 months.
Patient 3
Patient 3 (male, aged 7 years 6 months) was born after a full-term, unremarkable pregnancy and delivery. He was the only affected child in the family. The patient presented with mild paraplegia; ataxia and moderately impaired language ability; and a gradually improving, congenital, horizontal pendular nystagmus. His cognitive development was normal. Detailed examination revealed poor truncal balance, hyperreflexia in the lower extremities, a positive Babinski sign, and truncal ataxia with dysmetria. His auditory and visual somatosensory evoked potentials were normal, as were his laboratory results for serum amino acids and urine organic acids.
Genetic studies of the PLP1 gene revealed a T494G transversion, which is responsible for replacement of valine 165 by glycine (18). MR images obtained at the age of 1 month were normal, but at 2 years 4 months of age, T2-weighted MR images showed diffuse, patchy, and symmetrically increased signal intensity within the white matter. T2-weighted MR imaging performed at the age of 7 years 6 months revealed prominent perivascular spaces, a small cyst in the left choroidal fissure, and patchy areas of increased signal intensity in the parietal whiter matter (tigroid pattern) and periventricular white matter. MRS imaging performed at this age demonstrated mildly decreased NAA levels in the periventricular white matter and a mild increase in Cho and Cr levels, particularly in the frontal and parietal white matter (Table 2). Spectra from the gray matter were normal. To date, the patient has continued to do well at school, and nystagmus has been absent; however, the patient has experienced a slight increase in spasticity in the lower extremities.
Discussion
All three cases reported here had point mutations of the PLP1 gene, with either the classic form (patient 1) or milder forms (patients 2 and 3) of PMD. Patient 1 had the greatest degree of clinical involvement and the most severe MR imaging abnormalities. Confluent white matter T2 hyperintensity was observed throughout the brain, with the exception of the splenium of the corpus callosum, which appeared normal. This patient also had the greatest reduction in NAA levels in regions of white matter (Fig 2). The corpus callosum and deep gray matter structures had normal MR imaging appearances in all three patients. Patients 2 and 3 had patchy rather than confluent white matter involvement, with the greatest involvement in the periventricular regions and in the parietal and occipital lobes.
Interpretation of MRSI data in pediatric PMD cases is hampered by the current lack of a published database of normative regional and age-related metabolite concentrations in young children (23). For this reason, care was taken to include age-matched control subjects for comparison with each patient with PMD. Although quantitative MRS imaging methods have been developed (20), the required machine calibrations were unavailable for the period (8 years) during which the MRS images were obtained in the current study. Therefore, the results are instead presented as metabolite ratios. These metabolite ratios were calculated both within voxels (NAA/Cho, NAA/Cr, Cho/Cr) or between voxels relative to the gray matter, which had a normal appearance with both MR imaging and MRS imaging (at least in cases 2 and 3). Consistent with previous reports (24), the younger children in this study (both control subjects and patients with PMD) had relatively high Cho signals in white matter, particularly in the frontal lobe and the centrum semiovale. In the control subjects, these signals decreased with increasing age. However, the oldest PMD patient (patient 3) had mildly elevated Cho levels in all three white matter regions examined, as well as increased Cr levels. Cr values were also increased in patient 2. The increases in Cho and Cr were somewhat unexpected, given that most previous MR spectroscopy studies demonstrated either near-normal spectra or decreased Cho or NAA levels in PMD. However, increased astrocytic processes (determined by staining for glial fibrillary acidic protein [GFAP]) have been observed in PMD (5). These processes may be responsible for increased levels of both (or either) Cho and Cr, since in vitro spectroscopic studies of primary astrocyte cultures has revealed Cho and Cr concentrations approximately twofold higher than those in neuronal cell types (8). Gliosis has been observed in rats and mice that overexpress PLP1; these are good models for classic PMD caused by PLP1 gene duplication (25, 26). In addition, gliosis is also present in jimpy mice, a PMD model which underexpresses PLP1 (27). Other possible reasons for elevated Cho values include the presence of myelin breakdown products (28) or the lack of normal brain development (24). One recent study of single-voxel MRS also revealed elevated Cho values in the parieto-occipital white matter of an 11-year-old PMD patient with a 19-basepair deletion in PLP1 (16). A pattern of elevated Cho levels was also observed in one patient with severe connatal PMD (9).
In addition to increased astrocytic processes, histologic analyses of the CNS in animals carrying PLP1 gene mutations (4, 5, 29) and of autopsy materials from a patient with null PLP1 mutations (5) have shown evidence of axonal damage. Axonal swelling, degeneration of the long motor and sensory axonal tracts, and decreased density of myelinated axons have been reported. Consistent with this axonal damage, we observed diffuse reductions in NAA values in the affected white matter in patient 1 (who had the most severe clinical involvement), symmetrical and bilateral reductions in the parietal white matter of patient 2, and reduced NAA levels in the periventricular regions in patient 3. This axonal damage appears to be caused by the disruption of PLP1-mediated axonal-glial interactions, since axonal loss has been observed in the absence of any demyelination in animal models (5).
Regional variations in metabolite levels are most conveniently studied by using MRS imaging rather than the alternative technique of single-voxel MRS. MRS imaging also provided coverage of gray matter regions, which had normal spectral appearances in patients 2 and 3, but did show somewhat reduced ratios of NAA/Cr and NAA/Cho and an increased Cho/Cr ratio in patient 1, as compared with the age-matched control subject. Short-TE spectroscopy might have added extra information about gliosis by providing measurements of myo-inositol, which was not observable by using long-TE MRS imaging. Unfortunately, short-TE MRS imaging was not available for the current study.
Conclusion
MRS imaging appears to be helpful in determining the spatial distribution and severity of PMD-induced metabolic abnormalities, which may be related to the underlying pathophysiology of the disease. Although only a small number of cases are reported here, the largest spectroscopic changes were found in the most severely affected case. This observation suggests a possible role for MRS imaging in evaluating the degree of cerebral involvement. Decreased levels of NAA are most likely associated with neuroaxonal degeneration, whereas increased levels of Cho or Cr may arise from increased astrocytic processes. Proton MRS imaging may be helpful in distinguishing PMD from other leukodystrophies with characteristic metabolic patterns (28, 30). However, care is needed in the interpretation of MRS imaging data in young children, because substantial regional age-related changes in metabolite levels occur (23, 24, 31).
Acknowledgments
We thank Dr Jeffrey Duyn and Dr Jan Willem van der Veen (National Institutes of Health, Bethesda, MD) for the MRS imaging pulse sequence and Dr James Garbern (Department of Neurology, Wayne State University, Detroit, MI) for his many helpful suggestions and comments. We would also like to thank the laboratory of the late Dr Edward Hodes (Indiana University, Indianapolis, IN) for performing the SSCP analyses.
Footnotes
Supported in part by National Institutes of Health grant P41 RR15241.
References
- 1.Hodes ME, Pratt VM, Dlouhy SR. Genetics of Pelizaeus-Merzbacher disease. Dev Neurosci 1993;15:383–394 [DOI] [PubMed] [Google Scholar]
- 2.Woodward K, Malcolm S. Proteolipid protein gene: Pelizaeus-Merzbacher disease in humans and neurodegeneration in mice. Trends Genet 1999;15:125–128 [DOI] [PubMed] [Google Scholar]
- 3.Anderson TJ, Schneider A, Barrie JA, et al. Late-onset neurodegeneration in mice with increased dosage of the proteolipid protein gene. J Comp Neurol 1998;394:506–519 [DOI] [PubMed] [Google Scholar]
- 4.Garbern J, Cambi F, Shy M, Kamholz J. The molecular pathogenesis of Pelizaeus-Merzbacher disease. Arch Neurol 1999;56:1210–1214 [DOI] [PubMed] [Google Scholar]
- 5.Garbern JY, Yool DA, Moore GJ, et al. Patients lacking the major CNS myelin protein, proteolipid protein 1, develop length-dependent axonal degeneration in the absence of demyelination and inflammation. Brain 2002;125:551–561 [DOI] [PubMed] [Google Scholar]
- 6.Barkovich AJ. Concepts of myelin and myelination in neuroradiology. AJNR Am J Neuroradiol 2000;21:1099–1109 [PMC free article] [PubMed] [Google Scholar]
- 7.Barker PB. N-Acetyl aspartate: a neuronal marker? Ann Neurol 2001;49:423–424 [PubMed] [Google Scholar]
- 8.Urenjak J, Williams SR, Gadian DG, Noble M. Proton nuclear magnetic resonance spectroscopy unambiguously identifies different neural cell types. J Neurosci 1993;13:981–989 [DOI] [PMC free article] [PubMed] [Google Scholar]
- 9.Grodd W, Krageloh-Mann I, Klose U, Sauter R. Metabolic and destructive brain disorders in children: findings with localized proton MR spectroscopy. Radiology 1991;181:173–181 [DOI] [PubMed] [Google Scholar]
- 10.Takanashi J, Sugita K, Osaka H, Ishii M, Niimi H. Proton MR spectroscopy in Pelizaeus-Merzbacher disease. AJNR Am J Neuroradiol 1997;18:533–535 [PMC free article] [PubMed] [Google Scholar]
- 11.Lam WW, Wang ZJ, Zhao H, et al. 1H MR spectroscopy of the basal ganglia in childhood: a semiquantitative analysis. Neuroradiology 1998;40:315–323 [DOI] [PubMed] [Google Scholar]
- 12.Nezu A, Kimura S, Takeshita S, Osaka H, Kimura K, Inoue K. An MRI and MRS study of Pelizaeus-Merzbacher disease. Pediatr Neurol 1998;18:334–337 [DOI] [PubMed] [Google Scholar]
- 13.Spalice A, Popolizio T, Parisi P, Scarabino T, Iannetti P. Proton MR spectroscopy in connatal Pelizaeus-Merzbacher disease. Pediatr Radiol 2000;30:171–175 [DOI] [PubMed] [Google Scholar]
- 14.Bonavita S, Schiffmann R, Moore DF, et al. Evidence for neuroaxonal injury in patients with proteolipid protein gene mutations. Neurology 2001;56:785–788 [DOI] [PubMed] [Google Scholar]
- 15.Takanashi J, Inoue K, Tomita M, et al. Brain N-acetylaspartate is elevated in Pelizaeus-Merzbacher disease with PLP1 duplication. Neurology 2002;58:237–241 [DOI] [PubMed] [Google Scholar]
- 16.Hobson GM, Huang Z, Sperle K, Stabley DL, Marks HG, Cambi F. A PLP splicing abnormality is associated with an unusual presentation of PMD. Ann Neurol 2002;52:477–488 [DOI] [PubMed] [Google Scholar]
- 17.Garbern J, Shy M, Krajewski K, Kamholz J, Hobson G, Cambi F. Evidence for neuroaxonal injury in patients with proteolipid gene mutations. Neurology 2001;57:1938–1939 [DOI] [PubMed] [Google Scholar]
- 18.Hodes ME, Zimmerman AW, Aydanian A, et al. Different mutations in the same codon of the proteolipid protein gene, PLP, may help in correlating genotype with phenotype in Pelizaeus-Merzbacher disease/X-linked spastic paraplegia (PMD/SPG2). Am J Med Genet 1999;82:132–139 [DOI] [PubMed] [Google Scholar]
- 19.Duyn JH, Gillen J, Sobering G, van Zijl PCM, Moonen CTW. Multisection proton MR spectroscopic imaging of the brain. Radiology 1993;188:277–282 [DOI] [PubMed] [Google Scholar]
- 20.Soher BJ, van Zijl PCM, Duyn JH, Barker PB. Quantitative proton spectroscopic imaging of the human brain. Magn Reson Med. 1996;35:356–363 [DOI] [PubMed] [Google Scholar]
- 21.Pratt VM, Naidu S, Dlouhy SR, Marks HG, Hodes ME. A novel mutation in exon 3 of the proteolipid protein gene in Pelizaeus-Merzbacher disease. Neurology 1995;45:394–395 [DOI] [PubMed] [Google Scholar]
- 22.Naidu S, Dlouhy SR, Geraghty MT, Hodes ME. A male child with the rumpshaker mutation, X-linked spastic paraplegia/Pelizaeus-Merzbacher disease and lysinuria. J Inherit Metab Dis 1997;20:811–816 [DOI] [PubMed] [Google Scholar]
- 23.Horská A, Kaufmann WE, Brant LJ, Naidu S, Harris JC, Barker PB. In vivo quantitative proton MRSI study Of brain development from childhood to adolescence. J Magn Reson Imag. 2002;15:137–143 [DOI] [PubMed] [Google Scholar]
- 24.Kreis R, Ernst T, Ross BD. Development of the human brain: in vivo quantification of metabolite and water content with proton magnetic resonance spectroscopy. Magn Reson Med. 1993;30:424–437 [DOI] [PubMed] [Google Scholar]
- 25.Mastronardi FG, Ackerley CA, Arsenault L, Roots BI, Moscarello MA. Demyelination in a transgenic mouse: a model for multiple sclerosis. J Neurosci Res 1993;36:315–324 [DOI] [PubMed] [Google Scholar]
- 26.Bradl M, Bauer J, Inomata T, et al. Transgenic Lewis rats overexpressing the proteolipid protein gene: myelin degeneration and its effect on T cell-mediated experimental autoimmune encephalomyelitis. Acta Neuropathol (Berl) 1999;97:595–606 [DOI] [PubMed] [Google Scholar]
- 27.Best TT, Skoff RP, Bartlett WP. Astroglial plasticity in hemizygous and heterozygous jimpy mice. Int J Dev Neurosci 1988;6:39—57 [DOI] [PubMed] [Google Scholar]
- 28.Kruse B, Barker PB, van Zijl PCM, Duyn JH, Moonen CTW, Moser HW. Multislice proton MR spectroscopic imaging in X-linked adrenoleukodystrophy. Ann Neurol 1994;36:595–608 [DOI] [PubMed] [Google Scholar]
- 29.Griffiths I, Klugmann M, Anderson T, et al. Axonal swellings and degeneration in mice lacking the major proteolipid of myelin. Science 1998;280:1610–1613 [DOI] [PubMed] [Google Scholar]
- 30.Barker PB, Bryan RN, Kumar AJ, Naidu S. Proton NMR spectroscopy of Canavan’s disease. Neuropediatrics 1992;23:263–267 [DOI] [PubMed] [Google Scholar]
- 31.Pouwels PJW, Brockmann K, Kruse B, et al. Regional age dependence of human brain metabolites from infancy to adulthood as detected by quantitative localized proton MRS. Pediatr Res 1999;46:474–485 [DOI] [PubMed] [Google Scholar]