

Abstract
BACKGROUND AND PURPOSE: Functional MR imaging and magnetoencephalography are commonly used to study normal cortical sensory and cognitive processing as well as a variety of disease states. The usefulness of these techniques is dependent on the reproducibility and sensitivity to change of derived measures of brain function. The purpose of this study was to compare the efficacy of functional MR imaging and magnetoencephalography as measures of the extent of cortical activity in response to a graded stimulus.
METHODS: Five participants underwent functional MR imaging and magnetoencephalography involving stimulation of one, two, three, and four digits of the left hand. Measurements of activation were repeated three times per participant. The cortical extent of activation was assessed for functional MR imaging by observing the number of “activated” pixels and the “amount of activation”: the product of the number of activated pixels and the mean signal change. Activation was quantified for magnetoencephalography as the magnitude of the evoked magnetic field peak and as the strength of the modeled current source, Q.
RESULTS: For functional MR imaging, the number of activated pixels tended to increase with the increasing number of stimulated digits. High intra- and interparticipant variability (66% and 85% variation, respectively) did not, however, allow statistical resolution of this trend. The amount of activation was similarly variable (interparticipant, 89%). Magnetoencephalography was more robust regarding quantification. The evoked field amplitude varied linearly with the number of digits stimulated; intra- and interparticipant variability was 18% and 41%, respectively, permitting resolution of significant differences between any combination of stimulated digits, except two versus three (P < .05).
CONCLUSION: Although functional MR imaging and magnetoencephalography show measurable evoked responses with somatosensory stimulation, in this study, functional MR imaging did not permit robust quantification of increasing cortical areas of activation.
Studies of human neocortex by use of noninvasive neuroimaging techniques have led to a dramatic increase in our understanding of normal brain function, from the topographic organization of sensory cortex (1–3) to “higher-order” cognitive functions such as language or learning and memory (4–8). Functional cortical imaging is of clinical significance in studies of reorganization after injury or during rehabilitation, deterioration during progressive disease, and cortical mapping before neurosurgery (9–11). Functional MR imaging (12, 13) and magnetoencephalography are state-of-the-art tools available for the study of cortical spatial organization and temporal activity (14), respectively. Both have been used extensively in the study of normal and abnormal cortical function. The relevance of studies using these techniques hinges on the precision of quantification and the reproducibility of the methods used for measuring cortical activity.
Accurate anatomic localization of functional centers is important. However, the quantification of the extent of cortical activation and the accurate determination of changes in activation with changes in the stimulus (eg, in area or amplitude) are also significant. Sensitivity to changes in cortical activity and the reproducibility of results are crucial for measurements across participants as well as for longitudinal studies of individual participants. Clinical applications in the quantitative evaluation of focal dystonia, rehabilitation after sensorimotor stroke, etc., demand longitudinal quantitative estimation of the extent of cortical activation. The opportunity to evaluate therapies thoroughly and to offer potential objective surrogate markers of clinical outcome relies on a quantitative measure of the functional parameter of interest (in this case, the area of somatosensory representation). Extensions to other sensory systems would allow similar evaluation of corresponding sensory deficits, rehabilitation, training, and therapy. The purpose of this study was to quantify functional MR imaging and magnetoencephalographic measures of the extent of cortical activity and to compare the reproducibility of these measures and their sensitivity to incremental stimulus change.
Methods
Participants
All studies were performed with the approval of the institutional committee for human research. Written, informed consent was obtained from all participants. Five healthy volunteers (four men and one woman), all right-handed, underwent this study. All protocols (for both functional MR imaging and magnetoencephalography) were repeated on three occasions for each participant to allow assessment of intraparticipant variability. For both magnetoencephalography and functional MR imaging, two repeated procedures were performed on a single occasion, without head repositioning; the final imaging session was performed within 1 day to 2 weeks. Magnetoencephalography and functional MR imaging were performed for the same participants within a 4-week period.
Stimuli
Painless somatosensory tactile stimuli were delivered alternately to one, two, three, or four digits of the left hand (excluding the fifth digit) via a compressed air-driven balloon diaphragm. Air was delivered at 15 pounds per square inch for 30-millisecond duration pulses. Stimuli were repeated at a rate of 2 Hz for both functional MR imaging and magnetoencephalography studies.
Functional MR Imaging
Functional MR imaging was performed using a GE Signa 1.5-T imager (Signa version 5.6; GE Medical Systems, Milwaukee, WI), equipped with 25 mT/m gradient coils. Multisection gradient-recalled echo-planar imaging was performed with the following parameters: 2000/69 (TR/TE); flip angle, 60°; matrix, 256 × 128; field of view, 40 × 20 cm; number of sections, six; section thickness, 5 mm; inter-section gap,1 mm. Seventy images were acquired at each section location (total, 420 images) during 20-second alternating blocks of rest and stimulus presentation. Motion correction was accomplished using a multisection 2D algorithm, implemented in the Automated Image Registration (AIR 3.08) software package (15). Activation detection was accomplished with the STIMULATE software package (16), using a cross-correlation algorithm with the stimulus boxcar reference function, allowing for a 4-second hemodynamic lag. Pixels were defined as activated when correlation coefficients exceeded r = 0.3, subject to a clustering requirement for five contiguous activated pixels, in concordance with our previous experience (17). Regions of interest were user-drawn, to reject apparent artifactual activations, by two readers. The readers were blind to each other's findings and to the nature of the specific trial being evaluated (one versus two versus three versus four digits).
Magnetoencephalography
Magnetoencephalography was performed using a 37-channel biomagnetometer (Magnes II; Biomagnetic Technologies Inc., San Diego, CA), with the sensor array positioned over the participants' right parietal regions. Epochs of data were sampled at approximately 1 kHz (1041.7 Hz) per channel during 300 ms: 150 ms, pretrigger baseline, and 150 ms, post stimulus. After artifact rejection, epochs were averaged (time-locked to stimulus onset). Two hundred fifty-six stimuli of each type were presented with pseudo-random interstimulus intervals of 500 ± 50 ms. Evoked responses were digitally filtered (1–40 Hz pass-band) and the primary somatosensory evoked field component identified as the peak of neuronal coherence (maximum evoked field), arising between 30 and 70 ms after stimulus onset, in accordance with the standard procedures of our laboratory and of others (17–19). The current source of this peak was modeled as a single equivalent current dipole using iterative nonlinear least squares fitting of the Biot-Savart “forward equation” for magnetic field at the sensors. The coordinates of the source were transformed into the MR imaging reference frame (for overlay on 3D MR imaging) by the identification of external anatomic fiducial markers (nasion, left/right preauricular points) to ensure origin in the postcentral gyrus. Registration errors associated with this overlay have previously been estimated to be approximately 4 mm (20).
Quantification
Functional MR imaging–detected activation, defined using the cross-correlation algorithm, was quantified in two forms: 1) the area of activation (ie, the number of image pixels exceeding the correlation threshold), and 2) the amount of activation, defined as equal to the product of the number of activated pixels and the mean signal intensity increase (ΔSI) in these pixels on activation compared with rest. Previously, the amount of activation has been shown to be a sensitive indicator of activation changes in sensory cortex (21).
Magnetoencephalography was quantified in terms of the peak instantaneous measured evoked field (with units of femtotesla). Additionally, the strength of the modeled current source, Q (with units of nano-ampere-meter), was computed to facilitate interparticipant comparisons. Evoked field is a measured quantity and therefore not subject to the errors introduced by source modeling the magnetoencephalogram. However, it is sensitive to systematic variations in measurement procedure (eg, sensor-head relationship) between imaging sessions. Conversely, current source strength, Q, is a modeled quantity and therefore highly dependent on the appropriateness and quality of the model. It is also largely insensitive to intersession variations in measurement procedure. As such, evoked field might be preferred for “within” imaging session comparisons and Q might be preferred for comparisons “between” imaging sessions. For both evoked field amplitude and modeled current source strength, interparticipant biological variations might be expected to contribute additionally to determined variability.
Results
In five participants undergoing three examinations, each consisting of four stimulus conditions (60 trials), activation of somatosensory cortex was identified using functional MR imaging in all except two trials (58 of 60 trials). Four additional studies had to be excluded because of excessive, uncorrectable motion artifact. No magnetoencephalography studies failed to produce a measurable “peak” in the required latency range, with a root mean square amplitude (across sensor channels) exceeding the noise floor by a factor of at least 6.
In general, for functional MR imaging, the number of active pixels did not allow delineation of the number of fingers stimulated (Table). Figure 1 presents an example of a functional MR imaging study of a single volunteer, showing the difference in activation pattern resulting from the stimulation of one through four fingers. On the other hand, the magnitude of the neuromagnetic evoked field peak did scale with the extent of cortical activation (Table). Figure 2 shows an example of somatosensory evoked neuromagnetic fields elicited by stimulation of one, two, three, and four digits, respectively, along with corresponding modeled single equivalent current source localizations. The amplitude of the peak of the evoked response seems to increase with the increasing number of stimulated digits. This general finding was observed in all participants. Although single equivalent current dipole modeling has well-documented limitations and might be expected to be inappropriate in cases of extended neuronal sources, the focus of this study was not on precise localization of activation but rather on quantitative estimates of the cortical area of involvement. The illustration merely serves to identify the source origin as the primary somatosensory cortex.
Statistical Significance of fMRI and MEG Measures of Cortical Extent of Activation

fig 1.

Functional MR imaging for a single participant, single session, as a function of increasing number of stimulated digits. This functional MR imaging study from a single volunteer shows the difference in activation pattern (red pixels) resulting from the stimulation of one through four fingers of the left hand. Overlays are shown on source echo-planar images (2000/69/1 [TR/TE/excitations]; flip angle, 60°); four sections are shown covering the expected primary somatosensory areas. Yellow pixels indicate areas of significant correlation with the stimulus presentation function (r > 0.3), which were deemed not primary contralateral somatosensory cortex by the radiologic reviewers (H.C.R. and H.A.R.). Although this example tends to show an increasing extent of cortical activation in line with expected somatotopic distribution in primary somatosensory cortex, results from other participants were less clearly demonstrative. Furthermore, increases in the number of activated pixels on progression from one to four stimulated fingers are non-monotonic (being especially diminished in response to three-finger stimulation in this example)
fig 2.

Magnetoencephalography waveforms and source localization.
A, Representative magnetoencephalography waveforms for one, two, three, and four digits, for a single participant, single session. Waveforms are shown from the 37 sensor channels, collapsed onto a single horizontal time axis, ranging from 150 ms before stimulation to 150 ms after stimulation, capturing the initial evoked response. The y axis of these plots is a measure of evoked magnetic field amplitude, and all plots are shown to scale (50 fT/vertical division). All have recognizable peaks occurring approximately 30 to 40 ms after stimulus onset (arrow), with subsequent activity that is not the focus of this study. The amplitude of this peak seems to increase, somewhat monotonically, with an increasing number of stimulated digits.
B, Source localization (single equivalent dipole modeling) of this magnetoencephalography-detected peak onto high resolution MR images (SPGR; 38/6/1; flip angle, 35°), to form magnetic source images (MSI) for one-, two-, three-, and four-digit stimulation shows the source estimate (colored point) to lie in the postcentral gyrus, which is expected to contain primary somatosensory representations. The ring surrounding the modeled current source indicates the 95% confidence limit for model/data fit. The 95% confidence volumes (from 3D ellipsoids of confidence) for the example in the figure are 0.17, 0.06, 0.08, and 0.02 cm3, respectively, for one-, two-, three-, and four-digit stimulation.
It is clear from the functional MR imaging measures of cortical activation (Fig 3A) that there is considerable intraparticipant variability and no clear trend for each individual toward an increasing area of activation with an increasing number of stimulated digits. Similar observations were made for the computed quantity amount of activation. Conversely, for the magnetoencephalography data (Fig 3B), clear trends indicating increased activation with an increased number of stimulated digits were observed for every individual participant. Similar findings were observed for the modeled parameter, Q, although intraparticipant variation was greater, especially for one- and two-digit stimulation. Figure 3C shows the lack of correlation between functional MR imaging and magnetoencephalography findings.
fig 3.

Variation of derived measures of the extent of cortical activation with increasing numbers of stimulated digits: intra- and interparticipant.
A, Area of activation derived by functional MR imaging shows considerable intraparticipant variability and no trend toward increasing areas of activation with increasing numbers of stimulated digits, for averaged data for each individual. Measures of cortical activation are shown as a function of increasing numbers of stimulated digits with intraparticipant variability represented by the dispersion of like-colored dots. Mean individual participant trends are shown as solid lines.
B, Evoked field amplitude as determined by magnetoencephalography. Despite overlap in the range of evoked fields elicited by each stimulation type across participants, the data from each individual are relatively clustered for each stimulation type; clear trends indicating increased activation with increased numbers of stimulated digits are seen for every individual participant. Measures of cortical activation are shown as a function of increasing numbers of stimulated digits with intraparticipant variability represented by the dispersion of like-colored dots. Mean individual participant trends are shown as solid lines.
C, There is no evident correlation between functional MR imaging and magnetoencephalographic measures.
Changes in signal intensity (ΔSI) in response to stimulation varied from 2.6 ± 0.7% (one digit stimulated) to 2.9 ± 0.9% (four digits stimulated). This relationship, however, did not approach statistical significance, although it contributed to the tendency toward increased resolution of the number of stimulated digits using the amount of activation versus the number of pixels, because the amount of activation is defined as the product of the number of pixels and the mean ΔSI.
In general, variation in functional MR imaging estimates prohibit the successful use of either the number of pixels (area of activation) or the amount of activation (area × ΔSI) for resolving different degrees of stimulation (number of fingers). For the number of pixels and the amount of activation, only values for one finger versus four fingers were statistically resolved (P < .05). Magnetoencephalography variability was much less marked and both the measured quantity (evoked field magnitude) and the modeled parameter (current source strength) were used to resolve different areas of stimulation. The table shows P values derived from paired t tests for number of pixels (functional MR imaging), amount of activation (functional MR imaging), evoked field amplitude (magnetoencephalography), and current source strength (mag-netoencephalography).
For area of activation, derived from functional MR imaging, we probed more closely the intra-and interparticipant sources of variability. We defined the intraparticipant variability for a particular stimulus condition (eg, one digit stimulated) as the SD in measures of that condition for an individual participant, divided by the mean measure for that condition for an individual participant. Intraparticipant variability ranged from 10% to 141%, with a mean value of 66.0%. Interparticipant variability was defined for each stimulus condition as the SD of each individual participant's mean response, divided by the mean response across participants (mean of the individual participant means). Interparticipant variability ranged from 32% to 116%, with a mean value of 84.6%. In summary, intra- and interparticipant estimates of variability are approximately equal and somewhat large. A similar analysis for the magnetoencephalography-derived measure of the amplitude of the evoked field peak showed considerably reduced intraparticipant variability. The mean intra- and interparticipant variability estimates were 17.6% and 41.1%, respectively. Both were substantially smaller than the corresponding functional MR imaging variability (P < .05 for intraparticipant and P < .1 for interparticipant variability), and, noticeably, intraparticipant (measurement) variability is considerably smaller than interparticipant (biological) variability.
Figure 4 illustrates the correlation between functional MR imaging readers. The correlation between readers is strong (r = 0.93), suggesting that observations and derived conclusions are not sensitive to arbitrary reader bias.
fig 4.
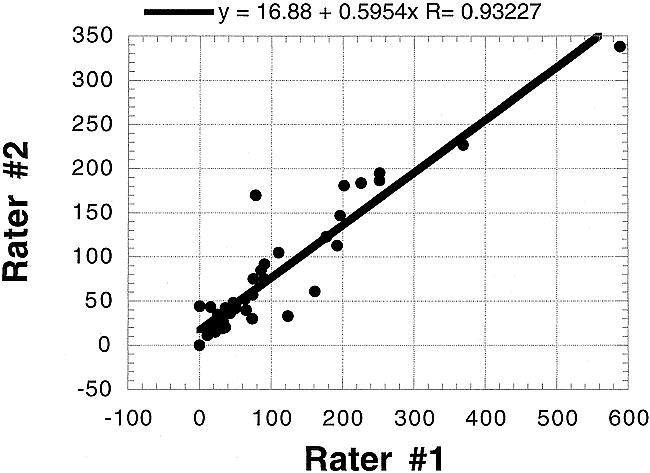
Interrater comparison for functional MR imaging. Despite differing sensitivities to activation identification (the slope of the correlation plot is approximately 0.6), the correlation between readers is strong (r ;eq 0.93), suggesting that observations and derived conclusions are not sensitive to arbitrary reader bias in definition of region of interest
Discussion
We compared two methods, functional MR imaging and magnetoencephalography, for the robust demonstration of increasing cortical areas of activation with increasing areas of somatosensory stimulation. Both methods have been proposed as techniques for functional neuroimaging, but they differ fundamentally in their underlying neurophysiological sensitivities and mechanisms of signal detection and quantification. The goal of this study was to compare the two methods and to investigate the reproducibility of their measures and their sensitivity to changes in the stimulus area. Robust quantitative evaluation of cortical areas of activation is integral to longitudinal experimental and clinical designs targeted at monitoring cortical reorganization, elicited by training, therapy, and rehabilitation, in cases of stroke recovery, focal dystonia, and other disorders of the sensorimotor cortex.
In the clinical setting, both functional MR imaging and magnetoencephalography are useful in the presurgical mapping of sensorimotor cortex (eg, in defining functional brain areas in anatomic context with respect to a mass lesion). Confirmatory studies comparing noninvasive preoperative assessments with intraoperative cortical stimulation have been performed for both functional MR imaging (9) and magnetoencephalography (10, 11) in patients with surgically treated epilepsy and neoplasms. Although spatial localization is not the focus of this study, work comparing the localization of cortical activation measured using functional MR imaging and source-modeled magnetoencephalography of the same participants under identical stimulus conditions has shown congruence between the two methods (17, 22, 23). This congruence emerges despite differences in the underlying neurophysiological findings associated with the two imaging methods and imprecision in the definition of a functional MR imaging focus or in modeling the source of the magnetoencephalogram.
We chose to examine the somatosensory system for two reasons. First, to assess quantification of measures of the extent of cortical activation, it was necessary to vary the extent of cortical activation systematically. We varied the extent of cortical activation by varying the number of digits stimulated. The somatotopic organization of anterior parietal fields 3a, 3b, 1, and 2 has been well documented using electrophysiological recording techniques in humans (24, 25) and in nonhuman primates (26–29). The nonoverlapping finger representations for digits D5, D4, D3, D2, and D1 lie superior to inferior along the postcentral gyrus. The cortical magnification factor (the increased area of cortex devoted to processing sensory inputs from a particular body region), based on the density of innervation of the skin, yields a larger cortical representation for D1 and D2 than for D3 and D4. Therefore, for an increasing number of stimulated digits, it is assumed that an increasing area of cortex will be involved in processing inputs; thus, increasing measures of the extent of cortical activation should be observed using imaging techniques.
Second, functional imaging has been used extensively to examine somatosensory cortex in normal participants and in clinical populations. The cortical resolution of both functional MR imaging (30–32) and source-modeled magnetoencephalography (33–36) methods has been reported as adequate to show somatotopic organization of primary somatosensory cortex in humans. Further, we have recently used functional MR imaging to show somatotopic organization in anesthetized macaque monkey cortex, with subsequent electrophysiological and neuroanatomic confirmation (37, 38).
The primary results of this study are as follows: 1) functional MR imaging and source-localized magnetoencephalography can be used to localize cortical activity in response to somatosensory stimulation of the digits adequately; 2) increasing the number of stimulated fingers, which would be expected to increase the extent of active cortex, did not result in significant increases in areas of activation, as determined by functional MR imaging; however, magnetoencephalographic measures of the cortical extent of activation did vary significantly, allowing discrimination of the number of digits stimulated; 3) intra- and interparticipant variabilities in the area of activation, as determined by functional MR imaging, were both large (approximately 65–85%) and strikingly similar, suggesting that intraparticipant variability may be at least comparable with biological (interparticipant) variation; 4) conversely, for magnetoencephalography, intraparticipant measures had lower variability (approximately 20%), whereas interparticipant variability was greater (approximately 40%), suggesting that biological variations dominate; within participant variability in magnetoencephalographic measures was sufficiently small to allow a clear resolution of the increasing cortical extent of activation with an increase in the number of stimulated fingers.
Although both functional MR imaging and magnetoencephalography can be used to detect and even localize cortical activation associated with somatosensory stimulation, the results of this study indicate that magnetoencephalography offers superior quantifiability in determining the cortical extent of activation. We suggest three explanations, as follows.
Physiological Factors
The magnetoencephalographic measures reflect neuronal electrical activity directly, whereas the block design and the blood oxygenation level–dependent contrast mechanism of functional MR imaging reflect hemodynamic correlates of neuronal activity that may not scale linearly with the number of stimulated fingers and may be sensitive to other physiological (eg, blood pressure, partial pressure of carbon dioxide) and behavioral (eg, attentional state) parameters that could reduce measurement reproducibility.
Temporal Factors
The magnetoencephalography quantification corresponds specifically to a single temporal event, the peak of electrical activity between 30 and 70 ms after stimulus, which is considered to be a primary evoked response that is relatively immune to attentional modulation (39). As such, the confounding impact of other somatosensory components and “background” brain activities is diminished, leaving a measure that is a somewhat pure representation of the stimulus event. The functional MR imaging response essentially averages over all ongoing neuronal activities, some of which may not be reproducible or may not co-vary with the degree of stimulation (number of fingers).
Methodological Factors
The effect-to-noise ratio in functional MR imaging is small compared with the magnetoencephalography signal-to-noise ratio; therefore, measurement precision is degraded. This can be partially ameliorated with appropriate acquisition, averaging strategies, and statistical methods.
Our choice of the quantities used to measure the extent of cortical involvement also had an impact on our ability to discriminate cortical extent. In the functional MR imaging component of this study, we focused on computing the number of pixels defined as activated and on a quantity termed amount of activation, which is the product of the number of activated pixels and the mean signal intensity increase (ΔSI) associated with stimulation, measured across activated pixels. Because ΔSI is remarkably similar across participants and number of stimulated digits, the construction of the quantity (amount of activation) did little to decrease the variability observed in the number of activated pixels. The ΔSI values tended to be slightly lower in response to single digit stimulation (2.6%) than in response to stimulation of multiple digits (2.6–2.9%), although this trend was not statistically significant. The amount of activation quantity might therefore be expected to have slightly better performance in resolving single- from multiple-digit stimulation.
When quantifying the magnetoencephalography signal, two considerations compete. On the one hand, the modeled current dipole source strength, Q, is relatively independent of systematic confounds, such as precise sensor position relative to the head. On the other hand, compared with a measured quantity such as evoked field amplitude, variability is introduced into the quantity, Q, by the very process of mathematical modeling of neuronal activity. When the model and the data are highly consistent, Q tracks with evoked field amplitude and is potentially better suited for intersession comparisons. When the model fails to describe the data adequately, large errors in Q are likely. In practice, system variations (primarily sensor placement) are relatively insignificant (intersession variations in a single participant are comparable with variations observed among repeated measurements within a single recording session). Thus, the measured quantity, evoked field amplitude, provides a reasonably robust basis for estimating neuronal activity. In this study, both Q and evoked field amplitude were of comparable efficacy for resolving different numbers of stimulated digits, although Q tended to fail in cases of low signal-to-noise ratio (eg, in the comparison of one finger versus two fingers), because the modeling process is sensitive to measurement noise. Additionally, because the modeling process invokes an assumption of a single focal source of activity, it might be expected to be less appropriate when used to describe activation arising from the stimulation of multiple digits where an extended cortical area is involved.
We have shown that magnetoencephalography is superior to functional MR imaging not only in quantifying the extent of active cortex but also in the reproducibility of the results. In the present study, interparticipant variations observed by using magnetoencephalography are mostly attributed to biological variations. Examining data pooled across all participants, we observed that although the trend toward increased amplitude of evoked field, detected by magnetoencephalography, with increased number of stimulated digits was pronounced, group overlap between different numbers of stimulated digits seems to preclude their discrimination. However, this overlap was largely attributable to interparticipant variability; that is, within individual participants, increasing evoked field amplitude was clearly observed as the number of stimulated digits was increased. For functional MR imaging, such determinations cannot be made, because intraparticipant variability was almost as great as interparticipant variability. Many of the sources of variability in functional MR imaging are discussed by Genovese et al (40), including systematic, statistical, and biological considerations.
Previous studies on test-retest variability of functional MR imaging tend to show considerable quantitative variation, despite a consensus opinion of “adequacy.” Many of these have focused on the visual system; however, the broad conclusions are nonetheless relevant. For example, Moser et al (41) found intraparticipant fractional SDs in the areas of cortical activation to be 5% to 50% in the majority of their participants (63–88% of participants, depending on the exact correlation threshold approach). Fractional SDs are, however, presumed yet greater in the remaining 12% to 37% of cases. Across participants, biological variation introduces further degradation of reproducibility. Moser et al report no instances of a fractional SD of cortical area across participants less than 41% regardless of analysis strategy used. In the present study, a constant correlation threshold for definition of activation was selected, primarily to reduce “floor” and “ceiling” effects arising with increasing areas of activation. After evaluation using r = 0.2, r = 0.3, and r = 0.5, a value of r = 0.3 was selected for subsequent analysis.
Rombouts et al (42, 43) evaluated both area of activation and overlap of activated pixels during repeated echo-planar functional MR imaging examinations with full-field visual stimulation. Although the reproducibility of an area or volume of activation is good (approximately 88–90%), overlap of pixels is variable (64–74%). Intraparticipant variability in cortical volume of activation was considerably superior to that found in response to our tactile stimulus (approximately 20%); interparticipant variability was approximately 40%. However, the use of full-field stimulation may result in a saturation or ceiling effect in activating visual cortex, such that apparent reproducibility in response to such a strong stimulus is greater, because the upper-bound of possible activation may be providing a limit to variation. Rombouts et al did not speculate regarding either the reproducibility of functional MR imaging in response to more subtle stimuli or regarding the ability of functional MR imaging–defined areas or volumes of activation to resolve differences in the cortical area of activation arising from differences in stimulus type.
Yetkin et al (44) encountered relatively poor overlapping activated pixel distributions on repeated trials (approximately 50% overlap) with both somatosensory stimulation and motor task performance. By reducing the stringency of the “overlap” definition to include activation of neighboring (but not exactly the same) pixels, reproducibility of activation increased to 80%. Yetkin et al did not use a calibrated (and thus more reliably reproducible) stimulus; therefore, it is possible that intersession variations in the specific nature of stimulation/task performance may contribute to observed variation in extent of cortical activation.
Le and Hu (45) use kappa statistics across repeated measures to assess intersession concordance of activated pixels. They noted a moderate improvement in reproducibility with physiological motion correction. Our analysis was less dependent on statistical constructs but rather sought to describe sensitivity to changes in cortical areas of activation. Intra- and interparticipant variability of any measure used to describe an area of cortical activation will necessarily reduce the usefulness of the measure to resolve small differences in the area of activation.
Magnetoencephalography studies of reproducibility largely focus on the problematic issue of source localization (46–48). Although evoked fields have been measured in response to a variety of sensory stimuli, the predominance of reproducibility assessments address the auditory evoked neuromagnetic field and, in particular, the component occurring approximately 100 ms after stimulus onset, the N1m or M100. For example, Pantev et al (48) report tightly clustered source localizations for the M100 component with a SD of less than2 mm. Baumann et al (49) show approximately 20% variation in modeled current dipole source strength, Q, for the N1m component between trials and a larger interparticipant variation (≤50%). These values are comparable with the 20% intraparticipant and 40% interparticipant fractional SDs in the present study. Virtanen et al (50) shows similar 20% variation both across and within sessions for N1m modeled source strength, Q, with less variation in the evoked response amplitude (root mean square across sensor channels) within sessions (approximately 14%), although this increased to more than 20% when computed across sessions, presumably attributable to sensor/system variations.
In an intraparticipant reproducibility study of magnetoencephalography source localizations for somatosensory cortex, Gallen et al (51) noted a 1.02-cm SD for single digit source localization. This relatively large uncertainty contains contributions from intersession variations, habituation, fatigue, and registration to MR imaging. Intrasession SD of source localization was less (6.7 mm). In another important study (34) in which magnetoencephalography was used to record the magnetic field evoked by somatosensory stimulation of each of the five digits separately, two relevant findings were apparent: first, the interparticipant variability in current dipole strength for each source was approximately 45% (defined as the SD divided by the mean), which is directly comparable with the approximately 40% interparticipant variation observed in the magnetoencephalography component of the present study; second, the index finger was associated with the strongest source, which would be consistent with the relatively larger cortical representation of the index finger compared with other digits. This finding was the rationale for our choice of the index finger as the single digit stimulation site. Because other digits (specifically D1, D3, and D4) were associated with comparable source strength in that study, we might expect an approximately linear increase in cortical activation on progressing from one to two to three to four stimulated digits. This was the finding in the present study.
As Bauman et al (49) point out, variability increases with later evoked field components because of attentional variations that modulate evoked responses. We restricted our focus to the early (30–70 ms post stimulus) component of the somatosensory evoked field, which has been repeatedly shown to originate on the postcentral gyrus (10, 11, 18, 19, 51, 52) and is relatively impervious to the effects of attention (39). As also noted by Baumann et al, weaker evoked field components, having poorer signal-to-noise ratios, are likely to be modeled with reduced confidence, leading to greater variability in modeled parameters such as Q for low signal-to-noise situations. We see this in the lack of ability of the modeled current dipole strength, Q, to allow resolution of one versus two fingers, for example, where individual evoked responses are relatively weaker than for larger stimulation areas.
Despite the above-mentioned limitations to functional MR imaging reproducibility and its relative lack of sensitivity to stimulus changes, a potential advantage of functional MR imaging lies in its ability to detect spatially extended or separate foci of activation that present a modeling challenge for magnetoencephalography. Functional MR imaging is ideally suited for delineating multiple areas of cortex involved in complex brain function. Quantification of degrees of such function, however, should be interpreted with some caution (53). The opportunities afforded by quantitative measures of brain function, particularly as assessed in this study by magnetoencephalography estimates of the extent of cortical activation, have extensive application both in the resolution of graded stimuli during a single examination and also in longitudinal studies (eg, during rehabilitation therapy).
Conclusion
Quantitative magnetoencephalography reliably shows increasing cortical area activated by increasing numbers of stimulated fingers. For functional MR imaging in this study, intra- and interparticipant variability precluded resolution of an effect of the extent of stimulation. We conclude that magnetoencephalography is more suited than functional MR imaging to studies requiring quantitative measures of the extent of cortical activation.
Acknowledgments
The authors thank Susanne Honma, RT, Jeff Walker, BS, and Gary Ciciriello, RT, for excellent technical assistance, Prof. William P. Dillon and Dr. Gary Abrams for helpful discussion, and Nicole Gage, Kelly Huffman, Dianna Kahn, and Prof. Leah Krubitzer for review of the manuscript.
Footnotes
This work was supported by a grant (to T.P.L.R.) from the University of California Academic Senate Committee on Research.
Address reprint requests to Timothy P.L. Roberts, PhD, Box 0628, Radiology, University of California, San Francisco, 513 Parnassus Avenue, San Francisco, CA 94143.
References
- 1.Fox PT, Burton H, Raichle ME. Mapping human somatosensory cortex with positron emission tomography. J Neurosurg 1987;67:34-43 [DOI] [PubMed] [Google Scholar]
- 2.Sereno MI, Dale AM, Reppas JB, et al. Borders of multiple visual areas in humans revealed by functional magnetic resonance imaging. Science 1995;268:889-893 [DOI] [PubMed] [Google Scholar]
- 3.Disbrow EA, Roberts TPL, Krubitzer LA. Somatotopic organization of cortical fields in the lateral sulcus of Homo sapiens: evidence for SII and PV. J Comp Neurol 2000;418:1-21 [DOI] [PubMed] [Google Scholar]
- 4.Stern CE, Corkin S, Gonzalez RG, et al. The hippocampal formation participates in novel picture encoding: evidence from functional magnetic resonance imaging. Proc Natl Acad Sci USA 1996;93:8660-8665 [DOI] [PMC free article] [PubMed] [Google Scholar]
- 5.O'Craven KM, Rosen BR, Kwong KK, Treisman A, Savoy RL. Voluntary attention modulates fMRI activity in human MT-MST. Neuron 1997;18:591-598 [DOI] [PubMed] [Google Scholar]
- 6.Clark VP, Maisog JM, Haxby JV. fMRI study of face perception and memory using random stimulus sequences. J Neurophysiol 1998;79:3257-3265 [DOI] [PubMed] [Google Scholar]
- 7.Neville HJ, Bavelier D, Corina D, et al. Cerebral organization for language in deaf and hearing subjects: biological constraints and effects of experience. Proc Natl Acad Sci USA 1998;95:922-929 [DOI] [PMC free article] [PubMed] [Google Scholar]
- 8.Binder JR, Rao SM, Hammeke TA, et al. Lateralized human brain language systems demonstrated by task subtraction functional magnetic resonance imaging. Arch Neurol 1995;52:593-601 [DOI] [PubMed] [Google Scholar]
- 9.Jack CR Jr, Thompson RM, Butts RK, et al. Sensory motor cortex: correlation of presurgical mapping with functional MR imaging and invasive cortical mapping. Radiology 1994;190:85-92 [DOI] [PubMed] [Google Scholar]
- 10.Sobel DF, Gallen CC, Schwartz BJ, et al. Locating the central sulcus: comparison of MR anatomic and magnetoencephalographic functional methods. AJNR Am J Neuroradiol 1993;14:915-925 [PMC free article] [PubMed] [Google Scholar]
- 11.Roberts TPL, Zusman E, McDermott M, Barbaro N, Rowley HA. Correlation of functional magnetic source imaging with intraoperative cortical stimulation in neurosurgical patients. J Image Guid Surg 1995;1:339-347 [DOI] [PubMed] [Google Scholar]
- 12.Kwong KK, Belliveau JW, Chesler DA, et al. Dynamic magnetic resonance imaging of human brain activity during primary sensory stimulation. Proc Natl Acad Sci USA 1992;89:5675-5679 [DOI] [PMC free article] [PubMed] [Google Scholar]
- 13.Kwong KK. Functional magnetic resonance imaging with echo planar imaging. Magn Reson Q 1995;11:1-20 [PubMed] [Google Scholar]
- 14.Roberts TPL, Poeppel D. Latency of auditory evoked M100 as a function of tone frequency. Neuroreport 1996;7:1138-1140 [DOI] [PubMed] [Google Scholar]
- 15.Woods RP, Cherry SR, Mazziotta JC. Rapid automated algorithm for aligning and reslicing PET images. J Comput Assist Tomogr 1992;16:620-633 [DOI] [PubMed] [Google Scholar]
- 16.Strupp JP. STIMULATE: a GUI based fMRI software analysis package. Neuroimage 1996;3:S660 [Google Scholar]
- 17.Roberts TPL, Rowley HA. Mapping of the sensorimotor cortex: functional MR and magnetic source imaging. AJNR Am J Neuroradiol 1997;18:871-880 [PMC free article] [PubMed] [Google Scholar]
- 18.Roberts TPL, Rowley HA. Magnetic source imaging as a tool for presurgical functional brain mapping. Neurosurg Clin N Am 1997;8:421-438 [PubMed] [Google Scholar]
- 19.Gallen CC, Sobel DF, Waltz T, et al. Noninvasive presurgical neuromagnetic mapping of somatosensory cortex. Neurosurgery 1993;33:260-268 [PubMed] [Google Scholar]
- 20.Knowlton RC, Laxer KD, Aminoff MJ, Roberts TPL, Wong STC, Rowley HA. Magnetoencephalography in partial epilepsy: clinical yield and localization accuracy. Ann Neurol 1997;42:622-631 [DOI] [PubMed] [Google Scholar]
- 21.Baron R, Baron Y, Disbrow E, Roberts TP. Brain processing of capsaicin-induced secondary hyperalgesia: a functional MRI study. Neurology 1999;53:548-557 [DOI] [PubMed] [Google Scholar]
- 22.George JS, Aine CJ, Mosher JC, et al. Mapping function in the human brain with magnetoencephalography, anatomical magnetic resonance imaging, and functional magnetic resonance imaging. J Clin Neurophysiol 1995;12:406-431 [DOI] [PubMed] [Google Scholar]
- 23.Beisteiner R, Gomiscek G, Erdler M, Teichtmeister C, Moser E, Deecke L. Comparing localization of conventional functional magnetic resonance imaging and magnetoencephalography. Eur J Neurosci 1995;7:1121-1124 [DOI] [PubMed] [Google Scholar]
- 24.Penfield W, Bouldrey E. Somatic motor and sensory representation in the cerebral cortex of man as studied by electrical stimulation. Brain 1937;60:389-443 [Google Scholar]
- 25.Sutherling WW, Levesque MF, Baumgartner C. Cortical sensory representation of the human hand. Neurology 1992;42:1020-1028 [DOI] [PubMed] [Google Scholar]
- 26.Pons TP, Garraghty PE, Cusick CG, Kaas JH. The somatotopic organization of area 2 in macaque monkeys. J Comp Neurol 1985;241:445-466 [DOI] [PubMed] [Google Scholar]
- 27.Nelson RJ, Sur M, Felleman DJ, Kaas JH. Representations of the body surface in postcentral parietal cortex of Macaca fascicularis. J Comp Neurol 1980;192:611-643 [DOI] [PubMed] [Google Scholar]
- 28.Merzenich MM, Kaas JH, Sur M, Lin CS. Double representation of the body surface within cytoarchitectonic areas 3b and 1 in “SI” in the owl monkey (Aotus trivirgatus). J Comp Neurol 1978;181:41-73 [DOI] [PubMed] [Google Scholar]
- 29.Kaas JH, Pons TP. The somatosensory system of primates. Comp Primate Biol 1988;4:421-468 [Google Scholar]
- 30.Sakai K, Watanabe E, Onodera Y, et al. Functional mapping of the human somatosensory cortex with echo-planar MRI. Magn Reson Med 1995;33:736-743 [DOI] [PubMed] [Google Scholar]
- 31.Gelnar PA, Krauss BR, Szeverenyi NM, Apkarian AV. Fingertip representation in the human somatosensory cortex: an fMRI study. Neuroimage 1998;7:261-283 [DOI] [PubMed] [Google Scholar]
- 32.Yetkin FZ, Papke RA, Mark LP, Daniels DL, Mueller WM, Haughton VM. Location of the sensorimotor cortex: functional and conventional MR compared. AJNR Am J Neuroradiol 1995;16:2109-2113 [PMC free article] [PubMed] [Google Scholar]
- 33.Yang TT, Gallen CC, Schwartz BJ, Bloom FE. Noninvasive somatosensory homunculus mapping in humans by using a large-array biomagnetometer. Proc Natl Acad Sci USA 1993;90:3098-3102 [DOI] [PMC free article] [PubMed] [Google Scholar]
- 34.Hari R, Karhu J, Hamalainen M, et al. Functional organization of the human first and second somatosensory cortices: a neuromagnetic study. Eur J Neurosci 1993;5:724-734 [DOI] [PubMed] [Google Scholar]
- 35.Nakamura A, Yamada T, Goto A, et al. Somatosensory homunculus as drawn by MEG. Neuroimage 1998;7:377-386 [DOI] [PubMed] [Google Scholar]
- 36.Suk J, Ribary U, Cappell J, Yamamoto T, Llinas R. Anatomical localization revealed by MEG recordings of the human somatosensory system. Electroencephalogr Clin Neurophysiol 1991;78:185-196 [DOI] [PubMed] [Google Scholar]
- 37.Disbrow E, Roberts TPL, Slutsky D, Krubitzer L. The use of fMRI for determining the topographic organization of cortical fields in human and non-human primates. Brain Res 1999;829:167-173 [DOI] [PubMed] [Google Scholar]
- 38.Disbrow E, Roberts TPL, Slutsky D, Krubitzer L. Presented at the Annual Meeting of the Society for Neuroscience, Miami Beach 1999;
- 39.Mangun GR. Neural mechanisms of visual selective attention. Psychophysiology 1995;32:4-18 [DOI] [PubMed] [Google Scholar]
- 40.Genovese CR, Noll DC, Eddy WF. Estimating test-retest reliability in functional MR imaging. I: Statistical methodology. Magn Reson Med 1997;38:497-507 [DOI] [PubMed] [Google Scholar]
- 41.Moser E, Teichtmeister C, Diemling M. Reproducibility and postprocessing of gradient-echo functional MRI to improve localization of brain activity in the human visual cortex. Magn Reson Imaging 1996;14:567-579 [DOI] [PubMed] [Google Scholar]
- 42.Rombouts SA, Barkhof F, Hoogenraad FG, Sprenger M, Valk J, Scheltens P. Test-retest analysis with functional MR of the activated area in the human visual cortex. AJNR Am J Neuroradiol 1997;18:1317-1322 [PMC free article] [PubMed] [Google Scholar]
- 43.Rombouts SA, Barkhof F, Hoogenraad FG, Sprenger M, Scheltens P. Within-subject reproducibility of visual activation patterns with functional magnetic resonance imaging using multislice echo planar imaging. Magn Reson Imaging 1998;16:105-113 [DOI] [PubMed] [Google Scholar]
- 44.Yetkin FZ, McAuliffe TL, Cox R, Haughton VM. Test-retest precision of functional MR in sensory and motor task activation. AJNR Am J Neuroradiol 1996;17:95-98 [PMC free article] [PubMed] [Google Scholar]
- 45.Le TH, Hu X. Methods for assessing accuracy and reliability in functional MRI. NMR Biomed 1997;10:160-164 [DOI] [PubMed] [Google Scholar]
- 46.Gallen CC, Schwartz B, Rieke K, et al. Intrasubject reliability and validity of somatosensory source localization using a large array biomagnetometer. Electroencephalogr Clin Neurophysiol 1994;90:145-156 [DOI] [PubMed] [Google Scholar]
- 47.Teale P, Goldstein L, Reite M, et al. Reproducibility of MEG auditory evoked field source localizations in normal human subjects using a seven-channel gradiometer. IEEE Trans Biomed Eng 1996;43:967-969 [DOI] [PubMed] [Google Scholar]
- 48.Pantev C, Gallen C, Hampson S, Buchanan S, Sobel D. Reproducibility and validity of neuromagnetic source localization using a large array biomagnetometer. Am J EEG Technol 1991;31:83-101 [Google Scholar]
- 49.Baumann SB, Rogers RL, Papanicolaou AC, Saydjari CL. Intersession replicability of dipole parameters from three components of the auditory evoked magnetic field. Brain Topogr 1990;3:311-319 [DOI] [PubMed] [Google Scholar]
- 50.Virtanen J, Ahveninen J, Ilmoniemi RJ, Näätänen R, Pekkonen E. Replicability of MEG and EEG measures of the auditory N1/N1m-response. Electroencephalogr Clin Neurophysiol 1998;108:291-298 [DOI] [PubMed] [Google Scholar]
- 51.Gallen CC, Schwartz B, Rieke K, et al. Intrasubject reliability and validity of somatosensory source localization using a large array biomagnetometer. Eletcroencephalogr Clin Neurophysiol 1994;90:145-156 [DOI] [PubMed] [Google Scholar]
- 52.Nakasato N, Seki K, Kawamura T, et al. Cortical mapping using an MRI-linked whole head MEG system and presurgical decision making. Electroencephalogr Clin Neurophysiol Suppl 1996;47:333-341 [PubMed] [Google Scholar]
- 53.Dillon WP, Roberts TPL. Limitations of fMRI: a caveat. AJNR Am J Neuroradiol 1999;20:536. [PMC free article] [PubMed] [Google Scholar]