Abstract
BACKGROUND AND PURPOSE: Voxel-based morphometry (VBM), used for detecting brain atrophy, permits comparison of local gray matter concentration at every voxel in an image between two groups. We sought to delineate the specific patterns of cerebral gray matter loss with regard to onset of Alzheimer’s disease (AD) by using MR imaging and VBM and to evaluate the diagnostic performance of VBM with Z score images.
METHODS: Two groups of 30 patients with mild AD of different ages of onset were examined. Mean ages in the early- and late-onset groups were 60.2 ± 5.2 and 71.5 ± 2.6 years, respectively. Control subjects were aged-matched healthy volunteers. Regions of gray matter loss in early- and late-onset AD were examined with VBM. Diagnostic performance of Z score images obtained with the VBM method was evaluated in patients and control subjects by calculating the area under the receiver operating characteristic curve (Az).
RESULTS: Both AD groups had significantly reduced gray matter in the bilateral medial temporal regions. In addition, the early-onset group had more severe gray matter loss in the bilateral parietal and posterior cingulate cortices and precuneus region. No difference was noted in diagnostic performance of Z score images between the early- (Az = 0.9435) and late-onset (Az = 0.9018) groups.
CONCLUSION: Differences were noted in the patterns of regional gray matter loss in patients with early-onset AD versus those with late-onset AD. Parietotemporal and posterior cingulate gray matter loss was found in early-onset AD but not in late-onset AD. Z score images obtained with VBM had a great diagnostic performance for mild AD and can be applied for detecting mild AD in clinical examinations.
The classification of Alzheimer’s disease (AD) into subtypes based on the time of onset of symptoms is still controversial (1, 2). Clinically, patients with early-onset AD have greater degrees of other cognitive dysfunction and a rapid progression of cognitive deficits rather than memory disturbance in the early stage of the disease, whereas those with late-onset AD have a greater degree of memory disturbance. Histopathologic studies demonstrate the different pathologic changes in these two subtypes (3), and 2-[fluorine-18] fluoro-2-deoxy-d-glucose positron emission tomographic studies show metabolic differences between the two subtypes, indicating that the parietotemporal and posterior cingulate hypometabolic dysfunction in the early-onset type is much greater than that in the late-onset type (4–8). In structural imaging studies, such as CT and MR imaging, structural differences between the two subtypes have not been well investigated. This may be because it is difficult to measure and investigate regional atrophy in the brain by using only MR imaging or CT. Recently, voxel-based morphometry (VBM) of T1-weighted MR images has been used to investigate gray matter concentration in some diseases. VBM is a new technique for detecting brain atrophy that permits the comparison of local gray matter concentration at every voxel in an image between two groups of subjects (9). Some authors have reported on AD abnormalities by using this method (10, 11); however, they did not compare early-onset with late-onset AD. We investigated whether cerebral gray matter loss is different between early- and late-onset AD by using the VBM method with MR images and assessed the clinical diagnostic performance of the VBM method for mild AD.
Methods
Subjects
Thirty subjects in each AD subgroup (early or late onset) composed the statistical analysis set and a prototypic template set; 20 additional subjects in each AD subgroup composed a receiver operating characteristic (ROC) test set. Before the examination, written informed consent was obtained from all the patients and/or their relatives and from all the volunteer subjects. The study protocol was approved by our institution’s Ethical Committee.
Patients.
We selected two groups of 30 patients with mild AD in whom the onset of dementia was before (early onset) or after (late onset) the age of 65 years, according to the criteria of the National Institute of Neurologic and Communicative Disorders and Stroke/Alzheimer’s Disease and Related Disorders Association (NINCDS/ADRDA) (12) (Table 1, first group). The Mini-Mental State Examination (MMSE) scores (13) of the patients with early-onset AD and those with late-onset AD were matched.
TABLE 1:
Characteristics of patients with AD and healthy control subjects
| Group | Sex (F:M) | Age (y)* | MMSE Score* |
|---|---|---|---|
| First | |||
| Early-onset AD | 22:8 | 60.2 ± 5.2 | 23.0 ± 2.1 |
| Younger controls | 20:10 | 59.6 ± 3.8 | 29.9 ± 0.3 |
| Late-onset AD | 22:8 | 71.5 ± 2.6 | 22.3 ± 1.8 |
| Older controls | 20:10 | 71.4 ± 3.5 | 29.4 ± 0.9 |
| Second | |||
| Early-onset AD | 14:6 | 60.8 ± 4.6 | 23.5 ± 1.9 |
| Younger controls | 17:3 | 59.1 ± 2.7 | 29.8 ± 0.5 |
| Late-onset AD | 17:3 | 72.2 ± 3.2 | 23.4 ± 2.0 |
| Older controls | 11:9 | 70.3 ± 4.2 | 29.5 ± 0.8 |
Data are mean ± SD.
In addition, another two groups consisting of 20 patients with early-onset AD and 20 patients with late-onset AD were recruited for diagnostic evaluation with use of the VBM method (Table 1, second group). Both patient groups fulfilled the criteria of the NINCDS/ADRDA for probable AD (12).
All patients underwent examination by neuropsychologists and psychiatrists, MR imaging, MR angiography of the neck and head, electroencephalography, laboratory tests, and neuropsychologic tests. To determine the age at onset, family members, caregivers, and friends were asked when they first noted any mental or behavioral changes in the patients.
Healthy control subjects.
Two groups of healthy age-matched volunteer subjects were selected for each group of patients with AD (Table 1, first group). Also, another two groups of healthy volunteers were selected for the two subtypes of AD for diagnostic evaluation with use of the VBM method (Table 1, second group). The control subjects showed no clinical evidence of cognitive deficits or neurologic disease and were not taking short- or long-term drug therapy at the time of the imaging examinations. They had no abnormal findings on MR images, disregarding age-related atrophy and white matter change on T2-weighted images.
MR Imaging Procedures
The MR imager was a 1.5-T Signa Horizon (GE Medical Systems, Milwaukee, WI). Sagittal, coronal, and axial T1-weighted spin-echo (SE) images (550/15/2 [TR/TE/NEX], 5-mm thickness, 2.5-mm gap) and axial T2-weighted fast SE images (3000/21,105/2) were obtained for diagnosis. Then, coronal 3D spoiled gradient-echo (SPGR) imaging (14/3/2, 20° flip angle, 220-mm field of view, 256 × 256 matrix, 124 × 1.5-mm contiguous sections) was performed for VBM analysis.
Data Analysis
Statistical parametric mapping (SPM) 99 software (Wellcome Department of Cognitive Neurology, London, United Kingdom) was installed on a Windows computer. Calculations and image matrix manipulations were performed in MATLAB 5.3 (MathWorks Inc., Natick, MA). For VBM analysis with SPM 99, all the coronal SPGR MR imaging data sets were reconstructed to axial data sets and then converted to ANALYZE format and displayed with the right hemisphere on the right.
Anatomic normalization and statistical processing were performed with SPM 99 software. All the individual MR images were transformed into a standard stereotactic anatomic space, and then the images were automatically segmented by using a cluster analysis technique (9). This process partitioned the images into gray matter, white matter, and CSF by using a modified mixture model cluster analysis technique with a correction for image intensity nonuniformity. The image sets were smoothed with an isotropic Gaussian filter (12-mm full-width at half-maximum), and individual global gray matter densities were normalized by proportional scaling.
Correlation between aging and gray matter loss in healthy subjects.
First, we examined the correlation between the regional gray matter density and aging in the control group by using the SPM statistical technique.
Regional gray matter loss in the early- versus late-onset AD groups.
Next, the regional gray matter densities in the early-onset group versus that in the younger control group and in the late-onset group versus that in the older control group were compared. Then, for comparing the early-onset, EO, and late-onset, LO, groups directly, we used the following SPM contrast, which means a set of subjects for comparison and a statistical design in the SPM statistics, for group comparison to remove the aging effect (8):
(EO − younger control) − (LO − older control), (contrast 1 −1 −1 1).
(LO − older control) − (EO − younger control), (contrast −1 1 1 −1).
Significance was accepted if the voxels survived a Bonferroni-corrected threshold of P < .05 or an uncorrected threshold of P < .001.
Diagnostic value in the early- versus late-onset AD groups.
For evaluation of diagnostic utility, Z score map inspections were performed (14). The following process was performed with free software, Easy Z Score Imaging System (eZIS; Daiichi Radioisotope Laboratory, Tokyo, Japan). Each prototypic early-onset AD and late-onset AD template map was obtained from the first comparison between each AD subtype and the age-matched control subjects in the first group in this study, which indicated the area where the gray matter density was significantly reduced in each early-onset AD and late-onset AD map at the threshold of P = .001. Two normal databases were constructed by averaging, on a voxel-by-voxel basis, the image sets of each of the first 30 healthy subjects for the younger and older control groups.
Next, Z scores were calculated for each voxel of each subject in the second group by using the two normal databases: Z score = [(normal mean) − (individual value)] / (normal SD). The subset of pixels exceeding a threshold of Z > 2.0 for each individual was displayed on the prototypic template and used as a Z score map image. Then, Z score map images of the subjects in the second group were classified as follows: no pixels over Z score 2 on the significant area of the prototypic template: definite normal, 1; clusters consisting of more than 2 pixels (4 × 2 mm) of maximum Z score 2.0–2.5 existed on the significant area of prototypic template: probable normal, 2; Z score 2.6–3.0: indeterminate, 3; Z score 3.1–4.0: probable AD, 4; and Z score over 4.1: definite AD, 5.
We performed ROC analysis, and the area under the ROC curve (Az) values and their standard errors (SE) were calculated by using ROCKIT software 0.9B (Metz CE, Department of Radiology, University of Chicago, IL).
Results
Correlation Between Aging and Gray Matter Loss in Healthy Subjects
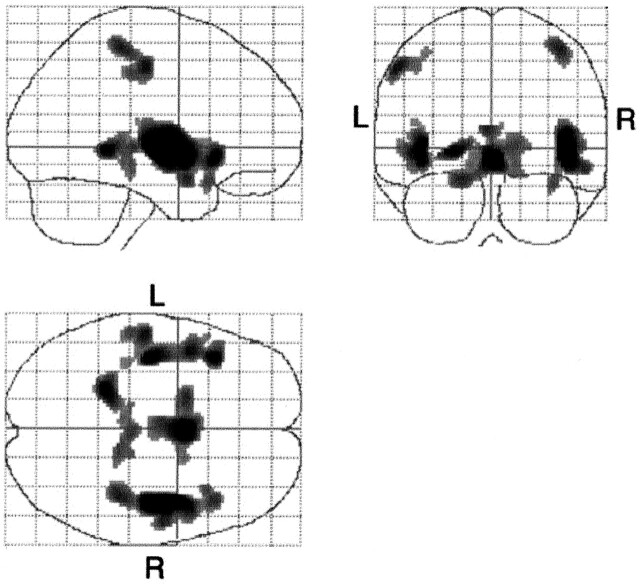
Gray matter densities in the bilateral perisylvian cortices, parahippocampal gyri, and pre- and postcentral gyri were significantly and negatively correlated with age in the healthy control group (P < .05, corrected) (Fig 1, Table 2). No positive correlation was noted between gray matter density and age.
Fig 1.
Statistical parametric maps show specific pixels that indicate a negative correlation between aging and gray matter loss in healthy subjects. The gray matter loss in the hypothalamic region, perisylvian cortices, parahippocampal gyri, and pre- and postcentral gyri are significantly and negatively correlated with age (P < .05, corrected). L indicates left; R, right.
TABLE 2:
Locaiton of greatest gray matter reduction in healthy control subjects in relation to age
| Location | Z Value | x | y | z |
|---|---|---|---|---|
| Right perisylvian cortices | 7.12 | 40 | −13 | −3 |
| Right hypothalamus | 6.19 | 3 | 1 | −6 |
| Left perisylvian cortices | 6.06 | −34 | −19 | −1 |
| Left parahippocampal gyrus | 5.77 | −19 | −44 | −4 |
| Left postcentral gyrus | 5.47 | −47 | −23 | 41 |
| Right postcentral gyrus | 5.41 | 36 | −36 | 49 |
Regional Gray Matter Loss in Early- versus Late-Onset AD Groups
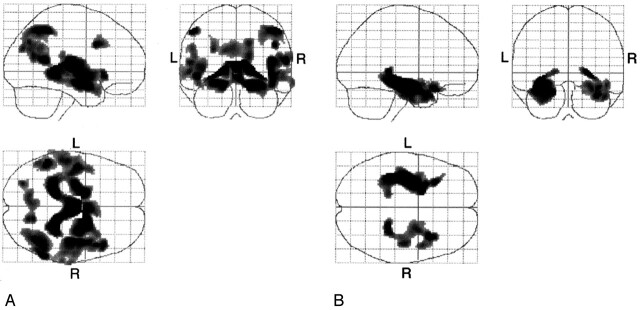
Figure 2 shows the specific voxels that had significantly more gray matter loss in each group of patients with AD compared with the age-matched control subjects (P < .001, uncorrected). Regions of significant atrophy seen in both groups were located in the bilateral medial temporal lobes. The differences between the late-onset group and its age-matched control subjects were not as great as the differences between the early-onset group and its age-matched control subjects. In addition, in the early-onset group, the bilateral inferior parietal lobules, precuneus, perisylvian cortices, and basal forebrain region, and the right inferior frontal gyrus gray matter densities were significantly decreased compared with those of the younger control group (Table 3).
Fig 2.
A, Statistical parametric maps show comparison of patients with early-onset AD with age-matched healthy volunteers (the younger control subjects). Highlighted areas are regions of significant gray matter loss in the patients with early-onset AD compared with age-matched control subjects at a threshold of P < .001, uncorrected. Bilateral medial temporal lobes, inferior parietal lobules, precuneus, and perisylvian cortices and the right inferior frontal gyrus and bilateral cingulate cortex are highlighted. L indicates left; R, right.
B, Statistical parametric maps show comparison of patients with late-onset AD and age-matched healthy volunteers (the older control subjects). Highlighted areas are regions of significant gray matter loss in patients with late-onset AD compared with age-matched control subjects at a threshold of P < .001, uncorrected. Bilateral medial temporal cortices are highlighted. L indicates left; R, right.
TABLE 3:
Location of the greatest gray matter reduction in the cluster regions of significant gray matter density reduction in early-onset and late-onset AD groups compared with age-, sex-, and severity-matched control subjects
| Group and Location | Z Value | x | y | z |
|---|---|---|---|---|
| YHC > EO | ||||
| Right parahippocampal gyrus | 5.79 | 17 | −36 | 0 |
| Left inferior parietal lobule | 5.06 | −45 | −50 | 41 |
| Right inferior parietal lobule | 4.77 | 38 | −62 | 41 |
| Left operculum | 4.72 | −41 | −13 | −6 |
| Right inferior frontal gyrus | 4.50 | 41 | 8 | 30 |
| Right precuneus | 4.25 | 15 | −65 | 14 |
| Left inferior parietal lobule | 3.96 | −47 | −58 | 23 |
| OHC > LO | ||||
| Left hippocampus | 5.13 | −26 | −7 | −16 |
| Right hippocampus | 4.35 | 25 | −38 | −4 |
Note.—YHC indicates younger healthy controls; EO, early-onset AD; OHC, older healthy controls; LO, late-onset AD. Threshold is P < .001, uncorrected.
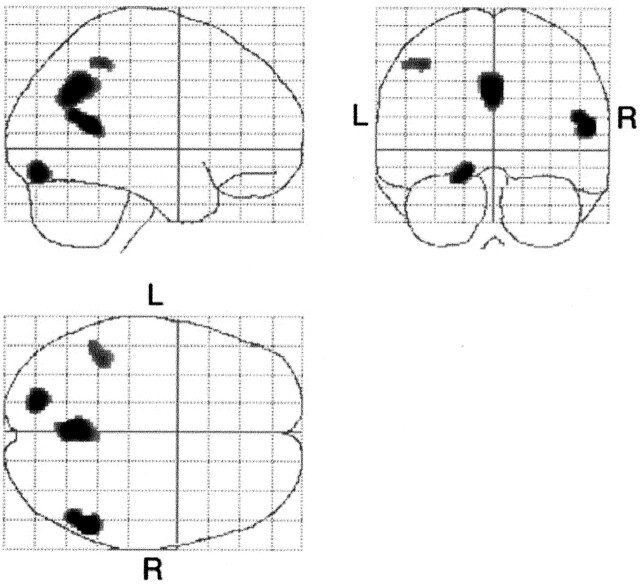
Between the two AD groups, the gray matter densities in the bilateral precuneus, left parietal cortices, right middle temporal gyrus, and left fusiform gyrus were lower in the early-onset group than in the late-onset group (Fig 3, Table 4). The late-onset group did not show significantly decreased gray matter density compared with that in the early-onset group at the threshold of P < .001, uncorrected.
Fig 3.
Statistical parametric maps show comparison of patients with early-onset AD and those with late-onset AD. Highlighted areas are regions of significant decreased density in patients with early-onset AD compared with those with late-onset AD at a threshold of P < .001, uncorrected. The gray matter densities in the bilateral precuneus, left parietal cortex, right middle temporal gyrus, and left fusiform gyrus were lower in the early-onset group than in the late-onset group. L indicates left; R, right.
TABLE 4:
Coordinates of regions of statistically signifiacnt decrease in gray matter density in the early-onset AD group compared with the late-onset AD group
| Group and Location | Z Value | x | y | z |
|---|---|---|---|---|
| LO > EO | ||||
| Right middle temporal gyrus | 4.28 | 48 | −54 | 9 |
| Left precuneus | 3.88 | −1 | −62 | 28 |
| Left fusiform gyrus | 2.85 | −15 | −81 | −17 |
| Left inferior parietal lobule | 3.55 | −36 | −46 | 41 |
Note.—LO indicates late-onset AD; EO, early-onset AD. P < .001, uncorrected.
Diagnostic Value in the Early- versus Late-Onset Groups
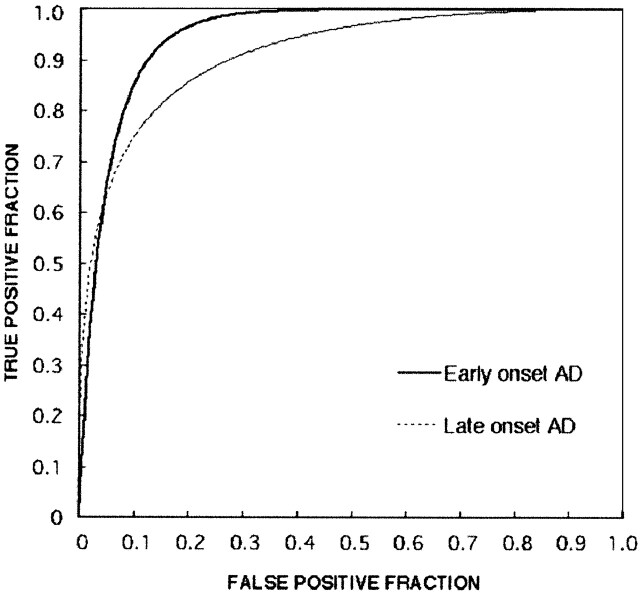
Figure 4 shows the ROC curves and SE of the Z map image evaluation. The Az value in the early-onset AD group was 0.9435 and that of the late-onset AD group was 0.9018; no significant difference was noted between the Az values of the two groups (P = .270). Estimates of expected operating points on the fitted ROC curve, with lower and upper bounds of asymmetric 95% confidence interval along the curve, yielded a sensitivity of 85.0% and a specificity of 90.3% for the early-onset group and a sensitivity of 84.4% and a specificity of 80.2% for the late-onset group.
Fig 4.
ROC curves for patients with AD versus healthy subjects in the younger and older groups. Note the great differences in diagnostic performance between the younger and older groups. The Az value (0.94359) for early-onset AD was larger than that for late-onset AD (Az = 0.9018). True-positive fraction indicates sensitivity; false-positive fraction, 1 − specificity.
Representative Cases
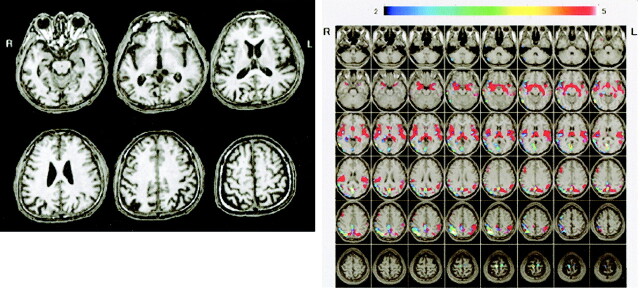
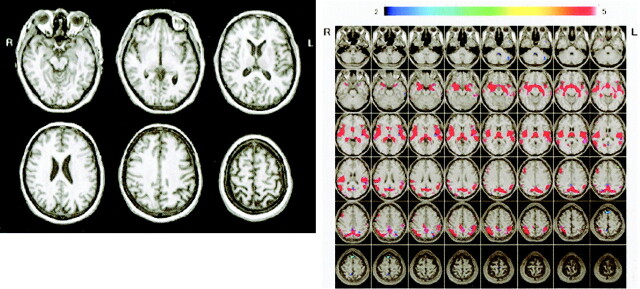
Figure 5 shows conventional MR images and Z score images in a 54-year-old patient with early-onset AD (MMSE score = 23). Mild parietal lobular atrophy can be detected by visual inspection of the conventional T1-weighted image (Fig 5A) compared with that of a 57-year-old healthy control subject (MMSE score = 30) (Fig 6A). By using the Z score map, it is easy to detect the region and degree of atrophy in this early-onset AD case (Fig 5B) and to see that there is no significant region in the healthy subject (Fig 6B).
Fig 5.
A and B, Conventional MR images (A) and Z score images (B) obtained in a 54-year-old patient with early-onset AD (MMSE score = 23). Mild right parietal lobular atrophy can be detected by visual inspection of the conventional T1-weighted images; however, the degree of atrophy was not estimated. By using the Z score map, the region and degree of atrophy can be detected easily, enabling this case to be diagnosed as AD. Areas with Z scores greater than 2 (indicated by rainbow color scale) in this subject were overlaid on the prototypic early-onset AD template map (overlaid on normal MR images with red area). L indicates left; R, right.
Fig 6.
A and B, Conventional MR images (A) and Z score images (B) obtained in a 57-year-old healthy subject (MMSE score = 30). No atrophy is apparent on the MR images, and there are no areas with Z score greater than 2 overlaid on the prototypic early-onset AD template map. L indicates left; R, right.
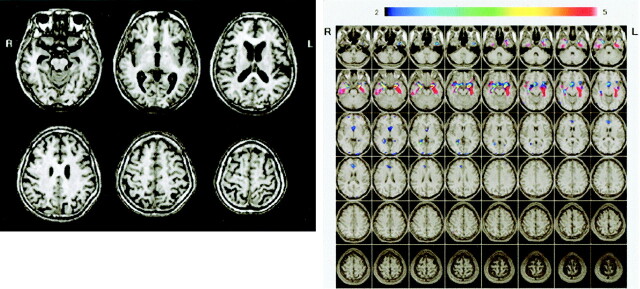
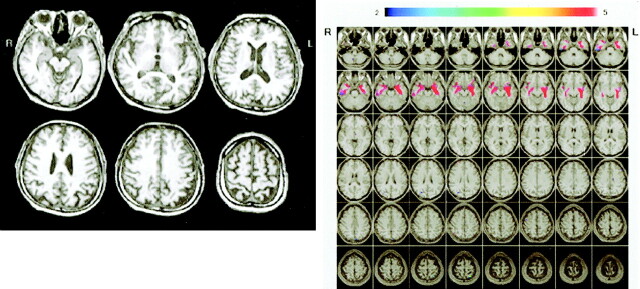
Figure 7 shows conventional MR images and Z score images in a 73-year-old patient with late-onset AD (MMSE score = 23). Medial temporal atrophy can be detected by visual inspection of the conventional T1-weighted image (Fig 7A). By using the Z score map, it is easy to detect the region and degree of atrophy and to see that the left hippocampal atrophy is stronger than the right (Fig 7B). Conventional MR images (Fig 8A) in a 73-year-old healthy control subject (MMSE score = 30) shows no hippocampal atrophy but the left parietal lobe seems to be atrophied, whereas the Z score map shows no significant atrophy in the parietal lobe (Fig 8B).
Fig 7.
A and B, Conventional MR images (A) and Z score images (B) obtained in a 73-year-old patient with late-onset AD (MMSE score = 23). Medial temporal atrophy can be detected by visual inspection of the conventional T1-weighted images. By using the Z score map, the region and degree of atrophy can be detected easily; note that the left hippocampal atrophy is stronger than the right. L indicates left; R, right.
Fig 8.
A and B, Conventional MR images (A) and Z score images (B) in a 73-year-old healthy control subject (MMSE score = 30). The left parietal lobe seems to be atrophied on the conventional T1-weighted images, although the Z score map demonstrates that there is no significantly atrophied area
Discussion
In the present study with use of the MR imaging VBM method, we demonstrated differences in patterns of regional gray matter loss in patients with early- versus those with late-onset AD and the possibility of clinical application of Z score images obtained by using the MR imaging VBM method for diagnosis of AD.
Many studies incorporating structural images like MR images have been used to evaluate neurodegenerative changes in AD (15). Most of them used volumetry of the hippocampal formation, parahippocampal gyri, and entorhinal cortices. However, this kind of study requires detailed tracing of the target structure (e.g., hippocampal formation on each thin-section coronal MR image), which is time-consuming and not practical for routine clinical examinations. Recently, VBM with MR imaging has been used in studies of AD and mild cognitive impairment (MCI). To our knowledge, a VBM study was first applied in normal human brain by Good et al (16). They found that gray matter loss negatively correlated with aging in the bilateral insula, parietal gyri, central sulci, and cingulate sulci. The age range of their subjects, however, was 17–79 years, whereas our study dealt with older subjects aged 53–80 years and showed a similar finding in the correlation between regional gray matter loss and aging. This result indicates that perisylvian fissure, central sulci, and parietal gray matter densities decrease linearly with aging. We also demonstrated the basal forebrain region, which was not demonstrated in the study by Good et al, as the region of age-related gray matter loss. This finding supports the age-related loss of the substantia innominata (17). Baron et al (10) investigated gray matter loss in mild-AD by using VBM and reported that the medial temporal structures, posterior cingulate gyri, and temporoparietal association and perisylvian neocortex were more highly affected compared with those structures in the healthy control subjects. A similar finding was reported in subjects with MCI. Highly significant gray matter loss was found in the hippocampal region and temporal gyri in the MCI group compared with the age-matched healthy subjects (11).
To minimize the effects of age, sex, and cognitive impairment in our study, the patients with AD were divided into two subtypes (early and late onset), with the age and sex well matched between the patients and control subjects, and the cognitive impairment matched between the early- and late-onset AD groups. As previous functional imaging studies have demonstrated, patients with AD show a typical pattern of hypometabolism bilaterally in the parietotemporal cortices, posterior cingulate cortices, and sometimes frontal association cortices, associated with relatively preserved metabolism and blood flow in the visual cortices, the sensorimotor cortices, cerebellum, and subcortical structures (18–20). Small et al (21) and Sakamoto et al (8) found that metabolism in the parietal lobe was lower in their early-onset group than in their late-onset group. Morphologic evaluation in our study also demonstrated that parietal regions were not significantly affected in the gray matter in the late-onset group compared with the age-matched control group. It is well known that the clinical symptoms of patients with early- and those with late-onset AD are different (22). Patients with late-onset AD are more severely impaired in memory and in naming items than are those with early-onset AD. Neuronal loss in the CA zone of the Ammon horn and in the subiculum is greater in patients with late-onset AD than in those with early-onset AD (23). Although healthy control subjects lose 12% of their hippocampal pyramidal neurons between ages 50 and 70 years, patients with AD lose an estimated 57% of their neurons over the same time period (24). The severity of memory impairment in the late-onset subgroup may be related to the relatively severe pathologic changes in these regions. However, our study did not demonstrate significantly greater medial temporal gray matter loss in the late-onset group than in the early-onset group, because the magnitude of medial temporal cortical loss in the late-onset AD group was not significant. Although, when comparing with the age-matched control subjects, the magnitude and expansion of significant gray matter loss was larger in the late-onset group versus the control group than in the early-onset group versus the control group. There was laterality to some of our findings: the right inferior frontal gyrus in early-onset group versus the control subjects; and the left parietal cortex, right angular gyrus, and left fusiform gyrus in the early-onset group versus the late-onset group. Some asymmetry of cortical atrophy and metabolic or perfusional reduction in AD is not rare (25, 26).
The application of VBM for examination of the atrophied brain is still controversial (27, 28). Recently, however, VBM was applied in many studies of AD and related diseases, and reasonable findings were obtained (10, 11, 16, 29–33). In the current study, a structural image combined with a statistical Z score image was first applied to obtain a clinical diagnosis of mild AD. For practical clinical examination, the VBM method requires a relatively short time for obtaining a final statistical map, the Z score image. A combination of a statistical map like our Z score image with the VBM method provides an accurate diagnosis in patients with AD. Diagnosis based on the annual change derived from serial MR images may be superior to the performance of a diagnosis based on a single MR image, although our study demonstrated a good result by using a single MR image.
As our study showed that there were differences in regional cortical gray matter concentration reductions between the early- and late-onset groups, it is better to set up more than two normal age-referenced databases for this kind of VBM method when making a clinical diagnosis of AD. Our structural analysis enabled accurate detection of mild AD, indicating that the VBM method coupled with Z score images can be applied as a clinical tool for diagnosing AD.
In almost all imaging studies of dementia, including this study, imaging findings are compared with clinically known cases of AD. In such a study, it is impossible for the imaging study to be more sensitive or specific than the clinical examination. A way to overcome this is by following up the patients over a number of years and establishing at the start of the study the imaging parameters that characterize those patients who go on to develop AD, as demonstrated by De Leon et al (34). This clearly presented study provides a powerful demonstration of the ability of modern image analysis and MR images to characterize dementia and to help diagnose AD. This method of study design should be tested in assessing diagnostic performance with VBM and Z score images in future studies.
Conclusion
We performed a voxel-based analysis of regional gray matter loss in patients with early- versus those with late-onset AD. Our study results support previous pathologic evidence and show that there are differences in the alteration of regional gray matter loss between early- and late-onset AD, suggesting that AD should be classified into these two subtypes. The VBM method with Z sore map can be applied for detecting mild AD in routine MR imaging examinations.
References
- 1.Seltzer B, Sherwin I. A comparison of clinical features in early- and late-onset primary degenerative dementia: one entity or two? Arch Neurol 1983;40:143–146 [DOI] [PubMed] [Google Scholar]
- 2.Iversen LL. Differences between early and late-onset Alzheimer’s disease. Neurobiol Aging 1987;8:554–555 [DOI] [PubMed] [Google Scholar]
- 3.Armstrong RA, Nochlin D, Bird TD. Neuropathological heterogeneity in Alzheimer’s disease: a study of 80 cases using principal components analysis. Neuropathology 2000;20:31–37 [DOI] [PubMed] [Google Scholar]
- 4.Mielke R, Herholz K, Grond M, Kessler J, Heiss WD. Differences of regional cerebral glucose metabolism between presenile and senile dementia of Alzheimer type. Neurobiol Aging 1992;13:93–98 [DOI] [PubMed] [Google Scholar]
- 5.Caffarra P, Scaglioni A, Malvezzi L, Previdi P, Spreafico L, Salmaso D. Age at onset and SPECT imaging in Alzheimer’s disease. Dementia 1993;4:342–346 [DOI] [PubMed] [Google Scholar]
- 6.Ichimiya A, Herholz K, Mielke R, Kessler J, Slansky I, Heiss WD. Difference of regional cerebral metabolic pattern between presenile and senile dementia of the Alzheimer type: a factor analytic study. J Neurol Sci 1994;123:11–17 [DOI] [PubMed] [Google Scholar]
- 7.Yasuno F, Imamura T, Hirono N, et al. Age at onset and regional cerebral glucose metabolism in Alzheimer’s disease. Dement Geriatr Cogn Disord 1998;9:63–67 [DOI] [PubMed] [Google Scholar]
- 8.Sakamoto S, Ishii K, Sasaki M, et al. Differences in cerebral metabolic impairment between early and late onset types of Alzheimer’s disease. J Neurol Sci 2002;200:27–32 [DOI] [PubMed] [Google Scholar]
- 9.Ashburner J, Friston KJ. Voxel-based morphometry: the methods. Neuroimage 2000;11:805–821 [DOI] [PubMed] [Google Scholar]
- 10.Baron JC, Chetelat G, Desgranges B, et al. In vivo mapping of gray matter loss with voxel-based morphometry in mild Alzheimer’s disease. Neuroimage 2001;14:298–309 [DOI] [PubMed] [Google Scholar]
- 11.Chetelat G, Desgranges B, De La Sayette V, Viader F, Eustache F, Baron JC. Mapping gray matter loss with voxel-based morphometry in mild cognitive impairment. Neuroreport 2002;13:1939–1943 [DOI] [PubMed] [Google Scholar]
- 12.McKhann G, DrachmanD, Folstein M, Katzman R, Price D, Stadlan EM. Clinical diagnosis of Alzheimer’s disease: report of the NINCDS/ADRDA work group under the auspices of the Department of Health and Human Services task force on Alzheimer’s disease. Neurology 1984;34:939–944 [DOI] [PubMed] [Google Scholar]
- 13.Folstein MF, Folstein SE, McHugh PR. “Mini-mental state”: a practical method for grading the cognitive state of patients for the clinician. J Psychiat Res 1975;12:189–198 [DOI] [PubMed] [Google Scholar]
- 14.Ishii K, Sasaki M, Matsui M, et al. A diagnostic method for suspected Alzheimer’s disease using H215O positron emission tomography perfusion Z score. Neuroradiology 2000;42:787–794 [DOI] [PubMed] [Google Scholar]
- 15.Chetelat G, Baron JC. Early diagnosis of Alzheimer’s disease: contribution of structural neuroimaging. Neuroimage 2003;18:525–541 [DOI] [PubMed] [Google Scholar]
- 16.Good CD, Johnsrude IS, Ashburner J, Henson RN, Friston KJ, Frackowiak RS. A voxel-based morphometric study of aging in 465 normal adult human brains. Neuroimage 2001;14:21–36 [DOI] [PubMed] [Google Scholar]
- 17.Hanyu H, Asano T, Sakurai H, Tanaka Y, Takasaki M, Abe K. MR analysis of the substantia innominata in normal aging, Alzheimer disease, and other types of dementia. AJNR Am J Neuroradiol 2002;23:27–32 [PMC free article] [PubMed] [Google Scholar]
- 18.Kuhl DE. Imaging local brain function with positron emission tomography. Radiology 1984;150:625–631 [DOI] [PubMed] [Google Scholar]
- 19.Minoshima S, Foster NL, Kuhl DE. Posterior cingulate cortex in Alzheimer’s disease (letter). Lancet 1994;344:895. [DOI] [PubMed] [Google Scholar]
- 20.Ishii K, Sasaki M, Yamaji S, Sakamoto S, Kitagaki H, Mori E. Demonstration of decreased posterior cingulate perfusion in mild Alzheimer’s disease by means of H215O positron emission tomography. Eur J Nucl Med 1997;24:670–673 [DOI] [PubMed] [Google Scholar]
- 21.Small GW, Kuhl DE, Riege WH, et al. Cerebral glucose metabolic patterns in Alzheimer’s disease: effect of gender and age at dementia onset. Arch Gen Psychiatry 1989;46:527–532 [DOI] [PubMed] [Google Scholar]
- 22.Jacobs D, Sano M, Marder K, et al. Age at onset of Alzheimer’s disease: relation to pattern of cognitive dysfunction and rate of decline. Neurology 1994;44:1215–1220 [DOI] [PubMed] [Google Scholar]
- 23.Coleman PD, Flood DG. Neuron number and dendritic extent in normal aging and Alzheimer’s disease. Neurobiol Aging 1987;8:521–545 [DOI] [PubMed] [Google Scholar]
- 24.Ball MJ. Neuronal loss, neurofibrillary tangles and granulovascular degeneration in the hippocampus with ageing and dementia: a quantitative study. Acta Neuropathol 1977;37:111–118 [DOI] [PubMed] [Google Scholar]
- 25.Thompson PM, Mega MS, Woods RP, et al. Cortical change in Alzheimer’s disease detected with a disease-specific population-based brain atlas. Cereb Cortex 2001;11:1–16 [DOI] [PubMed] [Google Scholar]
- 26.Ohnishi T, Hoshi H, Nagamachi S, et al. Regional cerebral blood flow study with 123I-IMP in patients with degenerative dementia. AJNR Am J Neuroradiol 1991;12:513–520 [PMC free article] [PubMed] [Google Scholar]
- 27.Bookstein FL. “Voxel-based morphometry” should not be used with imperfectly registered images. Neuroimage 2001;14:1454–1462 [DOI] [PubMed] [Google Scholar]
- 28.Ashburner J, Friston KJ. Why voxel-based morphometry should be used. Neuroimage 2001;14:1238–1243 [DOI] [PubMed] [Google Scholar]
- 29.Good CD, Scahill RI, Fox NC, et al. Automatic differentiation of anatomical patterns in the human brain: validation with studies of degenerative dementias. Neuroimage 2002;17:29–46 [DOI] [PubMed] [Google Scholar]
- 30.Frisoni GB, Testa C, Zorzan A, et al. Detection of gray matter loss in mild Alzheimer’s disease with voxel based morphometry. J Neurol Neurosurg Psychiatry 2002;73:657–664 [DOI] [PMC free article] [PubMed] [Google Scholar]
- 31.Boxer AL, Rankin KP, Miller BL, et al. Cinguloparietal atrophy distinguishes Alzheimer disease from semantic dementia. Arch Neurol 2003;60:949–956 [DOI] [PubMed] [Google Scholar]
- 32.Karas GB, Burton EJ, Rombouts SA, et al. A comprehensive study of gray matter loss in patients with Alzheimer’s disease using optimized voxel-based morphometry. Neuroimage 2003;18:895–907 [DOI] [PubMed] [Google Scholar]
- 33.Busatto GF, Garrido GE, Almeida OP, et al. A voxel-based morphometry study of temporal lobe gray matter reductions in Alzheimer’s disease. Neurobiol Aging 2003;24:221–231 [DOI] [PubMed] [Google Scholar]
- 34.De Leon MJ, Golomb J, George AE, et al. The radiologic prediction of Alzheimer disease: the atrophic hippocampal formation. AJNR Am J Neuroradiol 1993;14:897–906 [PMC free article] [PubMed] [Google Scholar]


