

Abstract
BACKGROUND AND PURPOSE: The ability to quantify, or to determine magnitude, is an important part of number processing, and the extent to which language and other cognitive abilities are involved with number processing is an area of interest. We compared activation patterns, reaction times, and accuracy as subjects determined stimulus magnitude by ordering letters, numbers, and shapes. A second goal was to define the brain regions involved in the distance effect (the farther apart numbers are, the faster subjects are at judging which number is larger) and whether this effect depended on stimulus type.
METHODS: Functional MR images were acquired in 19 healthy subjects. The order task required the subjects to judge whether three stimuli were in order according to their position in the alphabet (letters), position in the number line (numbers), or size (shapes). In the control (identify task), subjects judged whether one of the three stimuli was a particular letter, number, or shape. Each stimulus type was divided into near trials (quantity difference of three or less) and far trials (quantity difference of at least five) to assess the distance effect.
RESULTS: Subjects were less accurate and slower with letters than with numbers and shapes. A distance effect was present with shapes and numbers, as subjects ordered the near trials slower than far trials. No distance effect was detected with letters. The occipital lobes and intraparietal sulci were active with all three stimuli. Shapes required no additional areas, although analysis of the distance effect revealed that near shapes involved other brain regions, including the frontal lobes. Letters activated a large network comprising the frontal lobes, the anterior cingulate gyrus, and basal ganglia, but few additional areas were engaged by the distance effect. Numbers involved a smaller network including the inferior and middle frontal gyri. The left supramarginal gyrus and both inferior frontal gyri were active in the distance effect with numbers.
CONCLUSION: Numbers and letters, which are stimuli more associated with abstract symbolism compared with shapes, resulted in slower reaction times and an increased number of active brain regions. Shapes and numbers, but not letters, elicited a distance effect, indicating access to a mental continuum of quantity. The left supramarginal gyrus and both inferior frontal gyri were involved in the distance effect with numbers. The intraparietal sulci were important in determining stimulus magnitude for all stimuli.
Humans rely on skills, which are probably innate, that enable us to perform simple tasks like judging which of two numbers is larger, or determining the number or size of a few dots on a display screen (1, 2). This ability to quantify, or to determine magnitude, is an important part of number processing. If a stimulus has discrete elements, one way to quantify it is to determine its numerosity, which is the number of countable elements in a stimulus. If a stimulus has more of a continuous quality, quantifying it might involve determining duration, amount, or size, all of which are aspects of the stimulus that are less amenable to being counted discreetly.
When viewing numbers, it is believed that we form a mental continuum of small to large numbers, which in many societies is oriented left to right (2, 3). The mental continuum does not appear to be linear. There is more space allocated to smaller numbers, meaning that large numbers are compressed into a smaller mental space. For example, subjects can determine quickly the numerosity of a stimulus containing up to three or four elements, a process termed subitizing (4–6). As the number of elements increases, however, subjects become slower and less accurate. In studies of patients with brain injury and in studies of brain function, the parietal lobes are implicated as regions where we form this mental continuum of numbers that is used in comparing numbers or performing approximate calculations (7–21).
Important behavioral observations related to the mental continuum of numbers include the distance effect and the magnitude effect (22, 23), both of which have been replicated in adults and even in animals (5, 6, 22–29). The distance effect refers to the fact that subjects are faster at determining which of two numbers is larger if the numbers are farther apart, rather than closer together, on the number line. Subjects are faster at comparing the numbers “1” and “9” than they are at comparing the numbers “2” and “3.” Since close numbers are represented at adjacent locations on a mental continuum that is not always precise, it is easier to confuse them. The magnitude effect describes how the performance of subjects decreases when comparing a pair of large numbers as opposed to a pair of small numbers, although both pairs of numbers are equal distances apart. Subjects are faster when comparing the numbers “2” and “3” than when comparing the numbers “8” and “9.” Large numbers occupy a smaller part of the mental continuum than do small numbers, so subjects presumably have fewer resources with which to make quick and accurate judgments.
An area of interest in number processing is the extent to which language and other cognitive abilities are involved with number processing. As children acquire language skills and begin to count verbally, they are better able to generalize counting to larger numbers (30). Bilingual adults perform approximate calculations equally well in both languages but are better with exact calculation of numbers when using their native language (31, 32). These findings indicate that in addition to a magnitude determination based on a mental continuum of quantity, another component of numerical thinking involves a linguistic, or verbal, representation of numbers (32–34). This language-based representation of numbers is especially relevant for calculation, which requires access to semantic facts and which places a larger premium on mental processes like attention, memory, and verbal rehearsal (33, 35–37). When subjects perform exact calculations, there is not only activation in the parietal lobes, regions important for comparison and approximation, but there is also involvement of other brain regions, especially the frontal lobe (31). Other studies using functional imaging and electrophysiologic techniques implicate a number of brain regions that are involved during calculation, including the parietal lobe, frontal lobe, occipitotemporal regions, and the basal ganglia (16, 18–20, 38–44)
The approach we took to study the interaction of number processing with language and other mental operations was to have subjects order small sets of letters, numbers, and shapes according to their position on the number line, alphabet, or size. Each stimulus type was divided further into near and far groups. Ordering requires subjects to assign a magnitude to stimuli and then make a comparison. We wanted to determine whether letters, which are oriented left to right in the English alphabet similar to integers on the number line, trigger a judgment of quantity like the almost automatic judgment humans make on small sets of numbers. We hypothesized that if the alphabet has an aspect of quantity encoded in a mental continuum that is processed like numbers, we would expect reaction times with letters to resemble reaction times with numbers. We also would anticipate a distance effect with letters and numbers, and functional MR imaging should reveal comparable activation patterns. If, however, the ordering of letters has little or no direct access to a mental continuum of quantity, then subjects must rely on brain regions involved with verbal rehearsal, memory, and attention. Reaction times should be slower compared with those for numbers, and a distance effect might not be seen. Functional MR imaging of letters should reveal a wider network of brain activation compared with that for numbers.
Subjects were also asked to judge whether shape stimuli were in order or not according to stimulus size. Evaluating the size of a simple object was aimed at studying a dimension of quantity that is less amenable to counting but one that still involves a determination of magnitude. When judging shapes, an assignment of quantity is based on a sense of space imparted by the shape. This process is similar to the mental continuum that is involved when comparing numbers (3). A magnitude assessment of shapes might even be a more basic mental process of quantity determination than is the magnitude assessment of Arabic numbers (45). Determining the size of shapes depends primarily on visuospatial skills and is less encumbered by the processing of symbols and language that numbers and letters entail. Memory and attentional demands are also minimal. We hypothesized that reaction times to ordering shapes would be similar to or even faster than reaction times to ordering numbers, and would be subject to a distance effect. Functional MR imaging of shapes should involve fewer brain regions compared with regions engaged by ordering numbers or letters.
Our study had two specific aims. First, we wanted to establish whether or not there was similar behavior (reaction times and accuracy) and comparable brain activation when subjects made a magnitude judgment as they ordered different stimulus types (letters, numbers, and shapes). Second, we aimed to use functional MR imaging to reveal brain regions involved in the distance effect and to determine through imaging and behavior whether there was an interaction of this effect with stimulus type.
Methods
Task
Nineteen healthy, right-handed subjects (11 men and eight women) participated in this study. All subjects had attended college or were in college. Mean subject age was 24 years. Before entering the magnet, we provided the subject a description of the task and a brief orientation to MR imaging. All subjects gave written informed consent. The institutional review board approved this study.
Each imaging run consisted of one stimulus type (letters, numbers, or shapes) and one distance parameter (far or near), resulting in six total imaging runs: far letters, far numbers, far shapes, near letters, near numbers, and near shapes. A run consisted of seven epochs in a block design, with four identify (control) epochs alternating with three order (task) epochs. Each run started and ended with an identify epoch. An epoch lasted 22.5 seconds and consisted of six trials. In each trial, three stimuli (see below) were presented on a projection screen simultaneously for 3000 ms. The words “Identify,” or “Order” were presented for 500 ms before the beginning of each epoch to indicate to the subjects which task to perform. The identify task and the order task had an equal number of trials that were in order and not in order.
In the identify letters task, subjects judged whether the letter “A” was one of the three different letters presented simultaneously. The order letters task required the subjects to judge whether the three different letters were in either ascending or descending order or not in order (eg, “C” “F” “H” or “I” “E” “B” would be yes trials; “G” “H” “A” would be a no trial). The identify numbers task had the subjects decide whether or not the Arabic number “1” was one of the three stimuli presented, which were different positive integers. The order numbers task consisted of three positive integers that were presented simultaneously. The subjects judged whether the numbers were in either ascending or descending order or not in order (eg, “2” “5” “8” or “7” “4” “1” would be yes trials; “6” “3” “9” would be a no trial). For the identify shapes task, the subjects judged whether or not a triangle was one of the three different shapes. The order shapes task required that the subjects determine whether the three shapes were in ascending or descending order or not according to size. The same type of shape stimulus was constant within a particular order shape trial.
The stimulus pool consisted of numbers “1” through “9,” the first nine letters “A” through “I,” and nine shapes that included a square, circle, triangle, pentagon, trapezoid, parallelogram, dodecagon or cross, an arc convex down, and a quarter moon convex to the right. The stimuli for the near trials were chosen so that there was a maximum difference in quantity of less than or equal to three for all stimuli. Stimuli for the far trials had a maximum difference in quantity difference of at least five. This quantity difference was based on the relative position in the alphabet (letters), relative position in the number line (numbers), and relative area (shapes). For example, in a near letter or near number trial, the distance was less than three for any two of the three stimuli. In a far letter or far number trial, the distance between the two stimuli farthest apart was at least five and the difference between the third stimulus and the other two stimuli was at least two. Near shape trials had an area ratio between any two of the three stimuli that was less than or equal to three. Far shape trials had an area ratio between the largest and smallest shapes that was greater than five, and the area of the third shape differed from the areas of the other two shapes by a ratio of at least two. The identify task and the order task had an equal number of trials that were in order and not in order.
For all trials, subjects pressed one button with the right index finger for a yes judgment and the right middle finger for a no judgment, so that each task involved the same decision and motor response. Reaction time and accuracy were measured in each run. A repeated-measures analysis of variance (ANOVA) was performed with reaction time as the dependent variable. A second ANOVA was performed with accuracy as the dependent variable. In each ANOVA, task (identify, order), distance (far, near), and stimulus type (letter, number, shape) were factors. We used paired t tests to test a priori hypotheses that subjects’ mean reaction times would differ on far and near stimuli.
Imaging
Functional MR imaging was performed with a 1.5-T imager (GE Medical Systems, Milwaukee, WI) equipped with resonant gradients (LX system). Subjects lay supine in the magnet with their heads immobilized by a neck support, foam wedges, and a restraining band drawn around the forehead. Scout images in the sagittal plane were acquired with parameters of 500/11 (TR/TE), a field of view of 24 cm, an imaging matrix of 256 × 192, and 5-mm contiguous sections. Ten anatomic images were acquired in an axial-oblique plane parallel to the anterior and posterior commissures, with parameters of 500/11, a field of view of 20 cm, an imaging matrix of 256 × 192, and 8-mm-thick sections with a 1-mm gap. One hundred twenty activation images were collected at each of the same 10 locations by using a single-shot, echo planar, gradient-echo sequence with parameters of 1325/60, a flip angle of 60°, a field of view 20 × 20 cm, an imaging matrix of 64 × 64, and 8-mm-thick sections with a 1-mm gap. Activation images were acquired while the subjects performed the identify and order tasks for letters, numbers, and shapes, described above.
Data analysis
Before statistical analysis, the images from each run were motion corrected for three translation directions and for the three possible rotations (46). No subject exceeded the motion criteria of a translational displacement of 1 mm or a rotational displacement of 1.5°. Nine images at each section location in a run were discarded to account for variation in signal intensity that occurred both at the beginning of an echo planar sequence and from the hemodynamic changes in response to a task transition. The remaining images (111 images per section location per run) were spatially filtered by using a Gaussian filter with a full-width at half-maximum (FWHM) value of 6.5 mm. Using t statistics corrected for linear drift (47), a t value for each voxel was obtained from each run comparing images of the identify epochs with the images of the order epochs. These t test comparisons were used to create activation maps that compared identify and order across the three stimulus types of letters, numbers, and shapes. Both the activation maps and the anatomic images from individual subjects were transformed by in-plane transformation and section interpolation into a normalized three-dimensional grid defined by Talairach and Tournoux (48).
The activation maps from individual subjects were used as a derived measure of task-related activity and were combined on a voxel-by-voxel basis by using t tests and a randomization procedure (see below) to produce none maps. Three of the maps were based on t tests that compared identify and order trials within each of the three stimuli of letters, numbers, and shapes. To determine how the difference between order and identify trials of one stimulus differs from the order and identify difference of another stimulus, three maps were made by using t tests to compare directly the order-identify maps from letters with those from shapes and numbers, respectively, and to compare the order-identify maps from numbers with those from shapes. Finally, three maps were constructed by using t tests to compare the order-identify near trials with the order-identify far trials within each of the three stimuli.
To avoid the need to assume a specific distribution and variance of the data, a randomization procedure was used to estimate P values of the group composite maps (49–51). To randomize, the sign of the activation measure for each voxel, which is the mean t value, was reversed in randomly generated subsets of subjects. The activation measure was then recalculated. This procedure was repeated 20,000 times, generating a distribution of the activation measure. The proportion of times that the observed activation measure was more extreme than a randomized value represents a P value. It is the proportion of times we would expect to obtain a mean activation as large or larger than the one obtained if the null hypothesis (no difference between tasks) were true. The P value for each voxel was overlaid upon the mean anatomic image (a group composite of the T1-weighted images) for display.
Results
A repeated-measures ANOVA of reaction time demonstrated a main effect of task (F1, 18 = 380, P < .0001). The mean reaction time for the order tasks (1167 ms) was significantly slower than the mean reaction time for the identify (control) tasks (724 ms). A main effect of distance (F1, 18 = 13, P = .0019) indicated that mean reaction times differed significantly between far stimuli (921 ms) and near stimuli (970 ms). A main effect of stimulus type (F2, 36 = 130, P < .0001) revealed that mean reaction times differed significantly between letters (1086 ms), numbers (928 ms), and shapes (823 ms). The interaction between task and distance was significant (F1, 18 = 33, P < .0001), with near order tasks (1222 ms) significantly slower than far order tasks (1113 ms). An interaction between distance and stimulus type was significant (F2, 36 = 11, P = .0002), as was the interaction between task and stimulus type (F2, 36 = 217, P < .0001). Paired t tests clarified these interactions. Subjects ordered far numbers (881 ms) significantly faster (P < .0001) than they ordered near numbers (974 ms). Subjects ordered far shapes (795 ms) significantly faster than they ordered near shapes (850 ms). Subjects did not differ significantly (P = .07) in reaction times when ordering far letters (1085 ms) and near letters (1086 ms), or when identifying stimuli (the control task), regardless of the stimulus type (Fig 1).
Fig 1.

Reaction times when subjects identified stimuli (control task) and ordered letters, numbers, and shapes. A distance effect (★, P < .05) was seen with numbers and shapes, as subjects were faster ordering far numbers (OFN) compared with near numbers (ONN), and far shapes (OFS) compared with near shapes (ONS). No statistically significance difference was seen between near letters (ONL) and far letters (OFL). IFL indicates identify far letters; INL, identify near letters; IFN, identify far numbers; INN, identify near numbers; IFS, identify far shapes; INS, identify near shapes.
A repeated-measures ANOVA of accuracy (Fig 2) revealed a main effect of task (F1, 18 = 567, P < .0001). The subjects were more accurate on the identify tasks (mean = 23.7), which was the control task, than on the order tasks (mean = 15). A perfect accuracy score was 24. A significant effect of stimulus type (F2, 36 = 62, P < .0001) indicated that subjects’ accuracy differed with letters, numbers, and shapes. An interaction with task and stimulus type (F2, 36 = 60, P < .0001 revealed that subjects were less accurate at ordering letters (mean accuracy = 12) than at ordering numbers (mean accuracy = 17) or shapes (mean accuracy = 17), respectively. No main effect of distance was seen (F1, 18 = 4, P = .06). The interaction of task by distance or stimulus type by distance was not significant.
Fig 2.

Accuracy of subjects during the identify and order tasks. The identify task (control) resulted in near 100% accuracy irrespective of stimulus type. Subjects were less accurate when ordering letters compared with ordering numbers and shapes. IFL indicates identify far letters; INL, identify near letters; IFN, identify far numbers; INN, identify near numbers; IFS, identify far shapes; INS, identify near shapes; OFL, order far letters; ONL, order near letters; OFN, order far numbers; ONN, order near numbers; OFS, order far shapes; and ONS, order near shapes.
The functional MR imaging results are demonstrated in Figs 3–5. Figure 3 compares brain activation during the order and identify tasks within a stimulus (P = .001). With letters as the stimulus (Fig 3, first column), areas more active in the order task than in the identify task included the anterior cingulate gyrus and the right caudate. Bilateral activation was seen in the middle frontal gyri, the inferior frontal gyri, the precentral gyri, the intraparietal sulci, the superior occipital gyrus, the basal ganglia, the calcarine fissures, the middle occipital gyri, and the insula. Regions more active in the identify task compared with the order task were the left superior frontal gyrus, the right supramarginal gyrus, and the right superior temporal gyrus. Comparing the order and identify tasks with numbers as the stimulus (Fig 3, second column), there was activation in the anterior cingulate gyrus and head of the right caudate nucleus, and bilateral activation of the intraparietal sulcus, the middle and inferior frontal gyri, the precentral gyri, the middle occipital gyri, and the calcarine fissures. The identify task produced activation in the right supramarginal gyrus and angular gyrus, the right superior and middle temporal gyri, and in the superior frontal gyrus. With shapes as the stimulus (Fig 3, third column), brain regions more active in the order task compared with the identify task were the right intraparietal sulcus, the right cuneus, the left superior occipital gyrus, the middle occipital gyri, the calcarine fissures, and the lingual gyri. The left intraparietal sulcus was active at a lower threshold (not shown).
Fig 3.
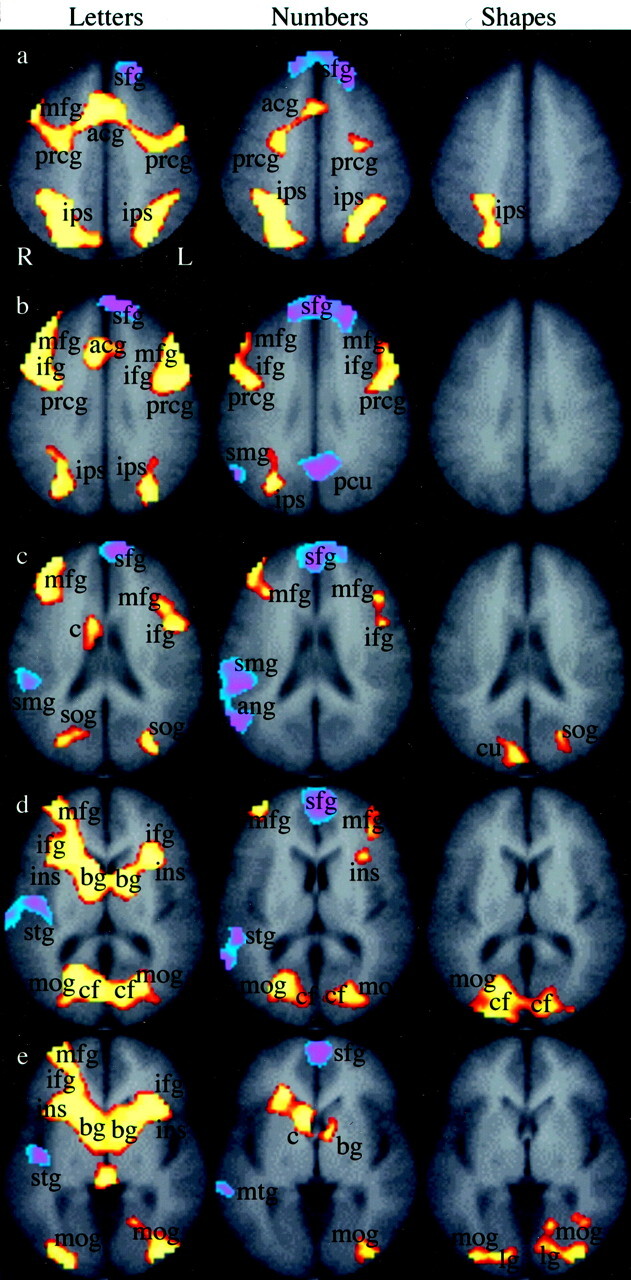
Regional brain activation when subjects judged the order of letters, numbers, or shapes. The images represent group composite activation maps comparing order trials with identify trials within a particular stimulus type. The red-yellow scale indicates brain regions that were more active in the order trials than in the identify trials (P = .001). The blue-purple scale represents brain regions that were active in the identify trials than in the order trials (P = .001). Rows a–e indicate the section position along the z axis of the Talairach atlas system (40, 32, 24, 12, and 4, respectively). The legend for activation is as follows: sfg indicates superior frontal gyrus; acg, anterior cingulate gyrus; mfg, middle frontal gyrus; prcg, precentral gyrus; ips, intraparietal sulcus; ifg, inferior frontal gyrus; pcu, precuneus; smg, supramarginal gyrus; sog, superior occipital gyrus; cu, cuneus; ins, insula; bg, basal ganglia; c, caudate nucleus; stg, superior temporal gyrus; mtg, middle temporal gyrus; cf, calcarine fissure; mog, middle occipital gyrus; lg, lingual gyrus; R, right; L, left.
Fig 5.
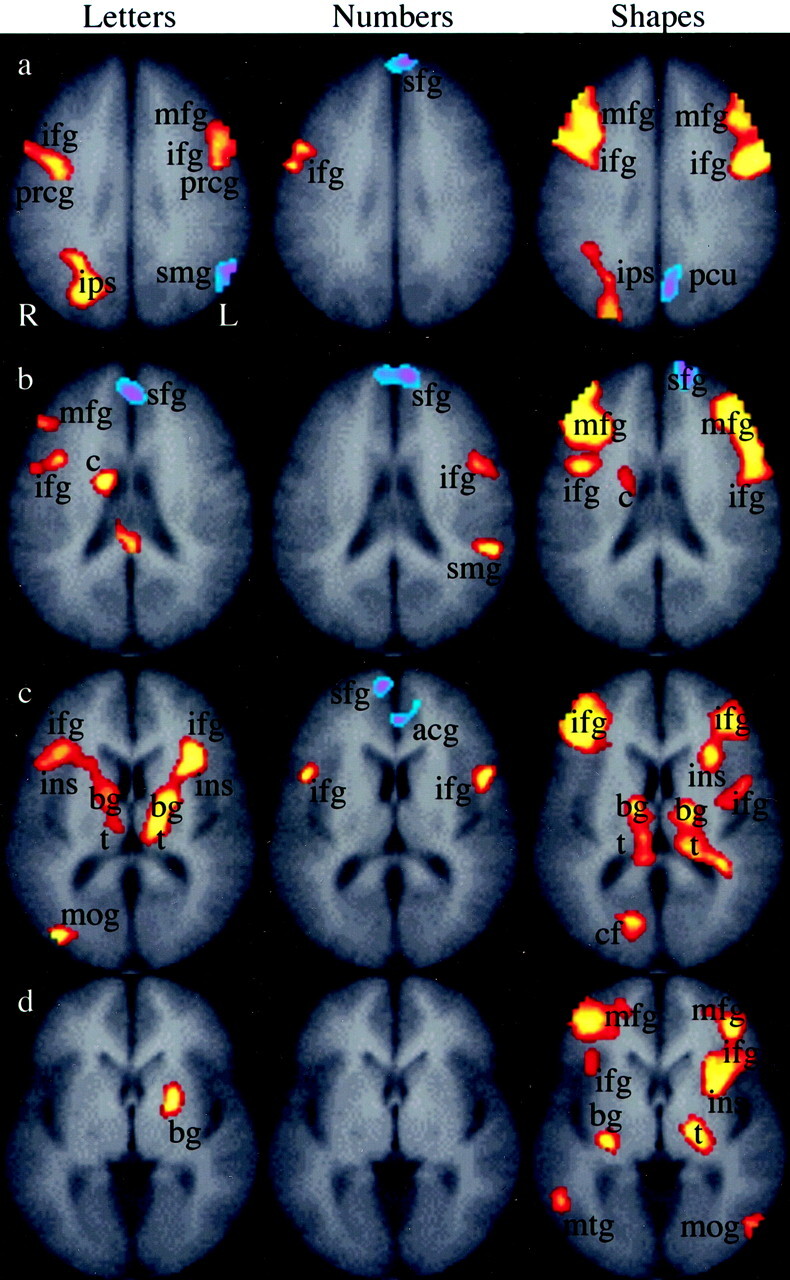
Group composite maps indicate brain activation when the near order trials were compared with the far order trials for letters, numbers, and shapes. The red-yellow scale indicates brain regions that were more active (P = .05) in near trials, and the blue-purple scale represents brain regions that were active (P = .05) in the far trials. Rows a–d indicate the section position along the z axis of the Talairach atlas system (32, 24, 12, and 4, respectively). The legend for activation is as follows: mfg indicates middle frontal gyrus; ifg, inferior frontal gyrus; ips, intraparietal sulcus; sfg, superior frontal gyrus; smg, supramarginal gyrus; pcu, precuneus; c, caudate nucleus; ins, insula; acg, anterior cingulate gyrus; bg, basal ganglia; t, thalamus; cf, calcarine fissure; mog, middle occipital gyrus; mtg, middle temporal gyrus; stg, superior temporal gyrus; R, right; L, left.
Figure 4 compares directly the three stimuli during the order and identify tasks (P = .001), with maps comparing letters with shapes (Fig 4, column 1), letters with numbers (Fig 4, column 2), and numbers with shapes (Fig 4, column 3). This figure is a statistical comparison of the three stimuli. It conveys information about how the difference between order and identify trials differs between each of the stimulus types. Compared with shapes, letters resulted in more activation in the anterior cingulate gyrus, both frontal lobes (middle frontal gyri, inferior frontal gyrus, and the precentral gyri), bilateral insula, and bilateral basal ganglia. There was no difference in activation in the occipital lobes. Shapes activated the left superior frontal gyrus and the right superior temporal gyrus more strongly than did letters. A comparison of letters and numbers (Fig 4, column 2) indicated that letters resulted in activation in the anterior cingulate gyrus and the right middle frontal gyrus. A comparison of numbers and shapes (Fig 4, column 3) showed stronger activation with numbers in the both intraparietal sulci and in the left inferior frontal gyrus, and stronger activation with shapes in the superior frontal gyri.
Fig 4.
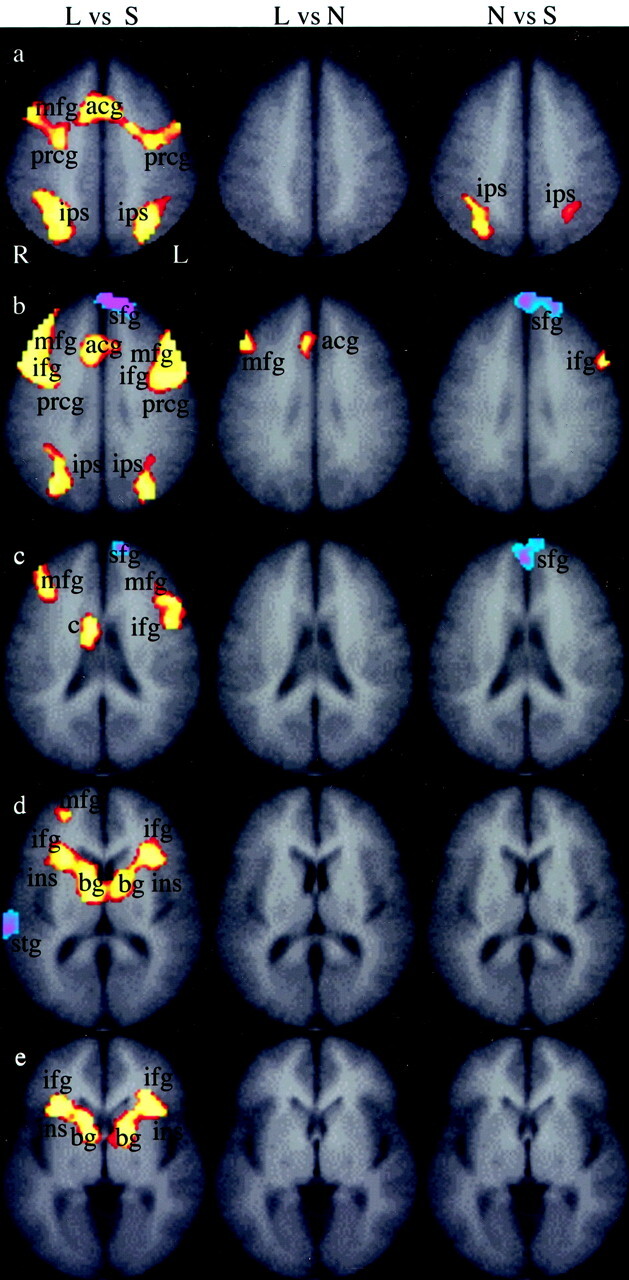
Group composite maps compare the three stimulus types (see Methods). The red-yellow scale indicates brain regions that were more active (P = .001) when letters were compared with shapes (L vs S, column 1), when letters were compared with numbers (L vs N, column 2), or when numbers were compared with shapes (N vs S, column 3). The blue-purple scale represents brain regions that were active (P = .001) when shapes were compared with letters (column 1), when numbers were compared with letters (column 2), or when shapes were compared with numbers (column 3). Rows a–e indicate the section position along the z axis of the Talairach atlas system (40, 32, 24, 12, and 4, respectively). The legend for activation is as follows: mfg indicates middle frontal gyrus; acg, anterior cingulate gyrus; prcg, precentral gyrus; ips, intraparietal sulcus; sfg, superior frontal gyrus; ifg, inferior frontal gyrus; c, caudate nucleus; sog, superior occipital gyrus; ins, insula; bg, basal ganglia; stg, superior temporal gyrus; R, right; L, left.
Brain activation during the distance effect is illustrated in Fig 5 (P = .05), where the near trials were compared with the far trials for letters, numbers, and shapes. Near letters (Fig 5, column 1) activated bilateral middle and inferior frontal gyri, bilateral basal ganglia, bilateral thalami, the right middle occipital gyrus, and the right caudate nucleus. Far letters (Fig 5, column 1) activated the left supramarginal gyrus. The near number trials (Fig 5, column 2) resulted in activation in the left supramarginal gyrus and regions in both inferior frontal gyri. Far number trials (Fig 5, column 2) activated the superior frontal gyrus and the anterior cingulate gyrus. The near shape stimuli (Fig 5, column 3) activated in the middle and inferior frontal gyri bilaterally, the right intraparietal sulcus, the left insula, the right caudate nucleus, the right middle temporal gyrus, the right calcarine fissure region, the left middle occipital gyrus, and regions in both thalami and basal ganglia. Far shapes (Fig 5, column 3) activated the left superior frontal gyrus and the left precuneus. The distance effect depicted in Fig 5 (P = .05) was weaker than the comparisons shown in Figs 3 and 4 (P = .001). Figure 5 was a second-order comparison of the order-identify near trials with the order-identify far trials within a stimulus, and explored a subtle difference between very similar tasks. In contrast, Fig 3 compared order and identify tasks within a stimulus, and Fig 4 compared order and identify tasks across stimuli. Both of these comparisons were between tasks that were more dissimilar than the comparison used for Fig 5 and resulted in maps that allowed a higher threshold.
Discussion
Subjects quickly and accurately determined the magnitude of small sets of numbers and shapes, but were slower and less accurate when ordering letters, suggesting that access to a mental continuum of quantity was more available for shapes and numbers. The magnitude judgment was qualified further by the symbolic nature of the stimulus. A stimulus associated with more abstraction resulted in slower reaction times and an increased number of active brain regions. Shapes carried less symbolic or abstract meaning than did numbers or letters and activated the intraparietal sulci and occipital regions, regions that were active with each stimulus. These regions may represent the basic network for magnitude assessment of a geometric or shape-based stimulus (3, 45). The occipital lobe areas play a role in identifying stimuli and in transmitting them to areas involved in other cognitive processes (52). Activation in the intraparietal sulci confirms electrophysiology and imaging studies indicating the importance of the parietal lobe in number processing (10–21, 31).
As a stimulus was imbued with qualities other than a quantity based on geometry or shape, other brain regions were recruited. Arabic numbers are written symbols used for representing magnitude or quantity and have a more abstract aspect of magnitude than do shapes. Numbers engaged the intraparietal sulci (Fig 3), but there was also activation of both inferior frontal gyri, sites that are used in language and memory tasks. A direct comparison of numbers and shapes (Fig 4) indicated the involvement of both intraparietal sulci and the left inferior frontal gyrus when numbers were ordered. Letters are the link to phonemes and the building blocks for words, which are the symbols used by the language and reading systems. Letters engaged large areas of the brain in the frontal lobe, anterior cingulate, insula, and basal ganglia (Fig 3). Comparing letters with shapes and with numbers (Fig 4) emphasized the importance of the middle and inferior frontal gyri, the anterior cingulate gyrus, and the basal ganglia when subjects ordered letters. When considering all three stimuli, the imaging findings confirmed the importance of the intraparietal sulci when making a magnitude determination, but they also indicated that other brain regions are required when the stimuli move from a basic geometric or space representation (shapes) to a more abstract level used in communication (numbers and letters).
Access to a mental continuum was indicated in part by the distance effect, which was seen with shapes and numbers but not with letters. According to current models, the mental continuum represents quantity in an analog form, but it is not precise, meaning the magnitude representation of one stimulus can interfere with the representation of another (3). If stimuli are farther apart on the continuum, then their magnitude representation can be more easily differentiated. The imaging data provide a functional and anatomic basis for the distance effect. Although shapes and numbers activated the intraparietal sulci (Fig 3), there was differential activation with near and far trials (Fig 5). Near shapes compared with far shapes activated both frontal lobes, possibly indicating that memory or verbal components would be engaged for a more difficult assessment of basic geometric size. Near numbers compared with far numbers underscored the importance of the left supramarginal gyrus and both inferior frontal gyri. In contrast, letters resulted in slower reaction times that were not subject to a definite distance effect. Consonant with the behavioral data, the activation maps of near letters compared with far letters (Fig 5) involved only a few more regions that were active with all letter trials (Fig 3).
There are possible explanations why letters resulted in slower reaction times and only a trend toward the distance effect. Despite letters being ordered left to right and A through Z in the alphabet, a short string of three letters might convey little or no intrinsic aspect of quantity. Alternatively, a mental continuum of quantity could be formed, but the activation patterns suggest that cognitive processes other than a basic magnitude judgment were required. With letters, subjects had to attend closely to the stimuli, retrieve from memory the order of the letters in the alphabet, compare the stimuli with the alphabet, and rehearse the order of the presented stimuli. These mental processes made the magnitude judgment less automatic, as indicated by slower reaction times and less accurate responses. The activation patterns with letters (Fig 3) indicate that the intraparietal sulci were engaged and possibly involved in making a magnitude judgment based on position in the alphabet, but there was also activation in the frontal lobes, anterior cingulated, and basal ganglia. These are sites crucial to encoding stimuli and retrieval of memorized facts, in executive function relevant to attention and decision making, and in the verbal representation (53–62).
Conclusion
Shapes, which are stimuli with an aspect of quantity related to size and are less abstract than numbers or letters, revealed the basic network for assessing a geometric-based quantity. This network consisted of occipital lobes and the intraparietal sulci, especially on the right. For numbers, which are abstract symbols used to represent quantity, the magnitude judgment required the basic network plus frontal lobe sites, primarily the inferior frontal gyri. Both shapes and numbers had access to a mental continuum of quantity, as evidenced by fast, accurate reaction times and the presence of a distance effect. Near shapes compared with far shapes required frontal lobe sites in the inferior and middle frontal gyri and in the insula, basal ganglia, and thalami. Near numbers compared with far numbers engaged both inferior frontal gyri and the left supramarginal gyrus. Letters, which are the abstract symbols used in language and reading, carried a less automatic aspect of quantity despite being ordered in the alphabet in a left to right fashion similar to the ordering of integers. Subjects were slow and inaccurate when ordering letters, and there was no definite distance effect. Letters activated a large network of brain regions in the frontal lobe, anterior cingulate gyrus, insula, and basal ganglia.
References
- 1.Dehaene S, Dehaene-Lambertz G, Cohen L. Abstract representations of numbers in the animal and human brain. Trends Neurosci 1998;21:355–361 [DOI] [PubMed] [Google Scholar]
- 2.Dehaene S. Precis of the number sense. Mind Lang 2001;16:16–36 [Google Scholar]
- 3.Dehaene S. The adult number line. In: The number sense: how the mind creates mathematics. New York: Oxford University Press;1997. :64–90
- 4.Kaufman E, Lord M, Reese T, Volkmann J. The discrimination of visual number. Am J Psychol 1949;62:498–525 [PubMed] [Google Scholar]
- 5.Dehaene S, Cohen L. Dissociable mechanisms of subitizing and counting: neuropsychological evidence from simultanagnosic patients. J Exp Psychol Hum Percept Perform 1994;20:958–975 [DOI] [PubMed] [Google Scholar]
- 6.Mandler G, Shebo BJ. Subitizing: an analysis of its component processes. J Exp Psychol Gen 1982;111:1–22 [DOI] [PubMed] [Google Scholar]
- 7.Gerstmann J. Syndrome of finger agnosia, disorientation for right and left, agraphia and acalculia. Arch Neurol Psychiatry 1940;44:398–408 [Google Scholar]
- 8.Takayama Y, Sugishita M, Akiguchi I, Kimura J. Isolated acalculia due to left parietal lesion. Arch Neurol 1994;51:286–291 [DOI] [PubMed] [Google Scholar]
- 9.Cipolotti L, Butterworth B, Denes G. A specific deficit for numbers in a case of dense acalculia. Brain 1991;114(Pt 6):2619–2637 [DOI] [PubMed] [Google Scholar]
- 10.Rueckert L, Lange N, Partiot A, et al. Visualizing cortical activation during mental calculation with functional MRI. Neuroimage 1995;3:97–103 [DOI] [PubMed] [Google Scholar]
- 11.Dehaene S, Tzourio N, Frak V, et al. Cerebral activations during number multiplication and comparison: a PET study. Neuropsychologia 1996;34:1097–1106 [DOI] [PubMed] [Google Scholar]
- 12.Dehaene S. Electrophysiological evidence for category-specific word processing in the normal human brain. Neuroreport 1995;6:2153–2157 [DOI] [PubMed] [Google Scholar]
- 13.Abdullaev YG, Melnichuk KV. Counting and arithmetic functions of neurons in the human parietal cortex. Second international conference on Functional Mapping of the Human Brain; June 17–21,1996; Boston, MA
- 14.Dehaene S, Cohen L. Cerebral pathways for calculation: double dissociation between rote verbal and quantitative knowledge of arithmetic. Cortex 1997;33:219–250 [DOI] [PubMed] [Google Scholar]
- 15.Kiefer M, Dehaene S. The time course of parietal activation in single-digit multiplication: evidence from event-related potentials. Math Cogn 1997;3:1–30 [Google Scholar]
- 16.Chochon F, Cohen L, van de Moortele PF, Dehaene S. Differential contributions of the left and right inferior parietal lobules to number processing. J Cognitive Neurosci 1999;11:617–630 [DOI] [PubMed] [Google Scholar]
- 17.Pinel P, Le Clec HG, van de Moortele PF, Naccache L, Le Bihan D, Dehaene S. Event-related fMRI analysis of the cerebral circuit for number comparison. Neuroreport 1999;10:1473–1479 [DOI] [PubMed] [Google Scholar]
- 18.Presenti M, Thioux M, Seron X, De Volder A. Neuroanatomical substrates of arabic number processing, numerical comparison, and simple addition: a PET study. J Cognitive Neurosci 2000;12:461–479 [DOI] [PubMed] [Google Scholar]
- 19.Rickard TC, Romero SG, Basso G, Wharton C, Flitman S, Grafman J. The calculating brain: an fMRI study.Neuropsychologia 2000;38:325–335 [DOI] [PubMed] [Google Scholar]
- 20.Stanescu-Cosson R, Pinel P, van de Moortele PF, Bihan DL, Cohen L, Dehaene S. Understanding dissociations in dyscalculia: a brain imaging study of the impact of number size on the cerebral networks for exact and approximate calculation. Brain 2000;123:2240–2255 [DOI] [PubMed] [Google Scholar]
- 21.Cohen L, Dehaene S, Chochon F, Lehericy S, Naccache L. Language and calculation within the parietal lobe: a combined cognitive, anatomical and fMRI study. Neuropsychologia 2000;38:1426–1440 [DOI] [PubMed] [Google Scholar]
- 22.Moyer RS, Landauer TK. Time required for judgements of numerical inequality. Nature 1967;215:1519–1520 [DOI] [PubMed] [Google Scholar]
- 23.Dehaene S, Dupoux E, Mehler J. Is numerical comparison digital? Analogical and symbolic effects in two-digit number comparison. J Exp Psychol Hum Percept Perform 1990;16:626–641 [DOI] [PubMed] [Google Scholar]
- 24.Rilling M, McDiarmid C. Signal detection in fixed-ratio schedules. Science 1965;148:526–527 [DOI] [PubMed] [Google Scholar]
- 25.Gallistel CR, Gelman R. Preverbal and verbal counting and computation. Cognition 1992;44:43–74 [DOI] [PubMed] [Google Scholar]
- 26.Washburn DA, Rumbauch DM. Ordinal judgments of numerical symbols by macaques (Macaca mulatta). Psychol Sci 1991;2:190–193 [DOI] [PubMed] [Google Scholar]
- 27.Buckley PB, Gillman CB. Comparisons of digits and dot patterns. J Exp Psychol 1974;103:1131–1136 [DOI] [PubMed] [Google Scholar]
- 28.van Oeffelen MP, Vos PG. A probabilistic model for the discrimination of visual number. Percerpt Psychophys 1982;32:163–170 [DOI] [PubMed] [Google Scholar]
- 29.Dehaene S. The organization of brain activations in number comparison: event-related potentials and the additive-factors methods. J Cognitive Neurosci 1996;8:47–68 [DOI] [PubMed] [Google Scholar]
- 30.Wynn K. Children’s understanding of counting. Cognition 1990;36:155–193 [DOI] [PubMed] [Google Scholar]
- 31.Dehaene S, Spelke E, Pinel P, Stanescu R, Tsivkin S. Sources of mathematical thinking: behavioral and brain-imaging evidence [see comments]. Science 1999;284:970–974 [DOI] [PubMed] [Google Scholar]
- 32.Spelke ES, Tsivkin S. Language and number: a bilingual training study. Cognition 2001;78:45–88 [DOI] [PubMed] [Google Scholar]
- 33.Dehaene S. Varieties of numerical abilities. Cognition 1992;44:1–42 [DOI] [PubMed] [Google Scholar]
- 34.Dehaene S, Akhavein R. Attention, automaticity, and levels of representation in number processing. J Exp Psychol Learn Mem Cogn 1995;21:314–326 [DOI] [PubMed] [Google Scholar]
- 35.McCloskey M, Caramazza A, Basili A. Cognitive mechanisms in number processing and calculation: evidence from dyscalculia. Brain Cogn 1985;4:171–196 [DOI] [PubMed] [Google Scholar]
- 36.Ashcraft MH. Cognitive arithmetic: review of data and theory. Cognition 1992;44:75–106 [DOI] [PubMed] [Google Scholar]
- 37.Cohen L, Dehaene S, Verstichel P. Number words and number non-words: a case of deep dyslexia extending to Arabic numerals. Brain 1994;117(Pt 2):267–279 [DOI] [PubMed] [Google Scholar]
- 38.Cowell SF, Egan GG, Code C, Harasty J, Watson JDG. The functional neuroanatomy of simple calculation and number repetition: a parametric PET activation study. Neuroimage 2000;12:565–573 [DOI] [PubMed] [Google Scholar]
- 39.Menon V, Rivera SM, White CD, Glover GH, Reiss AL. Dissociating prefrontal and parietal cortex activation during arithmetic processing. Neuroimage 2000;12:357–365 [DOI] [PubMed] [Google Scholar]
- 40.Hayashi N, Ishii K, Kitagaki H, Kazui H. Regional differences in cerebral blood flow during recitation of the multiplication table and actual calculation: a positron emission tomography study. J Neurol Sci 2000;176:102–108 [DOI] [PubMed] [Google Scholar]
- 41.Fulbright RK, Molfese DL, Stevens AA, Skudlarski P, Lacadie CM, Gore JC. Cerebral activation during multiplication: a functional MR imaging study of number processing. AJNR Am J Neuroradiol 2000;21:1048–1054 [PMC free article] [PubMed] [Google Scholar]
- 42.Burbaud P, Camus O, Guehl D, Bioulac B, Caille JM, Allard M. Influence of cognitive strategies on the pattern of cortical activation during mental subtraction: a functional imaging study in human subjects. Neurosci Lett 2000;287:76–80 [DOI] [PubMed] [Google Scholar]
- 43.Le Clec HG, Dehaene S, Cohen L, et al. Distinct cortical areas for names of numbers and body parts independent of language and input modality. Neuroimage 2000;12:381–391 [DOI] [PubMed] [Google Scholar]
- 44.Fink GR, Marshall JC, Gurd J, et al. Deriving numerosity and shape from identical visual displays. Neuroimage 2001;13:46–55 [DOI] [PubMed] [Google Scholar]
- 45.Dehaene S. Author’s response: is number sense a patchwork? Mind Lang 2001;16:89–100 [Google Scholar]
- 46.Friston KJ, Holmes AP, Worsley KJ, Poline JB, Frith CD, Frackowiak RSJ. Statistical parametric maps in functional imaging: a general linear approach. Hum Brain Mapp 1995;2:189–210 [Google Scholar]
- 47.Skudlarski P, Constable RT, Gore JC. ROC analysis of statistical methods used in functional MRI: individual subjects. Neuroimage 1999;9:311–329 [DOI] [PubMed] [Google Scholar]
- 48.Talairach J, Tournoux P. Co-planar stereotaxic atlas of the human brain. New York: Thieme;1988. :1–122
- 49.Hays WL. Statistics. Orlando, FL: Holt, Rinehart & Winston, Inc.;1988. :384–411
- 50.Manly BFJ. Randomization, bootstrap, and Monte Carlo methods in biology (texts in statistical science). London: Chapman & Hall;1997. :399
- 51.Nichols TE, Holmes AP. Nonparameteric permutation tests for functional neuroimaging: a primer with examples. Hum Brain Mapp 2001;15:1–25 [DOI] [PMC free article] [PubMed] [Google Scholar]
- 52.Cohen L, Dehaene S. Number processing in pure alexia: the effect of hemispheric asymmetries and task demands. Neurocase Case Studies Neuropsychol Neuropsychiatry Behav Neurol 1995;1:127–137 [Google Scholar]
- 53.Pugh KR, Shaywitz BA, Shaywitz SE, et al. Cerebral organization of component processes in reading. Brain 1996;119:1221–1238 [DOI] [PubMed] [Google Scholar]
- 54.Pugh KR, Shaywitz BA, Shaywitz SE, et al. Auditory selective attention: an fMRI investigation. Neuroimage 1996;4:159–173 [DOI] [PubMed] [Google Scholar]
- 55.Fiez J, Raife E, Balota D, Schwarz J, Raichle M. A positron emission tomography study of the short-term maintenance of verbal information. J Neurosci 1996;16:808–822 [DOI] [PMC free article] [PubMed] [Google Scholar]
- 56.Cohen JD, Perlstein W, Braver TS, et al. Temporal dynamics of brain activation during a working memory task. Nature 1997;386:604–607 [DOI] [PubMed] [Google Scholar]
- 57.Smith EE, Jonides J, Koeppe RA. Dissociating verbal and spatial working memory using PET. Cereb Cortex 1996;6:11–20 [DOI] [PubMed] [Google Scholar]
- 58.Paulesu E, Frith CD, Frackowiak RJS. The neural correlates of the verbal component of working memory. Nature 1993;362:342–345 [DOI] [PubMed] [Google Scholar]
- 59.Tulving E, Kapur S, Craik F, Moscovitch M, Houle S. Hemispheric encoding/retrieval asymmetry in episodic memory: positron emission tomography findings. Proc Natl Acad Sci USA 1994;91:2016–2020 [DOI] [PMC free article] [PubMed] [Google Scholar]
- 60.Cohen JD, Forman SD, Braver TS, Casey BJ, Servan-Schrieber D, Noll DC. Activation in the prefrontal cortex in a nonspatial working memory task with functional MRI. Hum Brain Mapp 1994;1:293–304 [DOI] [PubMed] [Google Scholar]
- 61.Houk JC, Wise SP. Distributed modular architectures linking basal ganglia, cerebellum and cerebral cortex: their role in planning and controlling action. Cereb Cortex 1995;2:95–110 [DOI] [PubMed] [Google Scholar]
- 62.Hittmair-Delazer M, Semenza C, Denes G. Concepts and facts in calculation. Brain 1994;117:715–728 [DOI] [PubMed] [Google Scholar]