Abstract
BACKGROUND AND PURPOSE: Abnormal flow of CSF through the foramen magnum has been implicated in the pathogenesis of clinical deficits in association with Chiari I malformation. The purpose of this study was to test the hypothesis that peak CSF velocities in the foramen magnum are increased in patients with Chiari I malformations.
METHODS: Eight adult patients with symptomatic Chiari I malformations and 10 adult volunteers were studied with cardiac gated, phase-contrast MR imaging in the axial plane at the foramen magnum. The spatial uniformity of flow velocity in the foramen magnum was assessed at 14 time frames within the R–R interval. The velocity in each of the voxels at each of the time frames was calculated, and the peak systolic and diastolic velocities were tabulated for the patients and controls.
RESULTS: For the normal volunteers, the CSF velocities in the subarachnoid space were relatively uniform throughout the subarachnoid space at each of the time frames. Peak systolic velocity ranged from 1.2 to 3.3 cm/s, and peak diastolic velocity ranged from 1.6 to 4.5 cm/s. In symptomatic patients with Chiari I, velocities in the foramen magnum did not appear as uniform throughout the subarachnoid space in the phase-contrast images. Peak systolic velocities ranged from 1.8 to 4.8 cm/s, and peak diastolic velocities ranged from 2.5 to 5.3 cm/s. Peak systolic velocity was significantly higher (P = .01) in the patients than in the control volunteers.
CONCLUSION: Patients with Chiari I malformations have significant elevations of peak systolic velocity in the CSF in the foramen magnum.
The defining feature of the Chiari I malformation is tonsillar herniation, yet tonsillar herniation alone does not predict a functional deficit. Approximately one third of individuals with tonsillar herniation revealed by MR study are asymptomatic (1). The degree of tonsillar herniation correlates poorly with the severity of signs and symptoms. For example, syrinxes and symptoms may develop in some patients with tonsillar herniation and not in others. Signs and symptoms typical of a Chiari I malformation may occur without evident tonsillar herniation in patients with the so-called Chiari 0 malformation (2). Consequently, much research regarding the Chiari I malformation has been focused on CSF dynamics rather than the anatomic relationships of the tonsils and brain stem.
Investigators, by using phase-contrast MR imaging, have characterized the flow of CSF in the foramen magnum (3–13). In these studies, peak systolic velocity has not been thoroughly investigated. The rationale for measuring peak velocity is based on a consideration of fluid dynamics in the foramen magnum. The volume of fluid (in mL/min) moving through the foramen magnum during each cardiac cycle depends less on the shape and compliance of the foramen magnum than on the change in cerebral blood volume with each cardiac cycle. Velocity of flow through the foramen magnum (in cm/s) depends to a greater degree on the dimensions and shape of the foramen magnum. Any process that restricts flow within the foramen magnum is more likely to increase the velocity of flow than to decrease the volume of flow. Hypothetically, tonsillar herniations, adhesions within the foramen magnum, or other processes that affect the capacity of the foramen magnum may increase peak CSF velocity. Consequently, we hypothesized that within the foramen magnum in symptomatic patients with Chiari I, peak CSF velocities would be increased.
Methods
Participants
Ten normal volunteers and eight symptomatic patients with Chiari I were included in the study (Tables 1 and 2). All normal volunteers claimed to be in good health and denied present or previous spinal or neurologic problems or hypertension. None had claustrophobia or contraindications to MR imaging. Informed consent was obtained from volunteers according to institutional guidelines.
TABLE 1:
Peak systolic and diastolic velocities in the normal control volunteers
| Volunteer No. | Age (yr) | Peak Systolic Velocity | Peak Diastolic Velocity |
|---|---|---|---|
| 1 | 61 | 2.1 | 2.4 |
| 2 | 36 | 1.7 | 2.1 |
| 3 | 28 | 2.0 | 1.6 |
| 4 | 21 | 2.7 | 4.2 |
| 5 | 33 | 2.9 | 1.9 |
| 6 | 48 | 1.2 | 2.1 |
| 7 | 41 | 2.2 | 4.5 |
| 8 | 47 | 2.4 | 2.5 |
| 9 | 46 | 3.3 | 3.5 |
| 10 | 30 | 3.1 | 2.9 |
| Average | 39.1 | 2.36 | 2.77 |
TABLE 2:
Peak systolic and diastolic velocities in the patients
| Patient No. | Tonsillar Herniation (mm) | Age (yr) | Syrinx | Aliasing or Other Artifact | Peak Systolic Velocity | Peak Diastolic Velocity |
|---|---|---|---|---|---|---|
| 1 | 5 | 21 | None | 2.3 | 2.5 | |
| 2 | 5 | 23 | None | 3.7 | 4.5 | |
| 3 | 5 | 28 | Syrinx | 1.9 | 3.8 | |
| 4 | 5 | 29 | None | 1.8 | 2.9 | |
| 5 | 4 | 57 | None | 3.5 | 5.3 | |
| 6 | 9 | 29 | Syrinx | Aliasing | 4.8 | 4.8 |
| 7 | 9 | 19 | Syrinx | Phase artifacts | 3.5 | 3.4 |
| 8 | 11, crowding | 20 | None | Aliasing | 2.8 | 4.6 |
| Average | 28.3 | 3.0 | 4.0 |
A consecutive series of patients evaluated in a neurosurgical specialty clinic between 1999 and 2001 were included in the study. All patients had neurologic symptoms and signs referable to Chiari I malformation (14). All had MR images available, including T1- and T2-weighted sagittal view images of the cervical spine that revealed tonsillar descent into the foramen magnum, consistent with the diagnosis of Chiari I malformation. The images were examined for gross anatomic abnormalities, but detailed measurements of the posterior fossa, such as others have performed (15), were not acquired. Patients with and without syringomyelia were included. Exclusion criteria included contraindication to MR imaging, age less than 18 years, hydrocephalus, hypertension, or previous surgical treatment for spinal abnormality. Each patient in the series underwent a phase-contrast MR imaging study of CSF flow in the foramen magnum, which was reviewed and reported as part of the patient’s imaging studies.
Phase-Contrast MR Imaging
Patients and volunteers underwent imaging with the same 1.5-T imaging unit. Conventional T1- and T2-weighted sagittal view images were acquired of the cervical spine to evaluate for tonsillar ectopia and syringomyelia. Cardiac gated phase-contrast images were acquired of the foramen magnum when the participant had achieved a steady heart rate. A commercially available phase-contrast flow measurement sequence was used: 20/5 (TR/TE); flip angle, 20 degrees; section thickness, 5 mm; field of view, 180 mm; matrix, 256 × 256; encoding velocity, 10 cm/s. Section orientation was axial and perpendicular to the spinal canal, and section location was chosen at the narrowest portion of the foramen magnum (Fig 1) in normal volunteers. For patients in whom tonsillar herniation obscured the CSF in the foramen magnum, the section was positioned at the point below the tonsils in which sufficient CSF was present for visualization of CSF flow. Fourteen image frames were acquired regularly throughout the R–R interval, with the R wave from a chest ECG electrode used for the trigger impulse. The offset velocity, estimated from the velocity of stationary tissue, was used to correct for phase shifts introduced by eddy currents.
Fig 1.
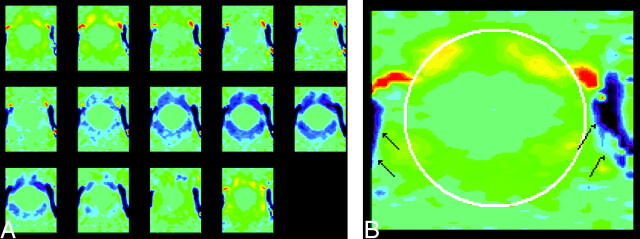
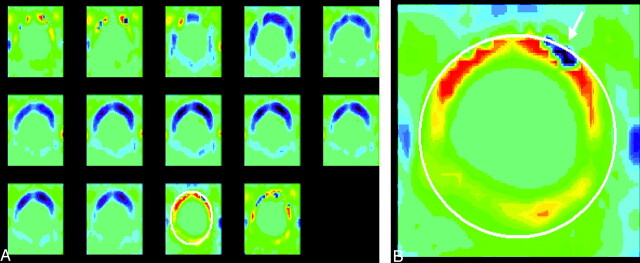
Phase contrast images of the foramen magnum in a normal volunteer. The images are displayed in vbgor color scale, with violet and blue showing flow in the caudad (negative) direction and orange and red showing flow in the craniad (positive) direction. The scale is set to +3 to −3 cm/s. The 14 consecutive images through the cardiac cycle from top left to lower right (A) show fairly uniform flow velocities within the foramen magnum. In one image from the series (B), the subarachnoid space is highlighted by means of an oval placed by an illustrator and the vertebral arteries are designated by arrows.
CSF Velocity Calculation
Flow analysis was conducted with commercially available software resident on the image workstation. The 14 successive images for each time frame of the cardiac cycle were inspected to identify the subarachnoid space and the course of the vertebral arteries. The signal intensity within the subarachnoid space was assessed visually for uniformity or inhomogeneity. The images were inspected for a focus of paradoxical signal intensity change that suggested velocity aliasing. A region of interest was placed to include the entire subarachnoid space (including the spinal cord) and to exclude the vertebral arteries, even if a portion of the subarachnoid space was thereby excluded and some velocities not sampled. The region of interest placement was intended to identify the peak CSF velocities wherever they occurred in the foramen magnum. Because only peak velocities were recorded, the inclusion of the spinal cord did not bias the measurement. The program then calculated the velocity in each voxel in the region of interest for all time frames. It displayed maximum, minimum, and average velocities as a function of time during the cardiac cycle. The time course of the velocity was inspected and compared with the expected shape of the curve. If the time courses failed to show the expected diastolic-systolic-diastolic flow curve, the region of interest was repositioned to eliminate a region of velocity aliasing or possible arterial flow. Typically, velocity measurements were verified by the placement of small regions of interest at multiple locations in the subarachnoid space. The peak systolic and diastolic velocities for the region of interest were recorded. In cases in which velocities did not appear uniform throughout the subarachnoid space or the temporal course for CSF velocity showed a pattern different from the usual bimodal one, the region of interest was replaced with one or more smaller ones. In cases in which the phase-contrast images showed velocity aliasing, the region of interest was placed to exclude that region, resulting in an underestimation of the peak velocity. For each patient and each normal control volunteer, one peak diastolic and systolic velocity was recorded. Differences in velocities were tested with a single tail Student’s t test, with unequal variances assumed and significance set at 0.05.
Results
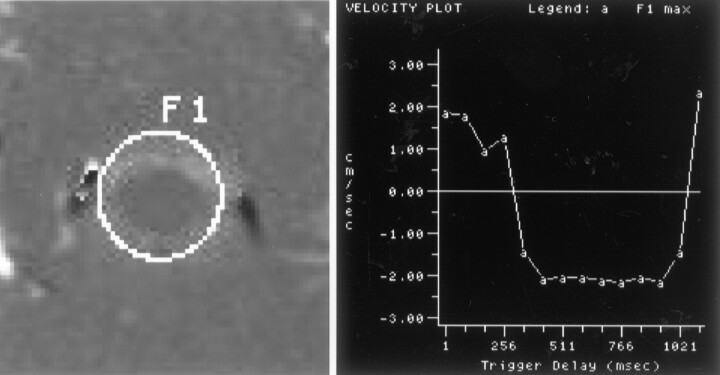
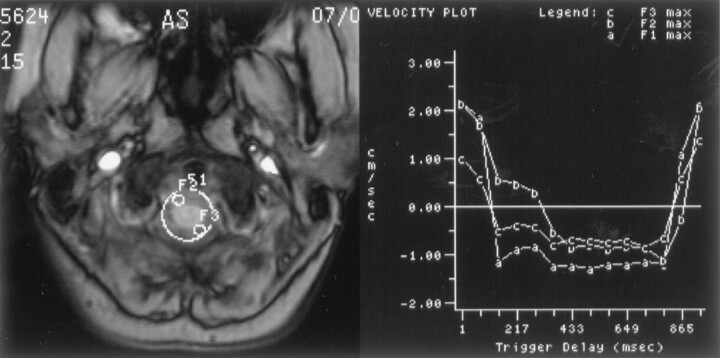
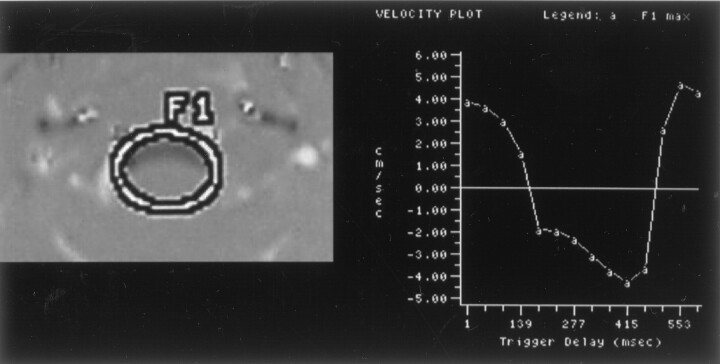
The control volunteers comprised five men and five women with an age range of 30 to 61 years. All imaging studies were considered technically adequate. None had evidence of tonsillar ectopia or spinal or gross posterior fossa abnormalities. For each volunteer, the subarachnoid space and vertebral artery were well defined. The signal intensity throughout the subarachnoid space was relatively uniform in all 14 images (Fig 1). Slightly greater velocities were evident in the anterior subarachnoid space in a paramedian location than in the rest of the subarachnoid space. During the cardiac cycle, signal intensity (velocity) shifted from positive (cephalad flow) to negative (caudad flow) and back to positive. The signal intensity in CSF anterior to the cord was similar but not always identical to that posterior to the cord throughout the cardiac cycle. The temporal pattern of flow was bimodal in one region of interest in each normal volunteer (Figs 2 and 3). In no images of the volunteers was simultaneous flow in both craniad and caudad directions conspicuous and in no images was velocity aliasing identified.
Fig 2.
Phase-contrast image and flow measurements of a normal volunteer. Selected region of interest (left), labeled F1, is illustrated on one of the flow images. Maximum flow velocity in the region of interest for the 14 time points is illustrated graphically (right). Maximum systolic (between trigger delays of 250 and 1021 ms) and diastolic (first 250 and last 100 ms) velocities are approximately 2 cm/s. Velocities are relatively uniform throughout the subarachnoid space.
Fig 3.
Image of the foramen magnum in a normal volunteer shows the placement of three regions of interest (left) and maximal velocities displayed graphically over time (right) for each of the regions of interest. One of the regions of interest encompasses the entire subarachnoid space, and two smaller regions of interest sample portions of the subarachnoid space. Flow in each region of interest has similar temporal patterns and magnitudes. Systolic flow is evident from trigger delays of approximately 160 ms to approximately 860 ms in each of the regions of interest.
The patients included four men and four women with an age range of 29 to 57 years. Tonsillar herniation ranged from 5 to 11 mm. All patients had symptoms and/or signs that were attributed to Chiari I malformation, and all were selected for and subsequently underwent posterior fossa decompression. Five of the eight patients presented with severe Valsalva maneuver-induced headaches, and the other three had headaches or motor dysfunction occurring with neck movement. Six of the patients had sensory deficits, three had motor deficits, and one had tongue fasciculations. Two had cervical hydrosyringomyelia. Progressive scoliosis occurred in one patient with syringomyelia.
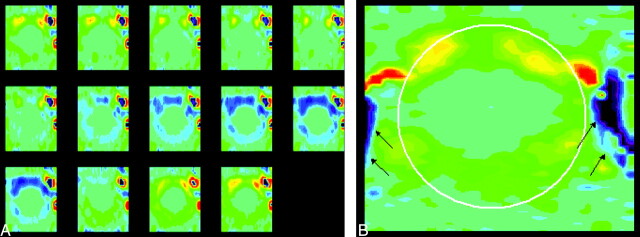
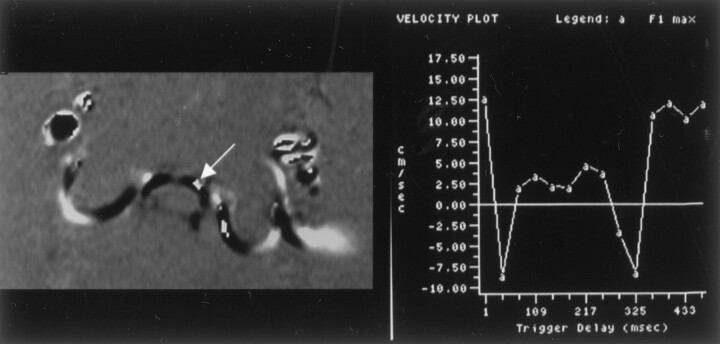
All of the phase-contrast studies of the patients were considered technically adequate for the measurement of peak velocities. In all cases, the vertebral artery course could be identified in the image. For half of the patients, the section chosen for the phase-contrast study was located exactly at the foramen magnum, and for the other half, it was slightly lower. Phase-contrast images of all patients revealed a bimodal flow pattern of CSF through the foramen magnum, as for the normal control volunteers. However, the images of the patients revealed marked nonuniformity of the signal intensity (velocity) throughout the foramen magnum in one or more images though the cardiac cycle (Figs 4 and 5). Velocity varied more from one region to another in the patients than in the volunteers; higher velocities were achieved in the patients (Fig 6). Large differences in velocities were apparent between the anterior and posterior subarachnoid spaces. The greatest systolic and diastolic velocities were anterior to the spinal cord in a paramedian location. The peak velocities often had a different distribution in the systolic than in the diastolic images. In most patients, the greatest velocities appeared in diastole. In some cases, cephalad flow was evident in one part of the subarachnoid space while caudad flow occurred simultaneously in another region. In some patients, regions of interest showed an atypical flow pattern consistent with velocity aliasing. In two patients, velocity aliasing was clearly evident in the pattern of signal intensity changes in the CSF (Fig 7).
Fig 4.
Representative phase contrast images of the foramen magnum in a patient (A) with the same vbgor color scale as in the normal subject. Flow velocities differ markedly in different regions in the subarachnoid space. Velocities anterior to the cord exceed those posterior to the cord. Velocities in the anterolateral subarachnoid space, exceed those elsewhere in the subarachnoid space, especially in diastole. A single frame (B) from late diastole is shown with a cursor placed to illustrate the region in which flow was measured (white oval) and the vertebral arteries (arrows). Note that flow in the subarachnoid space reverses while flow in the vertebral artery has continuous flow.
Fig 5.
Phase contrast images throughout the cardiac cycle in a patient (A) show inhomogeneous flow. These show inhomogeneity of flow, greater velocities anterior to the cord than posterior, greater velocities paramidline than in the midline and greater velocities in the craniad direction than in the caudad direction. An oval is placed on one image with a long trigger delay obtained during diastolic flow of CSF. An enlargement of that image (B) shows a region of aliasing (arrow) within the subarachnoid space in which flow velocity exceeded the venc.
Fig 6.
Phase-contrast image (left) of the foramen magnum shows the placement of a region of interest. Graph of the maximal velocities (right) throughout the cardiac cycle in the selected region of interest in a patient with a Chiari I malformation and a syrinx. Peak velocities during systole and diastole are 4.8 cm/s.
Fig 7.
Phase-contrast image (left) and graph of velocities (right) show velocity aliasing during caudad flow of CSF in the foramen magnum of a patient. In the image a region of bright white signal intensity anterior and to the right of midline is surrounded by dark black signal intensity. The graph indicates that flow for the region of interest appears to turn negative (dark) at 30-ms trigger delay and then unexpectedly reverts to positive from approximately 60-ms trigger delay to approximately 260-ms trigger delay. The apparent reversal of sign in the graph and in the image result from velocity aliasing.
The peak systolic and diastolic velocities for the volunteers are presented in Table 1. The peak systolic velocity averaged 2.4 cm/s (SD, 0.7). The peak diastolic velocity averaged 2.8 cm/s (SD, 1.0), which was not significantly higher.
The peak systolic and diastolic velocities for the patients are presented in Table 2. The peak systolic velocities averaged 3.1 cm/s (SD, 1.0), and the peak diastolic velocities averaged 4.0 cm/s (SD, 1.0). Thepeak systolic velocity was significantly higher in the patients than in the control volunteers (P = .01), and the peak diastolic velocity was higher than in the control volunteers but not significantly so (P = .067). The peak diastolic velocity exceeded the peak systolic velocity in most of the patients, and the difference was statistically significant (P = .04).
Discussion
The Chiari I malformation has a constellation of anatomic and functional abnormalities. The anatomic changes include adhesions in the posterior fossa, crowding of neural structures, and small size of the posterior fossa (15). The functional changes include alterations in CSF flow in the foramen magnum (3–13) and in the foramina of Luschka or Magendie (16). Because the Chiari I malformation is incompletely understood, many questions, such as the indications for surgery, the treatment for an asymptomatic subject, and the selection of the appropriate surgical procedure, remain unresolved or controversial (17). A functional imaging study that differentiates incidental from significant malformations of the foramen magnum would be valuable clinically.
In this pilot study, significant differences were found between peak systolic velocities in adult patients with Chiari I malformations and normal control volunteers. Therefore, flow velocity deserves additional study to determine its relationship to clinical deficits. These results support the hypothesis that altered CSF dynamics contribute to the pathogenesis of clinical manifestations in adult patients with Chiari I malformations. Continued investigation might provide useful functional criteria for evaluating patients with Chiari I malformations.
The most striking observation in this study is the inhomogeneity of flow in the patients compared with the normal volunteers. In the normal volunteers, regular ebb and flow of CSF is evident in the foramen magnum, with relatively small differences in velocities throughout the subarachnoid space. In the patients, jets of high velocity are noted in some regions and little or no flow in other regions; flow is observed in a cephalad direction in one portion of the subarachnoid space and craniad in another at times during the cardiac cycle. These spatial and temporal variations in flow suggest highly abnormal pressure differentials and shear stresses in the CSF. Further analysis and further refinement of the methods are required to quantify the inhomogeneity in CSF flow (Quigley et al, poster presentation, 2002).
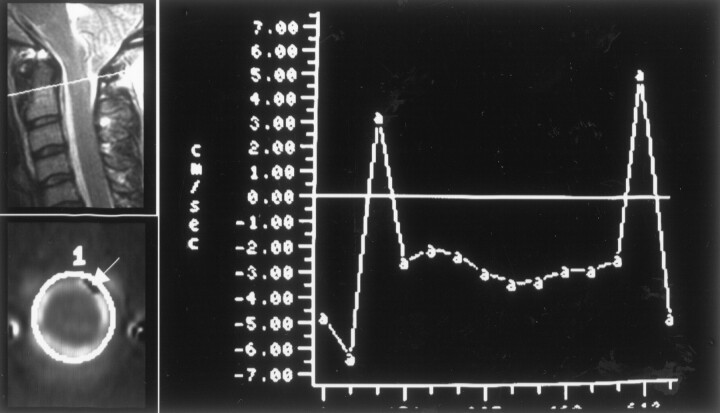
The second observation is increased peak velocities in the patients compared with the control volunteers. The hypothesized correlation of elevated CSF velocities with the presence of Chiari I malformation was found, despite the small sample size. With the present technique, only the velocity vector perpendicular to the plane of section (superior-inferior) is measured. The presently used phase-contrast imaging methods underestimate velocity when flow is complex or not perpendicular to the plane of image. In the regions in which flow was sampled, complex flow and turbulence were likely, leading to underestimation of velocities. The accuracy of superior-inferior flow velocity measurements is further limited by the precision of the phase-contrast technique. Signal intensity-to-noise ratio is relatively poor in the phase-contrast acquisition. The quantification of velocities is hampered by the low spatial resolution of the technique and by the destructive interference of spin phases (intravoxel incoherent motion), which reduces the measured velocity. Temporal resolution also limits the detection of flow velocities to those that occur during the portion of the cardiac cycle sampled and persist for at least 40 ms. Residual phase effects due to eddy currents can cause undesired phase changes that confound the velocity measurements in the phase-contrast studies. Subtracting phase shifts seen in regions with no significant motion from the apparent velocity effectively eliminates these errors. In the presence of velocity aliasing, velocity can be said to exceed the encoding velocity (10 cm/s), but it cannot be estimated accurately. By excluding regions with aliasing from our measurements, the velocities of regions with less than maximal flow were recorded. Because aliasing was evident only in the patients, the effect was to diminish the differences between the patients and the volunteers (Fig 8).
Fig 8.
Illustration of aliasing of craniad flow in a patient. In a sagittal view image (upper left), the location of the axial plane is indicated by a white line. In an axial view image showing craniad flow at 51-ms trigger delay (lower left), the location of a region of interest is illustrated. An arrow in this image obtained during the first 50 ms of the cardiac cycle indicates a region of inverted sign. In the graph of CSF velocity, flow paradoxically has a negative sign during the first 50 and last 50 ms of the cardiac cycle, indicating aliasing during diastole.
The selection of section location for recording flow represents a potential source of bias or inaccuracy. In normal volunteers, the section selected was located exactly at the foramen magnum, whereas in patients, the section with sufficient CSF for measurement was often a few millimeters inferior to the foramen magnum. We think it unlikely, however, that the lower section location could explain the differences in velocity measurements. Although velocity varies with distance along the spinal axis (7), it does not vary sufficiently to explain the differences between patients and control volunteers in our study. Acquisition of multiple contiguous phase-contrast MR images could resolve this issue. The location of the section relative to the vertebral artery or to the epidural venous plexus represents another possible confounding factor. However, the possibility that arterial flow confounds the velocity measurements was minimized by rejecting velocity measurements when time courses did not show nearly equal to and fro movement characteristic of CSF flow. With the use of techniques to isolate phase changes due to arterial flow from those of CSF, better rejection of vertebral artery blood flow might be achieved.
Flow of CSF in the cranial vault and spine has been characterized for normal persons by investigators using phase-contrast MR imaging and cardiac gating to acquire images regularly throughout the cardiac cycle (3). Typically, the R–R interval is sampled 14 to 16 times. The cardiac cycle may be completely or incompletely sampled, depending on the R–R interval and the image acquisition strategy used (4). To acquire phase-contrast MR imaging data, an encoding velocity value must be chosen to maximize the accuracy of the measurement and to minimize the possibility of aliasing. An encoding velocity of 10 cm/s is commonly chosen (4). In some studies, a sagittal plane has been used, so that flow can be characterized simultaneously above, below, and at the foramen magnum. In other studies, flow is sampled in a single axial plane, so that flow is characterized throughout the foramen magnum. In some cases, the flow volumes and rates are reported as an average for the entire subarachnoid space, so that peak velocities are not identified.
In the midsagittal plane, CSF flow velocities in normal control volunteers have been reported to be between 0.7 cm/s (diastole) and 1.3 cm/s (systole) (5, 6). Somewhat higher velocities (systolic velocities of 3.1 cm/s and diastolic velocities of 2.1 cm/s) have been reported at the C2–C3 levels (7). Peak velocities measured in the sagittal plane underestimate the velocity of flow where peak velocities occur lateral to the midline. In those studies in which the axial plane has been used to study CSF flow in the foramen magnum, flow velocities have been reported at 2.1 cm/s (systole) to 2.3 cm/s (diastole) (8). In one study, oscillatory flow volume was measured at 39 ± 4 mL/min in a space measuring 0.9 cm2, indicating a velocity of 0.6 cm/s (9). Others have reported similar measurements (10). In one study in which a sagittal plane of acquisition was used, the peak velocities recorded for normal were 4.5 cm/s (systolic) and 5.9 cm/s (diastolic) (11), higher than the measurements reported by others.
In patients with Chiari I malformations, CSF flow patterns in the foramen magnum have been described, although measurements in the axial plane have been limited (4). In one study in which the sagittal plane of acquisition was used, patients with Chiari I malformations had peak systolic/diastolic CSF velocities in the foramen magnum of 11.7/11.6 cm/s compared with velocities of 4.9/5.9 cm/s in normal control volunteers (11). In patients with Chiari I malformations, one group of investigators noted an impairment of diastolic CSF flow (4). Discrepancies in the time at which flow reverses in the subarachnoid space have been reported (4, 12). Evidence of impaired systolic (7) or impaired flow late in the cardiac cycle (4) has been reported. Other differences between some patients with Chiari I malformations and volunteers have been reported: different patterns of cord motion (4), shorter periods of systolic flow (4), delayed return of anterior flow rate from cephalad to craniad (4), and increased pulsatile mobility of the tonsils and cord (4, 12, 13, 18).
Investigators using phase-contrast MR imaging have sampled CSF flow differently from the way in which we did. In some studies, CSF flow was reported in terms of bulk flow (in mL/min) or in terms of average velocity rather than in terms of peak velocities (4, 10). Consequently, the CSF velocities that have been reported (0.7–1.3 cm/s) were substantially lower than in our study. In other studies, sagittal phase images have been acquired (5–7, 11). In those studies, velocities of CSF in the foramen magnum in normal control volunteers were similar to our results, reaching upward of 3.5 cm/s. However, the elevated velocities seen in our patient population were not observed in those studies, probably because in patients with Chiari I malformations, the maximum velocities occur not in the midline but in a paramidline location. Gardner (20) and Williams (21) postulated that the Chiari I malformation affects CSF flow velocities. Williams, by using manometry in the posterior fossa and spinal canal, observed that caudal flow of CSF is delayed by hindbrain adhesions and outlet obstruction in patients with Chiari I malformations, thus creating pressure differentials that may last only seconds. Several investigators report that clinical improvement after surgical decompression in cases of Chiari I malformation is associated with normalization of CSF flow (5, 7, 11, 22).
The correlation of abnormal flow velocities with tonsillar herniation in Chiari I malformation does not prove a causal relationship. Measurements of CSF velocities have not, to our knowledge, been reported for study participants with tonsillar herniation who are asymptomatic. No criteria for diagnosing symptomatic Chiari I malformation on the basis of phase-contrast MR imaging are yet defined. The results suggest, however, that additional studies with more sophisticated techniques are required. With 3D or multi-section acquisitions, flow throughout the posterior fossa and upper cervical spine could be evaluated. Techniques that do not require the selection of an encoding velocity would improve results. Analyses that rigorously distinguish vascular and CSF velocities would improve accuracy. CSF velocity and flow studies in pediatric patients with Chiari I malformations and in age-matched control volunteers are needed. Finally, measurements of flow may be useful for patients with syringomyelia and in whom pathophysiological abnormalities at the foramen magnum are suspected but no tonsillar herniation is evident (Chiari 0 malformation).
Conclusion
Symptomatic patients with Chiari I malformations have greater spatial and temporal variation in CSF velocities through the foramen magnum than do normal control volunteers. Peak velocities are increased in these patients, especially in diastole and in the anterior subarachnoid space. The measurement of peak CSF velocities in the foramen magnum may be useful for evaluation of patients with syringomyelia and foramen magnum malformations. However, the relationship between CSF dynamics and clinical deficits in association with Chiari I malformations requires additional study.
References
- 1.Meadows J, Kraut M, Guarnieri M, Haroun RI, Carson BS. Asymptomatic Chiari type I malformations identified on magnetic resonance imaging. J Neurosurg 2000;92:920–926 [DOI] [PubMed] [Google Scholar]
- 2.Iskandar BJ, Hedlund GL, Grabb PA, Oakes WJ. The resolution of syringohydromyelia without hindbrain herniation after posterior fossa decompression. J Neurosurg 1988;89:212–216 [DOI] [PubMed] [Google Scholar]
- 3.Quencer RM, Post MJ, Hinks RS. Cine MR in the evaluation of normal and abnormal CSF flow: intracranial and intraspinal studies. Neuroradiology 1990;32:371–391 [DOI] [PubMed] [Google Scholar]
- 4.Hofmann E, Warmuth-Metz M, Bendszus M, Solymosi L. Phase-contrast MR imaging of the cervical CSF and spinal cord: volumetric motion analysis in patients with Chiari I malformation. AJNR Am J Neuroradiol 2000;21:151–158 [PMC free article] [PubMed] [Google Scholar]
- 5.Armonda RA, Citrin CM, Foley KT, Ellenbogen RG. Quantitative cine-mode magnetic resonance imaging of Chiari I malformations: an analysis of cerebrospinal fluid dynamics. Neurosurgery 1994;35:214–224 [DOI] [PubMed] [Google Scholar]
- 6.Levy LM, Di Chiro G. MR phase imaging and cerebrospinal fluid flow in the head and spine. Neuroradiology 1990;32:399–406 [DOI] [PubMed] [Google Scholar]
- 7.Bhadelia RA, Bogdan AR, Wolpert SM, Lev S, Appignani BA, Heilman CB. Cerebrospinal fluid flow waveform: analysis in patients with Chiari I malformation by means of gated phase-contrast MR imaging velocity measurements. Radiology 1995;196:195–202 [DOI] [PubMed] [Google Scholar]
- 8.Enzmann DR, Pelc NJ. Normal flow patterns of intracranial and spinal cerebrospinal fluid defined with phase-contrast cine MR imaging. Radiology 1991;178:467–474 [DOI] [PubMed] [Google Scholar]
- 9.Enzmann DR, Pelc NJ. Cerebrospinal fluid flow measured by phase-contrast cine MR. AJNR Am J Neuroradiol 1993;14:1301–1307 [PMC free article] [PubMed] [Google Scholar]
- 10.Greitz D, Wirestam R, Franck A, Nordell B, Thomsen C, Stahlberg F. Pulsatile brain movement and associated hydrodynamics studied by magnetic resonance phase imaging: the Monro-Kellie doctrine revisited. Neuroradiology 1992;34:370–380 [DOI] [PubMed] [Google Scholar]
- 11.Heiss JD, Patronas N, DeVroom HL, et al. Elucidating the pathophysiology of syringomyelia. J Neurosurg 1999;91:553–562 [DOI] [PubMed] [Google Scholar]
- 12.Wolpert SM, Bhadelia RA, Bogdan AR, Cohen AR. Chiari I malformations: assessment with phase-contrast velocity MR. AJNR Am J Neuroradiol 1994;15:1299–1308 [PMC free article] [PubMed] [Google Scholar]
- 13.Pujol J, Roig C, Capdevila A, et al. Motion of the cerebellar tonsils in Chiari type I malformation studied by cine phase-contrast MRI. Neurology 1995;45:1746–1753 [DOI] [PubMed] [Google Scholar]
- 14.Iskandar BJ and Oakes WJ. Chiari malformations. In: Albright L, Pollack I, Adelson D, eds. Principles and Practice of Pediatric Neurosurgery. New York: Thieme Medical Publications, Inc.;1999. :165–187
- 15.Karagoz F, Izgi N, Kapijcijoglu Sencer S Morphometric measurements of the cranium in patients with Chiari type I malformation and comparison with the normal population. Acta Neurochir (Wien) 2002;144:165–171 [DOI] [PubMed] [Google Scholar]
- 16.Santamarta D, Kusak ME, de Campos JM, Sierra JM. Increased cerebrospinal fluid flow through the foramen of Magendie after decompression for Chiari I malformation. J Neurol Neurosurg Psychiatry 1999;66:799. [DOI] [PMC free article] [PubMed] [Google Scholar]
- 17.Cohen AR, Gaskill SJ. Chiari I malformation. Neurosurg Focus 2001;11: Introduction www.neurosurgery.org/focus/July01/11-1-1. [Google Scholar]
- 18.Terae S, Miyasaka K, Abe S, Abe H, Tashiro K. Increased pulsatile movement of the hindbrain in syringomyelia associated with the Chiari malformation: cine-MR with presaturation bolus tracking. Neuroradiology 1994;36:125–129 [DOI] [PubMed] [Google Scholar]
- 19.Oldfield EH, Muraszko K, Shawker TH, Patronas NJ. Pathophysiology of syringomyelia associated with Chiari I malformation of the cerebellar tonsils. J Neurosurg 1994;80:3–15 [DOI] [PubMed] [Google Scholar]
- 20.Gardner WJ. Hydrodynamic mechanism of syringomyelia: its relationship to myelocele. J Neurol Neurosurg Psychiatry 1965;28:247–259 [DOI] [PMC free article] [PubMed] [Google Scholar]
- 21.Williams B. Cerebrospinal fluid pressure gradients in spina bifida cystica with special reference to the Arnold-Chiari malformation and aqueductal stenosis. Dev Med Child Neurol Suppl 1975;35:138–15 [DOI] [PubMed] [Google Scholar]
- 22.Brugieres P, Idy-Peretti I, Iffenecker C, et al. CSF flow measurement in syringomyelia. AJNR Am J Neuroradiol 2000;21:1785–1792 [PMC free article] [PubMed] [Google Scholar]


