

Abstract
Summary: We applied computational fluid dynamics (CFD) analysis to assess 3D digital subtraction angiography findings in a patient with a giant vertebrobasilar aneurysm to simulate and compare the consequences of left and right vertebral artery occlusion. The balloon occlusion test suggested that occlusion of the right vertebral artery is the better way to treat this patient’s aneurysm from the point of view of aneurysmal thrombosis and isolation from the circulation. The computer simulation supported this conclusion, at the same time indicating that from the point of view of pressure distribution on the wall of the aneurysm, the right vertebral occlusion may be also accompanied by an undesirable effect. A high-pressure area on the aneurysm wall in systole was revealed. This high pressure potentially could lead to subsequent aneurysmal growth, which indeed occurred, as was revealed by a follow-up examination 6 months later. This study is a good example of possible future applications of CFD in patients with cerebrovascular disease before therapeutic intervention.
Endovascular occlusion of vertebral arteries has been established as one of the treatment modalities for vertebrobasilar aneurysms (1–6). This approach is based on the fact that hemodynamics play a crucial role in the formation of aneurysms and that the changes in hemodynamic flow pattern (ie, in velocity, pressure, and shear stress distributions) may potentially enhance thrombosis within aneurysms, which is favorable for their treatment.
In the present work, computational fluid dynamics (CFD) analysis based on 3D digital subtraction angiography findings in a patient with giant vertebrobasilar aneurysm was applied to simulate and compare hemodynamic consequences of left and right vertebral artery occlusion before endovascular therapy.
Case Presentation
A 66-year-old man presented to our hospital complaining of recent headache, right hearing loss, dysarthria, right facial palsy, and history of left homonymous hemianopia (2 years earlier). Previous MR and angiographic studies disclosed a giant aneurysmal mass with flow void located in the perimesencephalic and cerebellopontine angle cisterns that progressively increased in size over the past 2 years of conservative follow-up and eventually exerted marked compression on the brain stem and cerebellum, as shown in Figure 1.
Fig 1.

Pretreatment MR and angiographic images.
A, Left vertebral artery angiogram in the antroposterior view, arterial phase, on the patient’s first clinical presentation 2 years ago shows the vertebrobasilar aneurysm and poor visualization of the basilar artery.
B, Recent follow-up of the left vertebral artery angiogram in the antroposterior view, arterial phase, shows progressive aneurysmal growth.
C, T1-weighted MR image with gadolinium injection demonstrates the aneurysmal mass effect in the posterior cranial fossa.
D, 3D digital subtraction angiogram with volume rendering through left vertebral injection shows giant aneurysm involving both vertebral arteries and basilar artery, with maximum dilatation over the right vertebral artery exit to basilar artery.
Three-dimensional rotational digital subtraction angiography clearly elucidated that the giant aneurysm involved the two vertebral arteries and the basilar artery junction, with maximal aneurysmal dilatation at the exit of the right vertebral artery into the basilar artery, as shown in Figure 1. Poor collateral flow of the bilateral posterior communicating arteries was also observed during conventional digital subtraction angiography study (not shown).
The geometry of this aneurysm was so complex that it was difficult to decide which vertebral artery occlusion was the best treatment for this patient. To choose the best strategy, it was decided to carry out a balloon occlusion test. In addition, the surface geometry of the aneurysm was extracted from angiographic data and used for computational simulation of either left or right vertebral artery occlusion with subsequent analysis of the hemodynamic patterns in both cases.
Balloon Occlusion Test and Embolization Procedures
Balloon occlusion test and embolization procedures were performed with neuroleptic anesthesia to allow clinical neurologic examination. The balloon microcatheter (Copernic; Balt, Montmercy, France) was introduced in either vertebral artery through a 6F introducing catheter. Contralateral vertebral artery and bilateral internal carotid artery angiography were performed during the balloon occlusion test with a 5F diagnostic catheter.
During the balloon occlusion test, contrast material washout times and patterns were compared for right and left vertebral occlusions. Right vertebral artery therapeutic occlusion was found to be better than the left vertebral artery, because in this case contrast material washout time and contrast material stasis in the aneurysm was longer, indicating lower blood velocity inside the aneurysm and, hence, better conditions for aneurysmal thrombosis.
The patient underwent permanent right vertebral occlusion on the same day after balloon occlusion test by detachable coils. Under systemic heparinization, the right vertebral artery was catheterized by a 6F introducing catheter, through which a microcatheter (Excelsior 14, Boston Scientific, Watertown, MA) and guidewire (GT 12; Terumo, Tokyo, Japan) were inserted. Heparin was administered for 1 day after the procedure and tapered off without reversal.
A cine MR imaging study was conducted before and after endovascular surgery, and the pattern of blood flow within the aneurysm was compared with the computer simulation results.
Computational Analysis
Rotational Angiography
An Advantx UNV system (GE Medical Systems, Milwaukee, WI) is used at our institution. A workstation (Advantage Workstation 3.1, GE Medical Systems) with data from rotational angiography was used to perform 3D digital subtraction angiography. Three-dimensional data sets were obtained from rotational series consisting of two rotations. The first one provided the subtraction mask. The C-arm was rotated 200° within 5 seconds at the exposure rate of 8.8 frames per second. A total of 44 images with matrix size of 512 × 512 pixels were acquired. The second rotation was performed during the administration of contrast material. Seventeen milliliters of contrast medium were automatically injected at a flow rate of 3 mL/s through a catheter positioned in the left vertebral artery by using a power injector (Medrad Mark V Plus; Sugan, Osaka, Japan). All 88 images of the mask data and contrast material data were immediately transferred to the Advantage Workstation for volume analysis via the network. A three-dimensional reconstruction algorithm based on the algebraic reconstruction technique was used to digitally produce 3D digital subtraction angiograms on the workstation within 8 minutes. Reconstructed images, including maximum intensity projection (MIP) and surface shaded display (SSD), and virtual endoscopic images were produced from the data. The algorithms used were MIP and SSD at an isosurface with mean threshold value of 1100 HU.
Cine MR Imaging
Cine MR imaging data were acquired by using cardiac gating to form a “movie” sequence of the blood flow pattern inside the aneurysm before and after therapeutic occlusion by using a 1.5-T MR imaging (Signa Horizon; GE Medical Systems) equipped with a standard head coil. After acquiring image in the sagittal plane (survey imaging), cardiac gated cine MR imaging (gradient echo sequence, 50/15/2 [TR/TE/NEX], flip angle, 45°; matrix, 256 × 192; and field of view, 24 cm) was then performed in the axial section, which crosses the aneurysm, and basilar artery (5 mm thickness). Imaging time was approximately 5–7 minutes.
Computational Flow Dynamics Modeling
The procedure of the extraction of surface geometry data from 3D digital subtraction angiograms and subsequent volume grid generation has been described in detail elsewhere (7, 8). The grid-generation software ICEM CFD, version 4.1 (ICEM CFD Engineering) was used to discretize the computational domain by using the boundary-fitted tetrahedral mesh containing 25,374 nodes and 123,838 tetrahedrons.
The governing equations are the three-dimensional incompressible unsteady Navier-Stokes equations written in strong conservative form for mass and momentum. They are discretized with a finite-volume method and solved in time-marching manner by using the pseudocompressibility technique. The simulation was performed with the following material constants: blood density, 1060 kg/m3; blood dynamic viscosity, 0.004 Poiseuille (Pa.s). Blood was considered as a Newtonian fluid.
The software Fluent, version 6.0.12 (Fluent, Inc., Lebanon, NH) was applied to simulate physiologic pulsating flow in our patient-specific computational model. The boundary conditions at open inflow boundaries (left and right vertebral arteries) were specified as the Fluent “velocity-inlet” boundary condition and were based on the pulsatile periodic flow rate obtained by Doppler ultrasonography (GE Medical Systems) of both vertebral arteries in the neck, which amounted to a mean velocity of 0.90 m/s. On the vessel walls, which were considered rigid, we applied the nonslip and nonpenetration conditions (ie, all velocity components at the vessel walls were set to zero—the “wall boundary” condition). The same condition was used to close (“occlude”) inflow boundaries. For the outflow boundary (basilar artery), the Fluent “outflow boundary” condition was used. The simulation produced relative pressure values to be considered with respect to a basal pressure.
The simulation was initially performed for 3 seconds (over three cardiac cycles) with both vertebral arteries open. Then the occlusion of the left vertebral artery was modeled by applying the “wall-boundary” condition at the corresponding inflow boundary (the right vertebral artery remained open), and the computation was continued for another 3 seconds. Finally, the occlusion of the right vertebral artery was performed in the same manner (“wall boundary” condition at the inflow boundary of the right artery and “velocity-inlet” boundary condition at the inflow boundary of the left artery), followed by next 3 seconds of computation.
The SIMPLE method for solving the discretized equations was chosen. The unsteady flow was computed with a time step of 0.025 seconds. The time step was found to be sufficient from the point of view of accuracy. In the computational sequence described above, the results corresponding to the last (third) second of the cardiac cycle were considered to be independent from the initial conditions and used for flow analysis.
The simulation necessitated approximately 12 hours on a single processor of SGI Origin 2000 (Silicon Graphics, Inc, Mountain View, CA). To improve the convergence speed, relaxation factors were applied to velocity and pressure modifications. Flow visualization of Fluent’s results was performed by means of the software Ensight, version 7.3.0 (Computational Engineering International, Inc., Berkley, CA). We also created a movie of the unsteady blood flow through the aneurysm before and after occlusion of either vertebral artery (one movie frame is shown in Figure 2).
Fig 2.
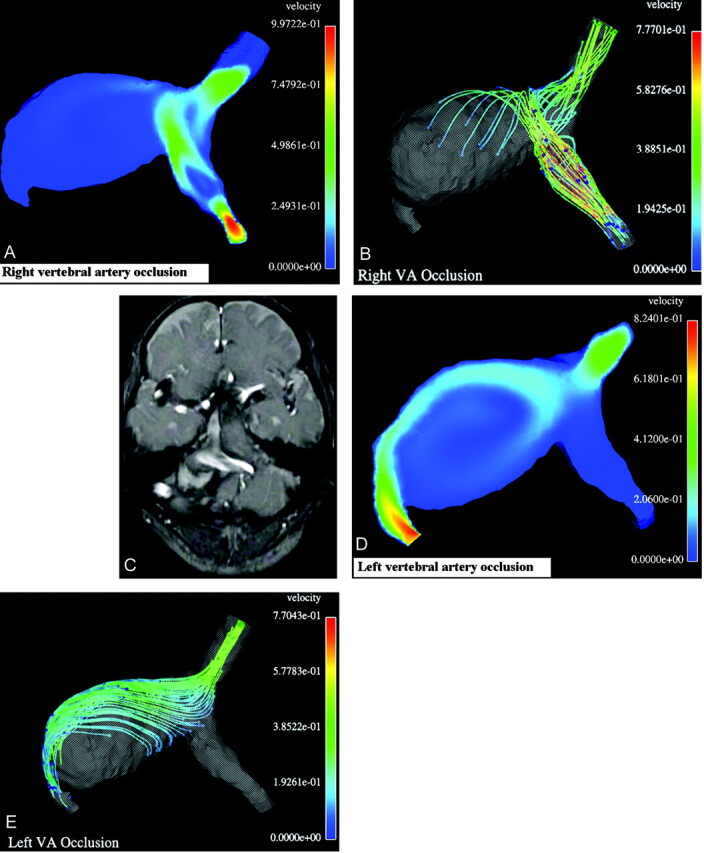
Results of computational balloon occlusion tests.
A, Typical instant velocity magnitude (m/s) distribution in a cross-section after right vertebral occlusion;
B, Typical instant streamlines colored according to the velocity values (m/s) after right vertebral artery occlusion. As seen in panels A and B, in this case the blood flow from the left vertebral artery hits the opposite wall of the aneurysm and turns toward the basilar artery, whereas the flow in the most part of the aneurysm remains almost stagnant, with low velocity;
C, One frame from cine MR imaging movie showing typical instant white streamlines representing the unidirectional blood flow in systole coming from left vertebral artery after occlusion of the right one. Compare the white stream entering the aneurysm with the colored stream in the simulation results in panels A and B.
D, Typical instant velocity magnitude (m/s) in a cross-section after occlusion of the left vertebral artery.
E, Typical instant streamlines colored according to the velocity values (m/s) after occlusion of the left vertebral artery. As seen in panels D and E, in this case the blood flow from the right vertebral artery goes all the way along the aneurysm wall and induces a large recirculation zone in the aneurysm.
Discussion
Several studies have been conducted to evaluate the hemodynamic effects of therapeutic vertebral artery occlusion to treat posterior circulation aneurysms, considering several model designs in a generalized approach (9–14). Cerebral arteries and, in particular, aneurysms are very different in shapes, sizes, and wall characteristics, making it difficult to judge their flow dynamic behavior and necessitating a “case-by-case” approach to each patient to determine the manner of treatment.
Vascular geometry appears to be an important factor in determining blood flow patterns. Computational flow simulation of every patient’s vascular geometry may be a promising technique to reveal blood flow behavior, especially in geometrically difficult cases (7, 8, 14). Application of CFD to the case presented in this article, with poor bilateral cross posterior communicating artery flow, was especially useful because the posterior circulation was nearly isolated from the anterior one.
It is important to remember that any computer model is based on a number of assumptions. In the present study, for instance, blood is considered as a Newtonian fluid, and vessel and aneurysm walls as rigid. It seems safe to consider these assumptions to be of secondary importance in comparison with the influence of geometry and pulsating nature of blood flow, which are the most significant factors for prediction of possible aneurysmal growth. In fact, the entire strategy of treating patients with difficult giant vertebrobasilar aneurysms by unilateral vertebral artery occlusion (ie, by altering the geometry) is based on the assumption that this occlusion may change the local aneurysmal hemodynamics and, accordingly, enhances its thrombosis (1–3).
In addition to the model assumptions, another limitation of computational analysis is that it is not possible, with current computer resources and time limitations inherent to clinical practice, to evaluate the influence on the aneurysm hemodynamics of all model parameters (such as heart rate and rhythm, blood pressure, etc.) and their variations in time. Although computer modeling allows for easy manipulation with these parameters, at present we usually deal with just a few representative cases revealing only the most essential hemodynamic features of the aneurysm under study.
During the diagnostic angiography procedure, we observed that injection of contrast material through the left vertebral artery resulted in better visualization of the basilar artery than when contrast material was injected into the right vertebral artery, in which case the basilar artery was not visualized at all (not shown). Moreover, the results of the balloon occlusion test showed longer contrast material washout time and contrast material stasis in the aneurysm during right vertebral artery occlusion.
The above-mentioned angiographic findings were very useful in determining that occlusion of the right vertebral artery is more effective; however, they supplied us only with general blood flow patterns. Neither diagnostic angiography nor balloon occlusion test can give us any data regarding details of velocity distribution and its variation or other hemodynamic parameters, such as pressure (normal stress), shear stress, etc. Assisting computational simulation of vertebral occlusion may be needed to study each hemodynamic parameter in more detail and interpret them separately and in combination.
Our computer simulation results confirmed that right vertebral artery blood flow contributes more to the flow inside the aneurysm than does the flow coming from the left artery (Fig 2); however, the surface pressure map for the geometry under investigation after right vertebral artery occlusion showed significant pressure variations over the whole surface (of the order of 6 mm Hg in peak systole). In particular, a localized high-pressure spot was revealed on the aneurysm wall, right in front of the blood stream coming from the left vertebral artery. This finding led us to conjecture that future aneurysm re-growth may begin at this location. Six-month follow-up showed that this conjecture was correct: such re-growth has eventually occurred, as shown in Figure 3.
Fig 3.
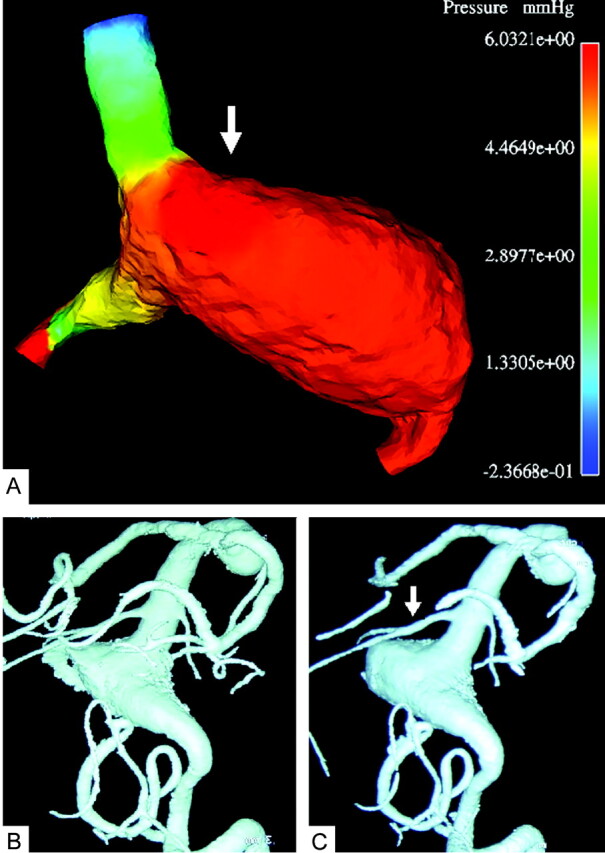
Comparison of the computational result for the right vertebral artery occlusion with follow-up angiograms.
A, Typical instant surface pressure (mm Hg) for the entire geometry after occlusion of the right vertebral artery, showing a higher pressure area (white arrow) on the wall opposite to the blood stream coming from the right vertebral artery. The locally higher normal stress may lead to subsequent growth of the aneurysm at this location.
B, 3D digital subtraction angiogram with volume rendering through left vertebral injection 3 months (B) and 6 months (C) after occlusion of the right vertebral artery. Note that the aneurysm started to grow again in the highest pressure area (white arrow) that was predicted computationally (see panel A).
Cine MR imaging was performed before and after therapeutic occlusion to compare the blood flow patterns and visually inspect how much of the aneurysm volume is eventually clotted after the occlusion. Preoperative cine MR imaging movie revealed vortex flow within the aneurysm (not shown); such vortex flow disappeared completely after therapeutic occlusion. Instead, postoperative unidirectional flow was observed in the left vertebral artery and adjacent area of the aneurysm, together with significant aneurysmal thrombosis (3 months after endovascular treatment). These findings were found to be in correspondence with our computational results, as shown in Figure 2.
Conclusion
Our computer simulation confirmed that right vertebral artery occlusion is the best available option for this patient. At the same time, the discovery of a higher pressure area after the occlusion, on the aneurysmal wall opposite to the blood stream coming from the left vertebral artery, indicated that this treatment might be ineffective for this patient in the long term because of possible future growth of the aneurysm. Such re-growth was indeed detected by the follow-up examination 6 months later. This case study provides an example of possible future applications of CFD in patients with cerebrovascular disease before therapeutic intervention.
References
- 1.Aymard A, Gobin P, Hodes JE, et al. Endovascular occlusion of vertebral arteries in the treatment of unclippable vertebrobasilar aneurysms. J Neurosurg 1991;74:393–398 [DOI] [PubMed] [Google Scholar]
- 2.Drake CG. Ligation of vertebral arteries (unilateral or bilateral) or basilar artery in the treatment of large intracranial aneurysms. J Neurosurg 1975;43:255–274 [DOI] [PubMed] [Google Scholar]
- 3.Hoh BL, Putman CM, Budzik RF, et al. Combined surgical and endovascular techniques of flow alteration to treat fusiform and complex wide-necked intracranial aneurysms that are unsuitable for clipping or coil embolisation. J Neurosurg 2001;95:24–35 [DOI] [PubMed] [Google Scholar]
- 4.Redkop G, TerBrugge K, Willinsky R. Subarachnoid hemorrhage from vertebrobasilar dissecting aneurysm treated with staged bilateral vertebral artery occlusion: the importance of follow-up angiography: technical case report. Neurosurgery 1999;45:1258–1263 [DOI] [PubMed] [Google Scholar]
- 5.Steinberg GK, Drake CG, Peerless SJ. Deliberate basilar or vertebral artery occlusion in the treatment of intracranial aneurysms: immediate results and long-term outcome in 201 patients. J Neurosurg 1993;79:161–173 [DOI] [PubMed] [Google Scholar]
- 6.Taki W, Nakahara I, Sakai N, et al. Large and giant middle to lower basilar trunk aneurysms treated by surgical and interventional methods. Neurol Med Chir (Tokyo)1998;38:826–835 [DOI] [PubMed] [Google Scholar]
- 7.Hassan T, Saito T, Timofeev E, et al. Numerical simulations of blood flow in cerebral vessels with aneurysms. In: Proceedings of the Fifth International JSME-KSME Fluids Engineering Conference. Nagoya, Japan, November 17–21,2002;235–240
- 8.Hassan T, Timofeev E, Ezura M, et al. Hemodynamic analysis of an adult vein of Galen aneurysm malformation by use of 3D image- based computational fluid dynamics. AJNR Am J Neuroradiol 2003;24:1075–1082 [PMC free article] [PubMed] [Google Scholar]
- 9.Kawanishi M, Nagasawa S, Ohta T, et al. Simulation study on therapeutic vertebral artery occlusion for VA-PICA giant aneurysm. Neurol Res 1994;16:100–103 [DOI] [PubMed] [Google Scholar]
- 10.Kerber CW, Knox HK, Buxton RB, Meltzer HS. Flow dynamics in a fatal aneurysm of the basilar artery. AJNR Am J Neuroradiol 1996;17:1417–1412 [PMC free article] [PubMed] [Google Scholar]
- 11.Nagayasu S. Parent artery occlusion therapy for giant aneurysms of the vertebrobasilar system: hemodynamic analysis by hydraulic vascular model. Nippon Geka Hokan 1992;61:156–167 [PubMed] [Google Scholar]
- 12.Nagasawa S, Kawanishi M, Tada Y, et al. Simulation of therapeutic parent artery occlusion for basilar head aneurysms: hemodynamic effect of occlusion sites and diameters of collateral arteries. Neurol Res 1999;21:180–184 [DOI] [PubMed] [Google Scholar]
- 13.Tateshima S, Murayama Y, Villablanca P, et al. Intraaneurysmal flow dynamics study featuring an acrylic aneurysm model manufactured using a computerized tomography angiogram as a mold. J Neurosurg 2001;95:1020–1027 [DOI] [PubMed] [Google Scholar]
- 14.Foutrakis GN, Yonas H, Sclabassi RJ. Finite element methods in the simulation and analysis of intracranial blood flow. Neurol Res 1997;19:174–186 [DOI] [PubMed] [Google Scholar]