Abstract
Although multiple lasers and high-dimensional analysis capability are now standard on advanced flow cytometers, ultraviolet (UV) lasers (usually 325–365 nm) remain an uncommon excitation source for cytometry. This is primarily due to their cost, and the small number of applications that require this wavelength. The development of the Brilliant Ultraviolet (BUV fluorochromes, however, has increased the importance of this formerly niche excitation wavelength. Historically, UV excitation was usually provided by water-cooled argon- and krypton-ion lasers. Modern flow cytometers primary rely on diode pumped solid state lasers emitting at 355 nm. While useful for all UV-excited applications, DPSS UV lasers are still large by modern solid state laser standards, and remain very expensive. Smaller and cheaper near UV laser diodes (NUVLDs) emitting at 375 nm make adequate substitutes for 355 nm sources in many situations, but do not work as well with very short wavelength probes like the fluorescent calcium chelator indo-1. In this study, we evaluate a newly available UV 320 nm laser for flow cytometry. While shorter in wavelength that conventional UV lasers, 320 is close to the 325 nm helium-cadmium wavelength used in the past on early benchtop cytometers. A UV 320 nm laser was found to excite almost all Brilliant Ultraviolet dyes to nearly the same level as 355 nm sources. Both 320 nm and 355 nm sources worked equally well for Hoechst and DyeCycle Violet side population analysis of stem cells in mouse hematopoetic tissue. The shorter wavelength UV source also showed excellent excitation of indo-1, a probe that is not compatible with NUVLD 375 nm sources. In summary, a 320 nm laser module made a suitable substitute for conventional 355 nm sources. This laser technology is available in a smaller form factor than current 355 nm units, making it useful for small cytometers with space constraints.
Keywords: flow cytometer, ultraviolet laser, near ultraviolet laser diode, Brilliant Ultraviolet dye
Introduction
Flow cytometry has seen dramatic advances since its commercial introduction in the 1970s. Nevertheless, lasers remain the light source of choice for efficient excitation of fluorescent probes (1,2). The technology and wavelengths of lasers available for flow cytometry has changed and increased significantly within the last decade (3). Large gas lasers have been largely replaced by smaller, lower maintenance, longer-lived solid state sources (4). The variety of wavelengths available for flow cytometry now covers the entire visible spectrum from the ultraviolet to the near infrared. The number of lasers integrated into flow cytometers has also increased; even small benchtop flow cytometers are now equipped with at least three lasers (the cyan 488 nm, red ~640 nm and violet 405 nm “triad”), and often more (5,6). Ultraviolet, green, yellow, orange and near IR lasers are now available as options for specialized applications, with some advanced systems supporting up to ten or even more lasers simultaneously (4).
Nevertheless, ultraviolet (UV) lasers (traditionally ranging from 325 to 365 nm) remain an expensive and uncommon fixture on flow cytometers. The ability of water-cooled argon- and krypton-ion lasers on early cell sorters to produce UV wavelengths in the 351–365 nm range allowed the development of several important UV-excited probes for flow cytometry. The DNA dye DAPI and the Hoechst dyes (33342, 33258, and 34580) were useful for cell cycle analysis (7–9). The high affinity fluorescent calcium chelator indo-1 was essential for early studies in T cell activation, and also required a UV laser source (10,11). However, these limited applications coupled with the high costs associated with UV laser operation kept this laser source off all but the most advanced cytometers. These lasers were also large, making them impractical for benchtop cytometers. Air-cooled helium-cadmium (HeCd) have made appearances on both large cell sorters and some benchtop instruments (12–14). HeCd lasers however, suffer from low power levels, short lifetimes, and the development of high noise levels during their operational life.
Recent advances have changed this situation, both with regard to lasers and their targets. Gas UV lasers have been largely replaced by diode-pumped Nd:YVO4 solid state lasers, frequency tripled to produce a 355 nm laser line. These solid state sources are smaller than their gas counterparts, as well as smaller and easier to maintain. However, their cost remains very high, and they are still relatively large in size compared to modern visible laser technology. Cheaper near UV direct laser diodes (NUVLDs) emitting at approximately 375 nm were also developed using similar semiconductor chemistry to the more ubiquitous violet 405 nm source. NUVLDs excite DAPI and the Hoechst dyes well, and also excite the BUV dyes (15–17). But their slightly longer wavelength can interfere with detection of short wavelength probes like indo-1 and BUV395 (17).
The importance of UV for excitation has also increased. Hoechst 33342 has been found to be a substrate for the ABCG2 membrane pump, found at high levels in hematopoetic progenitor cells (18). Detection of Hoechst 33342 efflux from stem cells (the Hoechst side population or SP technique) assumed major importance in the early identification of stem cell populations, and required a UV laser source (18). Several important UV-excited dyes have also been developed, including viability dyes based on succinimydyl ester labeling; these so-called “live-dead” dyes could be incorporated into high-dimensional labeling panels where a detector aligned to a cyan, red or violet detector could not be spared (19). Quantum nanocrystals (Qdots), nanoscale semiconductor fluorescent probes, were adapted to flow cytometry and required a UV or violet laser source for excitation (20). The most important recent application for UV lasers, however, has been the recent development of the Brilliant Ultraviolet (BUV) dyes. These organic fluorochromes are based on the same polymer chemistry as the Brilliant Violet (BV) dyes being widely used for fluorescent immunophenotyping. The BV dyes increased the number of simultaneous markers detectable by flow cytometry to the mid-teens (21). The addition of six new BUV dyes (BUV95, BUV496, BUV563, BUV661, BUV737, and BUV805) will increase this number even further. A UV laser source is absolutely required to use these probes. As probe development pushes the simultaneous number of parameters to greater than twenty, a UV laser will become as important as a red or violet one.
The relatively limited technologies for producing UV laser wavelengths useful for flow cytometry has led to technology developments beyond the traditional 355 nm and NUVLD wavelengths. In this study, we evaluate a newly developed 320 nm diode pumped solid state (DPSS) laser source. While relatively short in wavelength compared to traditional source, it is close in wavelength to HeCd 325 nm sources. However, it possesses the stability, long life and low noise of other DPSS sources. It is also much smaller in size than comparable 355 nm laser sources. This laser wavelength was tested for variety of applications, including BUV dye excitation, Hoechst SP and indo-1, and was found suitable for all these applications. It represents the continued development of laser wavelengths useful for flow cytometry.
Materials and Methods
Cells
The human peripheral blood mononuclear cells (PBMCs) used in this study were lyophilized VeriCells™ (BioLegend, San Diego, CA USA), reconstituted in the included buffer and washed with HBSS containing 2% fetal bovine serum (FBS) prior to use. Mouse splenocytes and bone marrow were obtained from BALB/c mice between 8 and 20 weeks of age, maintained in the NCI Animal Facility under barrier and NIH approved housing conditions. Mice were euthanized using low concentration CO2 in accordance with NIH mandated guidelines. Spleens were removed and reduced to single cell suspensions using frosted microscope slides and 100 μM nylon mesh. Some splenocyte preparations were used fresh, while others were frozen in 90% FBS/10% dimethylsulfoxide (DMSO), stored, and rapidly thawed porior to use. Bone marrow was aspirated from removed femurs and tibias, disaggregated by pipet, and filtered through 100 μM nylon mesh. Representative forward versus side scatter plot for all cell types used in this study are shown in Supporting Information Figure S1.
Fluorescent Immunophenotyping
Both human and mouse cells were resuspended at 5 × 10⁶ cells/ml and labeled at 1 × 10⁶ cells/200 μl. For multicolor labeling, antibodies were added simultaneously and incubated for 30 min at 4°C. For BUV737 and BUV805 labeling, cells were labeled first with biotin-anti-mouse CD8a (clone 53–6.7) followed by streptavidin conjugates of BUV737 or BUV805 (all from BD Biosciences, San Jose, CA USA). Cells were then washed with HBSS containing 2% FBS and analyzed immediately with no fixation. The following antibodies were used: BUV395 anti-human CD3 (clone SK7, BD Biosciences, San Jose, CA), BUV395 anti-human CD4 (clone RPA-T4, BD Biosciences), BUV395 anti-human CD8a (clone RPA-T8, BD Biosciences), BUV496 anti-human CD4 (clone RPA-T4, BD Biosciences), BUV563 anti-human CD8a (clone RPA-T8, BD Biosciences), BUV661 anti-human CD3ε (clone UCHT1, BD Biosciences), BUV496 anti-mouse B220 (clone RA3–6B2, BD Biosciences), BUV563 anti-mouse CD4 (clone GK1.5, BD Biosciences), BUV 661 anti-mouse CD19 (clone 1D3, BD Biosciences), BUV661 anti-mouse CD45R/B220 (clone RA3–6B2, BD Biosciences), biotin anti-mouse CD8a (clone 53–6.7, BD Biosciences), BUV737-streptavidin and BUV805-streptavidin (BD Biosciences), BV421 anti-human CD3 (clone OKT3, BioLegend), BV510 anti-human CD8a (clone RPA-T8, BioLegend), BV605 anti-human CD45RA (clone HI100, BioLegend), BV650 anti-mouse/human CD44 (clone IM7, BioLegend), BV421 anti-mouse CD3 (clone 17A2, BioLegend), BV510 anti-mouse CD8a (close 53–6.7, BioLegend).
Hoechst and DCV SP Labeling
Mouse bone marrow was labeled for either Hoechst 33342 or DCV SP analysis according to (18) and (22). Cells were suspended in Dulbecco’s minimal essential media (D-MEM) containing 2% FBS and 5 mM HEPES buffer at 5 × 10⁶/cells/ml. Cells were initially labeled with PE-Cy7 anti-mouse Ly6A + E/Sca-1 (clone D7, BioLegend) and APC-Cy7 anti-mouse c-kit (clone 2B8) for 30 min at 4°C, followed by a biotin-conjugated lineage antibody cocktail to label T cells, B cells, monocytes/macrophages, granulocytes, and erythrocytes (CD3, CD45R/B220, CD11b, Terr119, and Gr-1 (BioLegend) followed by APC streptavidin (BioLegend). Cells were then washed in cold D-MEM containing 2% FBS and 5 mM HEPES, and resuspended at 5 × 10⁶ cells per ml. Five to 10 ml of each suspension (25–50 × 106 cells total) was pre-warmed in a waterbath to 37°C. For Hoechst SP labeling, Hoechst 33342 (Thermo Fisher Scientific, Carlsbad, CA USA) was added at 5 μl of a 1 mg/ml stock solution in ddH20 per ml of cell suspension for a final concentration of 5 μg/ml. For DyeCycle Violet (DCV) SP labeling, DCV (Thermo Fisher Scientific) was added at 4 μl of a 5 mM stock solution per ml of cell suspension, for a final concentration of 20 μM. For both dyes, cells were incubated at 37°C for 90 min. After incubation, cells were centrifuged at 400 × g for 5 min and resuspended in cold D-MEM containing 2% FBS and 5 mM HEPES buffer at 5 × 10⁶/cells/ml. Cells were stored at 4°C and analyzed within two hours of labeling.
Indo-1 Loading
Mouse splenocytes were loaded with indo-1 according to (23). Cells were suspended in RPMI-1640 containing calcium and magnesium with 2% FBS at 2 × 10⁶ cells/ml and pre-warmed in a waterbath to 37°C. Indo-1 acetyxomethyl ester (indo-1 AM, Thermo Fisher Scientific, single use 50 μg vials) was dissolved in dry DMSO to a final concentration of 1 mM, and added to the cell suspension (5 mls) to a final concentration of 2 μg/ml (1:500, 0.5 μl per ml). Cells were incubated at 37°C for 45 min with periodic mixing. Following incubation, cells were centrifuged at 400 × g for 7 min and washed with warm RPMI-1640 containing calcium and magnesium with 2% FBS followed and another centrifugation. Cells were resuspended at 2 × 10⁶ cells/ml and kept at 37°C until analysis. All indo-1 labeled samples were analyzed within one hour of loading. Ionomycin calcium salt (Thermo Fisher Scientific) was prepared as a 1 mg/ml stock in DMSO and added at 1 μl per ml (1:1000) for a final concentration of 2 μg/ml to induce calcium influx in indo-1 loaded cells.
Flow Cytometry with UV 355 and 320 Nm Lasers
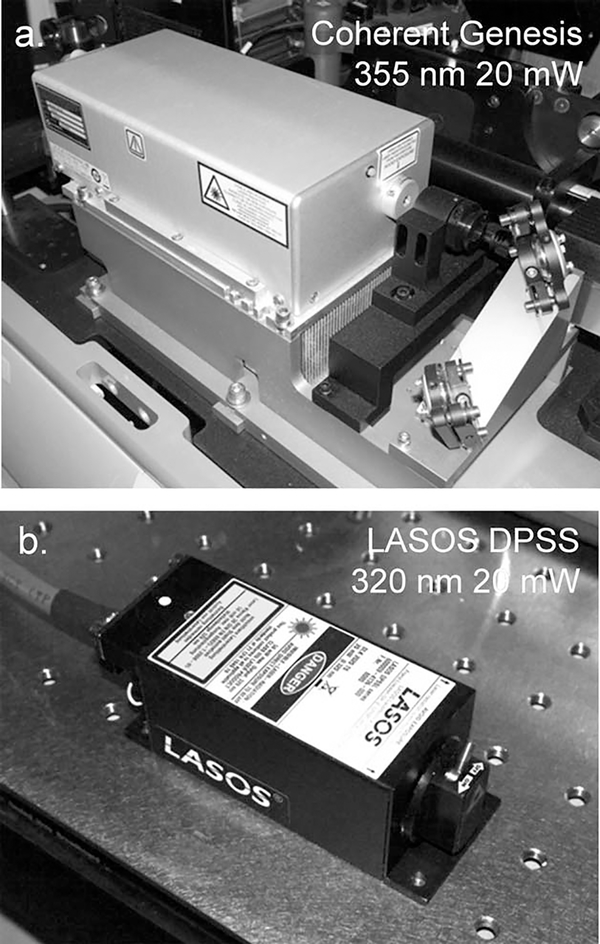
All experiments were performed on a LSR II (BD Biosciences) equipped with cyan 488 nm, red 640 nm, violet 405 nm and either an ultraviolet 355 or 320 nm laser. Both lasers are shown in Figure 1. The UV 355 nm 20 mW laser (Coherent Genesis, Coherent Laser, Mountain View, CA) was permanently installed on the instrument. The UV 320 nm 20 mW module (LASOS Lasertechnik, Jena, Germany, dimensions 100 mm × 39 mm × 39 mm) was installed temporarily, and the beam merged into the default laser paths using a 390LP dichroic (Semrock-IDEX, Rochester, NY USA), and UV mirrors to reflect the beam into the default UV laser path to the flow cell. Both conventional coated broadband UV mirrors (Thorlabs BB1-E01, rated for 350–400 nm, ThorLabs, Newton, NY USA) and UV-enhanced aluminum mirrors (Thorlabs PF10–03-F01, rated for 250–450 nm) were tested for 320 nm beam deflection. Beams waists for 355 and 320 nm lasers were approximately 0.8 and 0.6 μm respectively. Both beams were initially circular, then reshaped to elliptical using the default LSR II anamorphic beam shaping prisms. Total laser power loss following steering, transmission through the focusing optics and beam shaping prisms was <10% for both lasers. The same detector cluster, detectors, filters and dichroics were therefore used for experiments comparing 355 nm and 320 nm sources. Instrument alignment was adjusted and verified using Sphero 8 Rainbow eight population microspheres (Spherotech, Lake Forest, IL USA) and InSpeck Blue UV-excited seven population microspheres (Thermo Fisher Scientific).
Figure 1.
Ultraviolet laser sources. Coherent Genesis 355 nm laser, 20 mW (top), LASOS DPSS 320 nm laser, 20 mW (bottom).
Immunophenotypic Analysis
BUV dyes were excited with an ultraviolet 355 nm laser (20 mW) using the following filters: BUV395 with a 390/18 bandpass, BUV496 with a 500/24 nm bandpass and 488 nm restriction bandpass (notch), BUV661 with a 660/20 nm bandpass, BUV737 with a 740/13 nm bandpass, and BUV805 with an 810/10 nm bandpass. Three color BUV496, BUV563 and BUV661 labeling signals were separated with 640LP and 525LP reflecting dichroics. For comparisons between 355 and 320 nm lasers, all BUV signals in single labeled samples were analyzed using the first detector in the cluster, with no intervening dichroics. Detector voltages were kept constant between all 320 nm and 355 nm laser comparisons. BV dyes were usually excited with a spatially separated violet 405 nm laser. BV421 was detected with a 427/10 nm bandpass, BV510 with a 510/42 nm bandpass with 488 nm restriction bandpass (notch), BV605 with a 610/30 nm bandpass, and BV650 with a 660/20 nm bandpass. For five color labeling including BV605 and BV650, the two BV dyes were separated with a 635LP dichroic mirror. For some experiments, the BV dyes were excited with the ultraviolet sources to test incidental excitation of these probes. For these experiments, control data using a violet laser was achieved by aligning the violet laser to the ultraviolet detector cluster, so equivalent detectors and filters could be used for all lasers. Staining index (SI) was calculated for each labeled and background sample as using the formula [(Median labeled sample—Median background sample)/Robust Standard deviation 84th percentile).
Hoechst and DCV SP Analysis
Hoechst 33342 and DCV labeled cells were analyzed using both 355 and 320 nm laser sources. SP was analyzed using detectors with blue (427/10 nm) and red (660/20 nm) bandpass filters with a 580 nm longpass dichroic for signal separation Scaling was linear.
Indo-1 Analysis
Indo-1 loaded cells stimulated with ionomycin were also analyzed using both 355 and 320 nm laser sources. The indo-1 bound calcium signal was collected using a 390/18 nm bandpass. The indo-1 free calcium was collected using a 510/42 nm bandpass with 488 nm restriction bandpass (notch). Unstimulated cells were analyzed for 1 min, followed by rapid addition of ionomycin at 2 μg/ml and continued analysis to 4 min total. Fluorescence for both signals was collected in linear scaling.
Data Analysis
All data was analyzed with FlowJo version 7.6.5 for PC (FlowJo LLC, Ashland, OR). The ratio of indo-1 bound and free calcium data was expressed as a derived parameter.
Results
A 320 nm UV laser (LASOS) was tested for the excitation and detection of a variety of UV-excited fluorochromes, including the BUV dyes, Hoechst 33342, DyeCycle Violet and indo-1. It was directly compared to a conventional 355 nm laser source at the same power level. Both lasers are shown in Figure 1; the 320 nm laser was much smaller in size than the 355 nm unit, with the dimensions of a Coherent CUBE unit. Both laser sources were tested on the same cytometer, and aligned to the same detector cluster. As a result, the same mirrors, optical elements, detectors and filters were used for both laser sources, making the laser source the primary variable in the comparisons. Since the 320 nm wavelength is shorter than 355 nm, several mirror types were evaluated for delivery of the laser to the flow cell. A conventional UV coated broadband mirror with a recommended range of 350 to 400 nm and UV enhanced aluminum mirror with peak reflection from 250 to 400 nm were both tested. Both mirror types reflected 320 nm laser light with only ~10% loss of laser power. The UV compatible optics on the LSR II transmitted both 355 and 320 nm laser light with minimal power loss (data not shown).
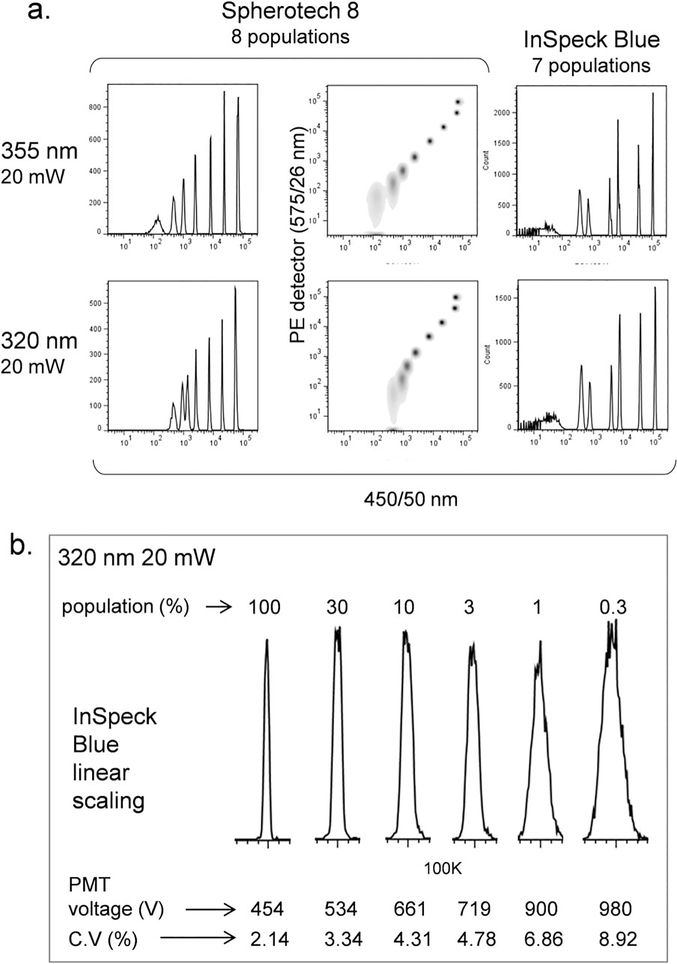
Both lasers were first tested using UV-excited alignment beads (Fig. 2). An eight population Spherotech 8 Rainbow microsphere mixture could be excited by both laser sources at the same relative intensity, although the unlabeled bead background was higher at 320 nm (Fig. 1a). The two brightest microspheres overlapped in intensity with both lasers and could only be distinguished by scatter. InSpeck Blue microspheres (Thermo Fisher) are more optimally excited in the UV, and a seven microsphere mixture was detected at almost identical intensity with both laser sources, with only slightly higher autofluorescence using the 320 nm source (Fig. 2a). Analysis of each Inspeck Blue population by linear scaling at 320 nm showed increased C.V.s for each dimmer subpopulation as expected. However, peak distributions were symmetrical, indicating a uniform beam profile and low noise for the 320 nm laser source (Fig. 2b).
Figure 2.
Fluorescent microsphere analysis with UV lasers. (a) Analysis of Sphero 8 Rainbow 8 population microspheres (left and middle column) and InSpeck Blue 7 population microspheres (right column) with UV 355 nm (top row) or 320 nm (bottom row) laser sources. Sphero 8 Rainbow microspheres are shown both as histograms (left column) and as scatterplots versus side scatter (middle column) to show two brightest populations, which were not distinguishable by fluorescence alone. Microsphere fluorescence was analyzed through a 450/50 nm filter. (b) InSpeck Blue microsphere populations analyzed in linear scaling with 320 nm laser excitation. Detector voltages were adjusted to normalize all population to the same scale value. Detector voltages and peaks C.V.s are shown at bottom.
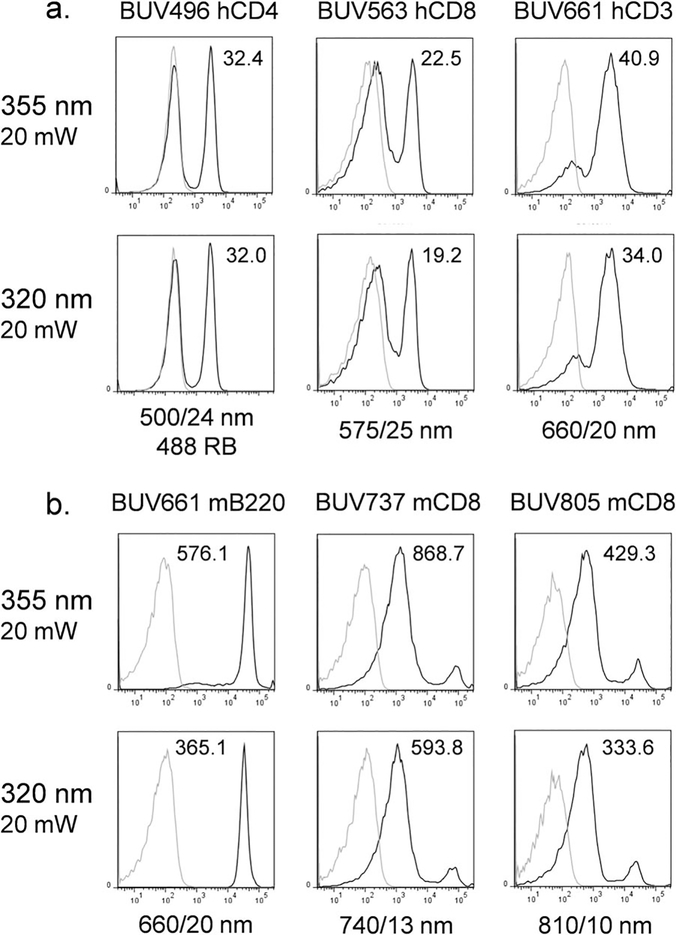
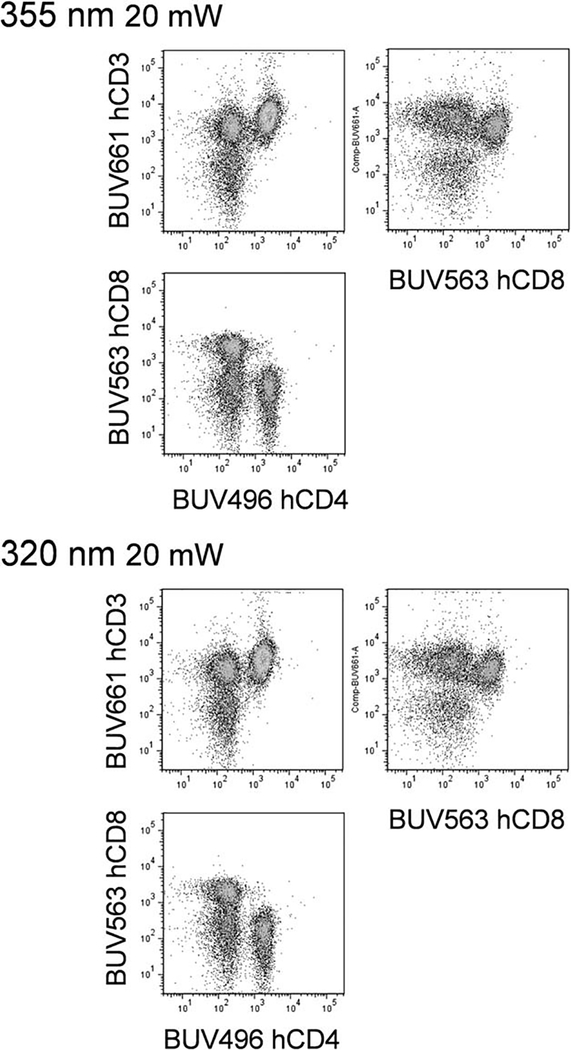
BUV dye detection sensitivity was then evaluated for both laser types (Fig. 3). BUV496, BUV563, BUV661, BUV737 and BUV805 conjugated antibodies were used to label either human PBMCs (Fig. 3a) or mouse splenocytes (Fig. 3b) and analyzed with both laser sources. Detector voltages were kept constant for all 320 nm versus 355 nm laser comparisons. As shown in Figure 3, the sensitivity was slightly higher using the 355 nm source based on staining indices, taking into account both labeled signal and autofluorescence of the unlabeled control. This difference was likely due to slightly decreased excitation of these BUV dyes by the 320 nm laser source. Background fluorescence was similar between laser types for these BUV dyes. In Figure 4, human PBMCs were simultaneously labeled with BUV496, BUV563 and BUV661, followed by analysis with both lasers. The staining profiles were very similar, with only minor loss of sensitivity with the 320 nm source.
Figure 3.
BUV fluorochrome analysis with UV lasers. (a) Analysis of human PBMCs labeled with BUV496 anti-human CD4 (left column), BUV563 anti-human CD8 (middle column) or BUV661 anti-human CD3 (right column) with UV 355 nm (top row) or 320 nm (bottom row) laser sources. Black curves, labeled cells; gray curves, unlabeled cells. Staining indices (SIs) are indicated on each histogram indicating the signal intensity for labeled versus unlabeled cells. (b) Analysis of mouse splenocytes (frozen/thawed) labeled with BUV661 anti-mouse CD45/B220 (left column), biotin anti-mouse CD8 followed by BUV737 streptavidin (middle column) or biotin anti-mouse CD8 followed by BUV805 streptavidin (right column) with UV 355 nm (top row) or 320 nm (bottom row) laser sources. Black curves, labeled cells; gray curves, unlabeled cells. Staining indices (SIs) are indicated on each histogram.
Figure 4.
Multicolor BUV fluorochrome analysis with UV lasers. (a) Analysis of human PBMCs labeled with BUV496 anti-human CD4, BUV563 anti-human CD8 and BUV661 anti-human CD3 with 355 nm (top scatterplots) or 320 nm (bottom scatterplots) laser sources.
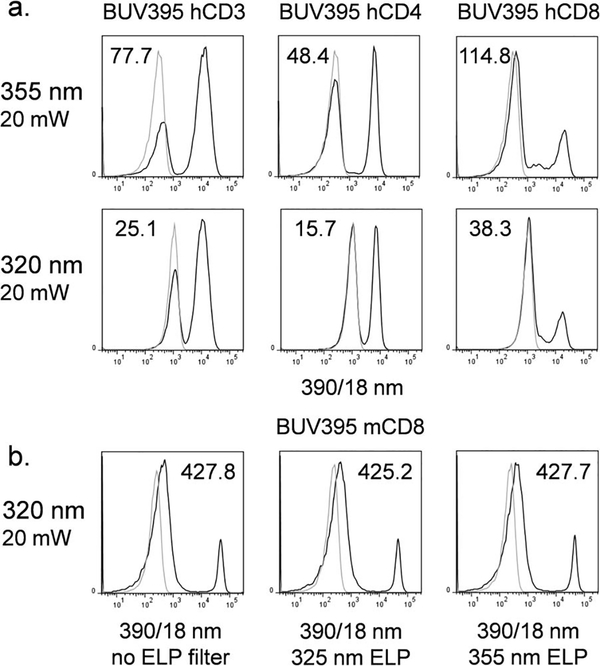
Higher autofluorescence was especially apparent with the short wavelength dye BUV395. In Figure 5a, human PBMCs were labeled with one of several BUV conjugated antibodies. The difference in staining index between 355 and 320 nm sources was more substantial, and apparently due to higher unlabeled sample backgrounds with the 320 nm laser in the <400 nm detection range, as evidenced by much higher background fluorescence. This increase was not due to the laser light itself penetrating the detector optics; this was a possibility, since typical bandpass filters may not be well blocked below 355 nm. Addition of 325 nm and 355 nm edge long pass filters, which blocked any 320 or 355 nm laser emission into the detector path, did not reduce background (Fig. 5b). BUV395 fluorescence was certainly detectable at 320 nm, but with reduced sensitivity due to high backgrounds.
Figure 5.
BUV395 analysis with UV lasers. (a) Analysis of human PBMCs labeled with BUV395 anti-human CD3 (left column), BUV395 anti-human CD4 (middle column) or BUV395 anti-human CD8 (right column) with UV 355 nm (top row) or 320 nm (bottom row) laser sources. Black curves, labeled cells; gray curves, unlabeled cells. Staining indices (SIs) are indicated on each histogram. (b) Analysis of mouse splenocytes labeled with BUV395 anti-mouse CD8 with a UV 320 nm laser. Fluorescence detection through a 390/18 nm filter alone (left scatterplot), a 390/18 nm filter and 325 nm edge longpass filter (middle scatterplot) or a 390/18 nm filter with 355 nm edge longpass filter (right scatterplot). Black curves, labeled cells; gray curves, unlabeled cells. Staining indices (SIs) are indicated on each histogram indicating the signal intensity for labeled versus unlabeled cells.
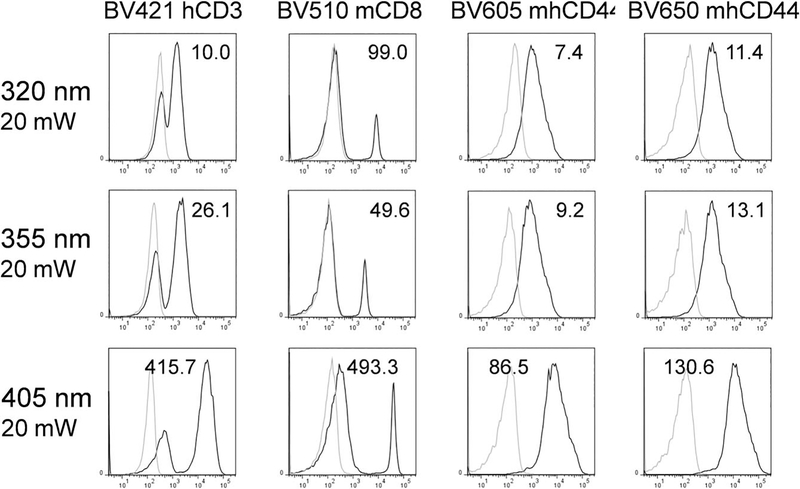
While BUV and Brilliant Violet (BV) dyes are usually excited with UV and violet lasers respectively, violet lasers can excite BUV dyes and UV lasers excite BV dyes to some extent. The amount of this unwanted incidental excitation is important, since it will produce spectral overlap between BUV and BV, requiring compensation. The ability of 355 and 320 nm lasers to incidentally excite BV421, BV510, BV605, and BV650 is shown in Figure 6, in comparison with the normal 405 nm laser. As expected, the 355 nm laser excited BV dyes at about 5–10% the level of the violet for most BV dyes Excitation with the 320 nm was even less, with the exception of BV510, which was reproducibly excited somewhat better at 320 nm than 355 nm. It could therefore be expected that using a 320 nm laser as a UV source might reduce the compensation between some spectrally adjacent BUV and BV dyes. This was tested in Figure 7, where mouse splenocytes were labeled with antibodies conjugated to BUV496, BUV563, BUV661, BV421, and BV510. The labeling distributions and compensation were very similar with both laser sources. The spectral overlap of BV510 into the BUV496 and BUV563 detectors was slightly higher than that observed with the 355 nm source, although the increase was small. This is likely due to the ability of the 325 nm laser to incidentally excite BV510 more than other BV dyes. This is in agreement with predicted compensation values based on spectral data for 325 and 355 nm lasers (24). In any case, BUV and BV dyes remained compatible with both UV laser sources, with only small changes in required compensation.
Figure 6.
BV fluorochrome incidental excitation with UV lasers. (a) Analysis of human PBMCs labeled with BV421 anti-human CD3 (left column), BV510 anti-human CD8 (second column from left), BV605 anti-mouse/human CD44 (second column from right) or BV650 anti-mouse/human CD44 (right column) with UV 320 nm (top row), 355 nm (middle row) or 405 nm (bottom row) laser sources. Black curves, labeled cells; gray curves, unlabeled cells. Staining indices (SIs) are indicated on each histogram indicating the signal intensity for labeled versus unlabeled cells.
Figure 7.
Multicolor BUV/BV fluorochrome analysis withUV lasers. (a) Analysis of mouse splenocytes (frozen/thawed) labeled with BUV496 anti-mouse B220, BUV563 anti-mouse CD4, BUV661 anti-mouse CD19, BV421 anti-mouse CD3 and BV510 anti-mouse CD8a with 355 nm (top scatterplots) or 320 nm (bottom scatterplots) laser sources. Compensation matrices (FlowJo) are shown for each five color analysis.
The UV excited Hoechst dyes and DAPI are often used as DNA binding dyes for stoichiometric DNA content analysis. Hoechst 33342 is cell permeable, and allows DNA cell cycle analysis in viable cells. Efflux of Hoechst 33342 from hematopoetic stem cells and progenitors by ABC superfamily organic anion membrane pumps is a stem cell marker; the so-called Hoechst 33342 side population (SP) technique remains an important assay for stem cell identification, and requires a UV laser. In Figure 8, mouse bone marrow as labeled for the stem cell markers Sca-1, c-kit, and a panel of mature cell lineage markers, followed by Hoechst 33342. After incubation at 37°C to allow dye efflux, the cells were analyzed using either 355 or 320 nm sources, gated on either all cells, lineage-negative cells, or lineage negative cells positive for Sca-1 and c-kit. The Hoechst SP could be clearly discriminated with both laser sources, and shows clear enrichment in the lineage negative Sca-1 positive c-kit positive subpopulations. The overall form of the cell cycle distribution and side population was slightly different using the lower wavelength laser, possibly due to differential excitation of DNA bound and free Hoechst 33342. However, the side population was still clearly visible and distinguishable.
Figure 8.
Hoechst and DCV side population analysis with UV lasers. (a) Hoechst 33342 side population analysis of mouse bone marrow. All cells (left column), lineage-negative cells (middle column) and lineage negative Sca-1 positive c-kit-positive cells (right column) with UV 355 nm (top row) or 320 nm (bottom row) laser sources. Percentage cells in the side population are shown in each dotplot. (b) DyeCycle Violet (DCV) side population analysis of mouse bone marrow. All cells (left column), lineage-negative cells (middle column) and lineage negative Sca-1 positive c-kit-positive cells (right column) with UV 355 nm (top row) or 320 nm (bottom row) laser sources. Percentage cells in the side population are shown in each scatterplot.
DyeCycle Violet (DCV) is another cell-permeable DNA dye that is structurally similar to Hoechst 33342 but with an excitation spectra shifted toward the visible violet. It is often substituted for Hoechst 33342 in instruments with violet lasers, but is still well-excited by UV sources. In similarly labeled mouse bone marrow labeled with DCV, the DCV side population was also clearly visible with both laser sources, with similar enrichment in the stem cell subpopulation. Again, the overall form of the side population differed slightly between laser sources, but this did not interfere with side population discrimination. Hoechst and DCV SP could therefore both be performed using a 320 nm laser.
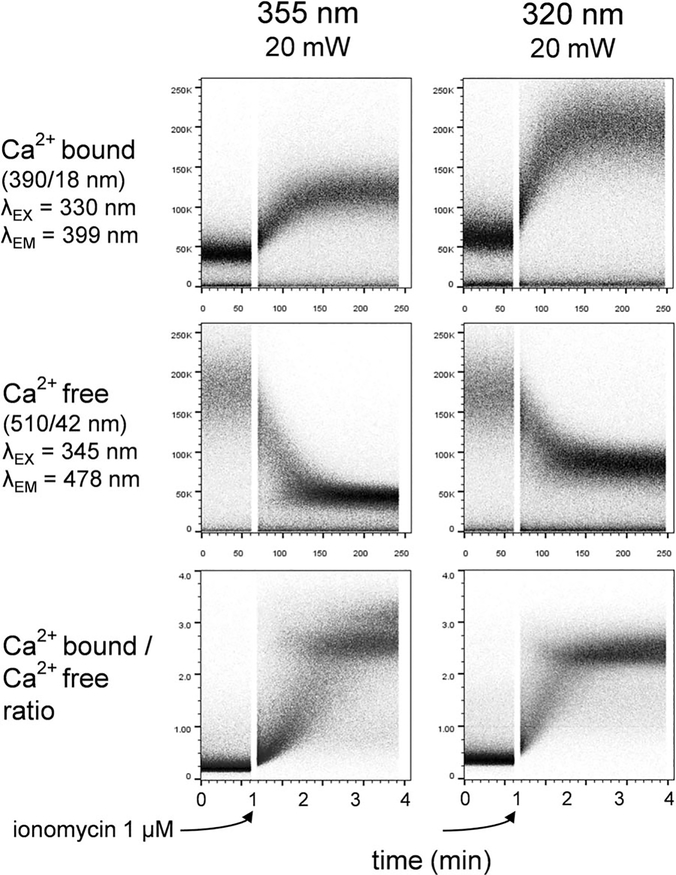
The fluorogenic calcium chelator indo-1 remains the best high-affinity probe for measuring nanomolar to micromolar calcium influx in lymphocytes and other cell types. The cell-permeable acetoxymethyl ester form of probe is loaded into live cells, which can then be induced to undergo calcium influx/translocation by receptor-mediated signal transduction. Indo-1 is excited using a UV laser source. Indo-1 bound to calcium fluorescences at ~390 nm, while unbound indo-1 fluorescences at ~490 nm. Measurement of the ratio between these two emission ranges allows measurement of the intracellular calcium concentration. In Figure 9, mouse splenocytes were loaded with indo-1, and analyzed by flow cytometry using either 355 or 320 nm sources. The cells were treated at the one minute mark with ionomcyin, a calcium ionophore that induces a sustained uptake of calcium into the cells from outside the cell and from intracellular stores. The increase in bound indo-1 fluorescence at 390 nm, the decrease in unbound indo-1 at ~490 nm, and the ratio between the two is shown. Calcium influx was readily detectable with both UV lasers. Interestingly, the magnitude of the calcium-bound fluorescence was less at 355 nm than at 320 nm; the inverse was true for the calcium-free signal. This is consistent with the excitation and emission peaks for both forms of the probe, which are not identical. The excitation maxima for the calcium-bound form is 330 nm, suggesting that it will be better excited by the 320 nm laser. Conversely, the excitation maxima for the calcium-free form is 345 nm, explaining its better excitation by the 355 nm laser. Despite these differences, the ratio between bound and free forms was the same regardless of which laser is used (Figure 9, bottom scatterplots). Both laser wavelengths were therefore useful for indo-1 excitation.
Figure 9.
Indo-1 analysis with UV lasers. Time curves of indo-1 calcium-bound fluorescence (top row), calcium free fluorescence (middle row) and the bound/free ratio (bottom row) using UV 355 nm (left column) or 320 nm (right column) laser sources. Data was collected from fresh mouse splenocytes.
Discussion
This study compared power-matched ultraviolet 355 and 320 nm lasers for their utility in exciting a variety of fluorescent probes. Both laser wavelengths provided sufficient excitation for all probes tested. The 355 nm source gave somewhat better excitation of the longer wavelength BUV dyes (BUV496, BUV563, BUV661, BUV737 and BUV805), likely due to better excitation at the 355 nm wavelength. However, BUV fluorescence at 320 nm was only slightly <355 nm. Cellular autofluorescence generated by the 320 nm laser was not significantly higher than that observed for 355 nm for the longer wavelength BUV dyes. However. autofluorescence with 320 nm excitation was significant in the detection range for the shorter wavelength probe BUV395, and caused a substantial loss of sensitivity when labeling with this probe. This higher background was not due to the laser light itself, but appeared to be entirely due to cellular autofluorescence. BUV395 could therefore be used with 320 nm excitation, but only with strongly expressed markers.
Both 355 and 320 nm lasers gave good excitation of Hoechst 33342 and DCV side population, allowing identification of stem cells and progenitors using this technique. The calcium probe indo-1 was similarly well-excited with both laser wavelengths, the difference observed consistent with the excitation maxima of the calcium bound and free forms of the probe. The inexpensive near UV 375 nm laser cannot be used to excite indo-1, requiring a shorter wavelength UV laser. In summary, the 320 nm laser was found to be useful as a UV source for flow cytometry, with the caveats above.
Although 320 nm is shorter than most UV laser sources employed in flow cytometry, it has a precedent in the HeCd laser, which emits at 325 nm. Until recently, the HeCad laser was the only practical air-cooled UV laser source that could be integrated into a flow cytometry (12–14). They were used in several stream-in-air and cuvette cytometer systems, including the original BDIS LSR system. At the time, their main application was UV excited DNA dyes for cell cycle and chromosome analysis and indo-1, allowing these probes to be used on benchtop systems. However, they had several serious drawbacks. They were relatively short-lived, and developed high noise levels, particularly if they were not frequently operated. They were also relatively low in power, usually <25 mW. They were also large by modern standards, about half the size of a water-cooled gas laser. While both 320 and 325 nm wavelengths are “short” by biomedical research standards, they are still considered to be long wave UV by photonic definitions. Optical elements already used for UV transmission and steering in flow cytometers were compatible with this lower wavelength as well.
While 320 nm excitation and detection of most BUV dyes was found to be close to 355 nm, they were slightly lower. UV 320 nm laser light is not absolutely optimal for BUV dye excitation; spectral data for BUV dye excitation at 325 nm (the closest wavelength available) is predicted to be >50% than using a 355 nm source (24). However, spectral data, usually collected on spectrofluorimeters using soluble dye, is not always a reliable predictor for fluorochrome intensity in actual cell labeling. The predicted excitation of the BUV dyes with a near UV 375 nm laser is <25%, while actual labeling shows intensities close to the 355 nm optimum (17). Cellular autofluorescence is a large contributor to experimentally determined labeling intensity, and is not taken into account in most spectral measurements. UV 320 nm laser light does indeed appear to excite greater autofluorescence than 355 and NUVLD 375 nm laser sources based on the apparent brightness of unlabeled cells in this study. This should be kept in mind when employing lasers in the UV, and is likely to increase as excitation wavelength increases.
Another reason to consider a DPSS 320 nm laser source for flow cytometry is its small size. Nd:YVO4 355 nm lasers are still relatively large for low-power lasers. Even the most recent Coherent OBIS 355 nm laser module is still several times larger than the 320 nm unit, which has the same form factor as a Coherent CUBE unit (100 mm × 37 mm × 37 mm). The DPSS 320 nm unit also required minimal cooling, using only a passive heat sink to vent excess heat. UV 320 nm laser light can also be used to excite short wavelength probes like indo-1 are not practical with 375 nm diode sources. UV 320 nm is therefore a viable option for providing UVexcitation on a flow cytometer.
Supplementary Material
Footnotes
Additional Supporting Information may be found in the online version of this article.
Literature Cited
- 1.Shapiro H. Practical flow cytometry. New York, NY: John Wiley and Sons, 2003, pp. 124–149. [Google Scholar]
- 2.Shapiro HM, Telford WG. Lasers for flow cytometry. In: Robinson JP, Darzynkiewicz Z, Dobrucki J, Hoffman RA, Nolan JP, Orfao A, Rabinovitch PS, editors. Current Protocols in Cytometry Unit 1.9. New York, NY: John Wiley and Sons; 2009. [Google Scholar]
- 3.Shapiro HM. Trends and developments in flow cytometry instrumentation in clinical flow cytometry. Ann N YAcad Sci 1993b;677:155–166. [DOI] [PubMed] [Google Scholar]
- 4.Telford WG. Lasers in flow cytometry. In: Darzynkiewicz Z,. editors. Recent Advances in Cytometry, Methods in Cell Biology, Volume 102. New York, NY: Academic Press; 2011. pp. 375410. [DOI] [PubMed] [Google Scholar]
- 5.Doornbos RMP, De Grooth BG, Kraan YM, Van Der Poel CJ, Greve J. Visible diode lasers can be used for flowcytometric immunofluorescence and DNA analysis. Cytometry 1994;15:267–271. [DOI] [PubMed] [Google Scholar]
- 6.Shapiro HM, Perlmutter NG. Violet laser diodes as light sources for cytometry. Cytometry 2001;44:133–136. [DOI] [PubMed] [Google Scholar]
- 7.Lalande ME, Miller RG. Fluorescence flow analysis of lymphocyte activation using Hoechst 33342 dye. J Histochem Cytochem 1979;27:394–400. [DOI] [PubMed] [Google Scholar]
- 8.Loken MR. Simultaneous quantitation of Hoechst 33342 and immunofluorescence on viable cells using a fluorescence activated cell sorter. Cytometry 1980;1:136–142. [DOI] [PubMed] [Google Scholar]
- 9.Steinkamp JA, Stewart CC, Crissman HA. Three-color fluorescence measurements on single cells excited at three laser wavelengths. Cytometry 1982;2:226–231. [DOI] [PubMed] [Google Scholar]
- 10.Grynkiewicz G, Poenie M, Tsien RY. A new generation of Ca2+ indicators with greatly improved fluorescence properties. J Biol Chem 1985;260:3440–3450. [PubMed] [Google Scholar]
- 11.Rabinovitch PS, June CH, Grossmann A, Ledbetter JA. Heterogeneity among T cells in intracellular free calcium responses after mitogen stimulation with PHA or anti-CD3. Simultaneous use of indo-1 and immunofluorescence with flow cytometry. J Immunol 1986;137:952–961. [PubMed] [Google Scholar]
- 12.Bigler RD. A comparison of low power helium-cadmium and argon ultraviolet lasers in commercial flow cytometers. Cytometry 1987;8:441–444. [DOI] [PubMed] [Google Scholar]
- 13.Snow C, Cram LS. The suitability of air-cooled helium cadmium (HeCad) lasers for two color analysis and sorting of human chromosomes. Cytometry Suppl 1993;6:20. [Google Scholar]
- 14.Frey T, Stokdijk W, Hoffman RA. Bivariate flow karyotyping with air-cooled lasers. Cytometry Suppl 1993;6:71. [DOI] [PubMed] [Google Scholar]
- 15.Telford WG, Frolova EG. Discrimination of Hoechst side population in mouse bone marrow with violet and near-UV laser diodes. Cytometry A 2004;57A:45–52. [DOI] [PubMed] [Google Scholar]
- 16.Telford WG. Analysis of UV-excited fluorochromes by flow cytometry using a near-UV laser diode. Cytometry A 2004;61A:9–17. [DOI] [PubMed] [Google Scholar]
- 17.Telford WG. Near ultraviolet laser diodes (NUVLDs) for Brilliant Ultraviolet fluorophore excitation. Cytometry A 2015;87A:1127–1137. [DOI] [PMC free article] [PubMed] [Google Scholar]
- 18.Goodell MA, Brose K, Paradis G, Conner AS, Mulligan RC. Isolation and functional properties of murine hematopoietic stem cells that are replicating in vivo. J Exp Med 1996;183:1797–1806. [DOI] [PMC free article] [PubMed] [Google Scholar]
- 19.Perfetto SP, Chattopadhyay PK, Lamoreaux L, Nguyen R, Ambrozak D, Koup RA, Roederer M. Amine-reactive dyes for dead cell discrimination in fixed samples. In: Robinson JP, Darzynkiewicz Z, Dobrucki J, Hoffman RA, Nolan JP, Orfao A, Rabinovitch PS, editors. Current Protocols in Cytometry, Unit 9.34. Hoboken, NJ: John Wiley and Sons; 2010. [DOI] [PMC free article] [PubMed] [Google Scholar]
- 20.Chattopadhyay PK, Price DA, Harper TF, Betts MR, Yu J, Gostick E, Perfetto SP, Goepfert P, Koup RA, De Rosa SC, et al. Quantum dot semiconductor nanocrystals for immunophenotyping by polychromatic flow cytometry. Nat Med 2006;12: 972–977. [DOI] [PubMed] [Google Scholar]
- 21.Chattopadhyay PK, Gaylord B, Palmer A, Jiang N, Raven MA, Lewis G, Reuter MA, Nur-ur Rahman AK, Price DA, Betts MR, et al. Brilliant violet fluorophores: a new class of ultrabright fluorescent compounds for immunofluorescence experiments. Cytometry Part A 2012;81A:456–466. [DOI] [PubMed] [Google Scholar]
- 22.Telford WG. Stem cell side population and sorting using DyeCycle Violet. In: Robinson JP, Darzynkiewicz Z, Dobrucki J, Hoffman RA, Nolan JP, Orfao A, Rabinovitch PS, editors. Current Protocols in Cytometry, Unit 9.30. Hoboken, NJ: John Wiley and Sons; 2009. [Google Scholar]
- 23.June CH, Moore JS. Measurement of intracellular ions by flow cytometry. In: Robinson JP, Darzynkiewicz Z, Dobrucki J, Hoffman RA, Nolan JP, Orfao A, Rabinovitch PS, editors. Current Protocols in Cytometry Unit 5.5. Hoboken, NJ: John Wiley and Sons; 2004. [Google Scholar]
- 24.BD Biosciences Spectrum Viewer. http://www.bdbiosciences.com/us/s/spectrumviewer.
Associated Data
This section collects any data citations, data availability statements, or supplementary materials included in this article.


