Abstract
BACKGROUND AND PURPOSE: Although research with functional MR imaging of the brain has proliferated over the past 5 years, technical limitations, such as motion, chemical shift, and susceptibility artifacts, have impeded such research in the human spinal cord. The purpose of this investigation was to determine whether a reliable functional MR imaging signal can be elicited from the cervical spinal cord during simple motor activity.
METHODS: Subjects performed three different motor tasks that activate different segments of the spinal cord. Gradient-echo-planar imaging on a 1.5-T clinical unit was used to image cervical spinal cords of human subjects. Another group of subjects was imaged while performing isometric exercise to study the relationship between the blood oxygenation level–dependent (BOLD) signal and applied force.
RESULTS: Task-dependent BOLD activity was detected in all subjects. Signal amplitude varied between 0.5% and 7%. Moreover, a linear relationship was found between the applied force and the signal amplitude during isometric exercise. While regions of activation were distributed throughout the spinal cord, concentrated activity was found in the anatomic locations of expected motor innervation.
CONCLUSION: The functional MR imaging signal can be reliably detected with motor activity in the human cervical spinal cord on a 1.5-T clinical unit. The location of neural activation has an anatomic correspondence to the myotome in use. The strength of the BOLD signal is directly proportional to the level of muscular activity.
Since its introduction in 1990, functional MR imaging has been widely used to study brain physiology (1). Extension of functional MR imaging beyond the brain to the spinal cord is of great potential value in both basic research and clinical settings. Current understanding of human spinal cord physiology is inferred from animal models, and a noninvasive method to assess human spinal cord function would prove invaluable in extending our understanding of human spinal cord function.
Although the volume of published brain functional MR imaging literature has grown dramatically over the past decade, the number of published investigations into functional MR imaging of the spinal cord is limited, suggesting that significant technical challenges are associated with eliciting the blood oxygenation level–dependent (BOLD) effect from the spinal cord. Most of these problems can be categorized into limitations imposed by spatial resolution, periodic motion, and hemodynamic washout. Periodic pulsatory motion of the CSF and the spinal cord itself during the cardiac and respiratory cycles produces significant degradation of the functional MR imaging signal and artifacts from misregistration (2–7). The cross-sectional diameter of the human spinal cord (< 10 mm) presents a significant technical challenge with regard to spatial resolution on clinical-grade 1.5-T units. As observed in the cerebral cortex, neural activity in the spinal cord elicits a proximal hemodynamic change in capillaries and small vessels (8, 9). Moreover, washout effects from larger pial vasculature can obscure the functional MR imaging signal in the smaller central gray matter (8, 10–12). Despite these challenges, three previous independent investigations have found signals originating from the spinal cord associated with neural activity (13–15). All prior studies had limited temporal resolution and none showed task dependency. Using the breath-hold technique to reduce motion and a modified fast low-angle shot (FLASH) sequence on a 3.0-T unit, Stroman et al (13) achieved the highest temporal resolution (about 20 seconds). A substantially lower temporal resolution (2 minutes) was obtained by Yoshizawa et al (14) and Porszasz et al (15) by using the rapid acquisition relaxation enhancement technique on a 4.7-T unit and a FLASH sequence on a 1.5-T unit. A significant limitation of these studies is that the rise and decay times for the hemodynamic response to evoked neural activity (5–9 seconds) could not be resolved in such a prolonged temporal window.
The purpose of this investigation was 1) to determine whether the functional MR imaging signal can be reliably measured on a 1.5-T clinical system, 2) to determine whether the functional MR imaging signal can be spatially localized to particular neuroanatomic locations specific to focal upper extremity motor tasks, and 3) to establish a relationship between applied force and strength of the functional MR imaging signal during isometric contraction.
Methods
Imaging and Motion Artifact Suppression
Subjects were recruited according to institutional review board guidelines and imaged with an echo-speed 1.5-T clinical MR unit. A standard commercial receiver-only neck coil was used for all functional MR imaging experiments. The coil selected has a constant frequency response around the resonance frequency. Signal was augmented by elevating the neck as far forward as possible within the coil. Subject motion was reduced by the use of a chin strap.
Spinal cord and CSF motion are problematic in spinal cord functional MR imaging. To correct for interimaging motion, we used a 3D rigid body alignment to align images to the first time point. The more critical motion is that within the images. Ultrafast imaging techniques, such as single-shot echo-planar imaging (EPI) with high bandwidth, is normally used to reduce this effect. With EPI, artifacts produced by motion, susceptibility effects, magnetic field inhomogeneity, and off-resonance are a major concern along the phase-encoding axis. Several solutions have been proposed to address this problem: reducing the acquisition time, increasing the phase-gradient amplitude or its duration, and using interleaved multishot EPI, which acquires the image with multiple radio-frequency excitations.
In this study, we used ramp sampling (sampling the echoes during readout gradient rise and decay periods), which reduces the acquisition time and thus the motion artifacts. It further reduces susceptibility and chemical-shift artifacts; however, it increases the high-frequency noise. The increase in high-frequency noise was dealt with by applying a band-pass filter and increasing the number of acquired images to compensate for the reduced degrees of freedom.
Motor Tasks
Six healthy right-handed male subjects were recruited for a study on BOLD signal localization as a function of a specific upper extremity motor task. Three separate experiments were performed on three of the subjects for all three of the motor tasks. The remaining three subjects were tested for only two of the tasks. The dominant, right arm was used in all cases. In total, 15 sets of functional MR imaging data were collected for the six subjects.
The three motor tasks used in this study were modified from a set of standard clinical tests designed to test the strength of individual muscle groups in the upper extremity (16, 17). The key muscle groups tested were the elbow flexors (biceps), the wrist extensors (extensor carpi radialis longus and brevis), and the small finger abductor (abductor digiti minimi). These muscle groups were chosen primarily because motor innervation is represented by distinct segments of the cervical spinal cord: biceps (cervical segments C5 and C6), wrist extensors (cervical segments C6 and C7), and hand abductors (C8 and T1).
For the biceps flexion task, three subjects flexed the forearm about the elbow from 0° to 90° and then extended the arm back to 0° while keeping the upper arm flat on the imaging bed. In the wrist extension task, six subjects dorsiflexed the pronated clenched fist against no resistance about the wrist while keeping the forearm at rest on the imager table beside their body. After maximal extension, the fist was returned to its initial rest position in contact with the table. The finger abduction task (performed by all six subjects) required subjects to alternate hand positions, first spreading their fingers wide apart (abduction) and then bringing them close together (adduction) with the hand pronated and the forearm in a rested, horizontal position on the imager table. All movements (biceps flexion, wrist extension, and finger abduction) were repeated at a rate of one or two every second.
Isometric Testing
The relationship between the BOLD signal amplitude and an applied force during an isometric exercise was investigated in four subjects (aged 20–50 years). The subjects were imaged during isometric exercise of the biceps muscle using variable-resistance weights. Subjects held a plastic container in the palm of their hand that was filled with incremental quantities of salt. The forearm, wrist, and hand were held against a rigid board to prevent wrist motion. Subjects were instructed to hold a series of different weights for 30-second intervals in a fixed flexed-arm position. The weights were presented to the subjects in a random sequence. The four weights ranged from 0.3 to 1.2 kg in 0.3 increments. In the rest position, subjects held a very small weight, 0.026 kg, in the same arm position. Subjects bent their fingers to hold the weights during the study period.
Experimental Design
Evoked response to these tasks was studied using a block experimental design. During the isometric exercise, subjects performed 16 cycles in which they held each of the different weights for 30 seconds followed by 30 seconds of rest. For the remaining tasks, each subject performed a given task for 30 seconds followed by 30 seconds of rest for eight cycles. Imaging parameters were 3000/50 (TR/TE), a flip angle of 90°, a 128 × 128 matrix with a 16-cm field of view (FOV) for the isometric task and a 14- or 20-cm FOV for all other tasks, depending on the subject's neck size. Subjects were imaged in the sagittal plane, and six sections were acquired with a section thickness of 4 mm for the isometric trials and 5 or 6 mm for all other trials, with the frequency gradient along the short axis of the spinal cord to avoid the effect of spinal cord motion along the readout axis.
Three subjects were also imaged in the axial plane while performing the wrist extension paradigm. Imaging parameters were as described above, with the FOV set at 20 cm and a section thickness of 1 cm. The acquired images extended to the seventh vertebra only. At the lower vertebral levels, the images were distorted, which prevented their use in the analysis.
Analysis
SPM99 software (Wellcome Department, University College of London) was used for processing and statistical analysis. Images were first cropped to a rectangular view that included the spinal cord and vertebral bodies. The images were then aligned and filtered (spatially and temporally). Finally, activation was detected by using general linear model statistics.
All data were registered, on a subject-by-subject basis, to the first volume acquired. The computed rigid body parameters were used in image resectioning and adjusting for serial time correlations (first order) as described by Friston et al (18). Motion parameters for two subjects were excessive for the last four on/off cycles during one task and therefore aligned poorly; these cycles were eliminated from analysis. Aligned images were spatially smoothed in-plane with a gaussian filter (full width at half-maximum = two voxels) to enhance the signal-to-noise ratio. Although this reduces spatial resolution, the second phase of the BOLD signal, the only phase accessible with a 1.5-T imager, is spatially diffuse by nature and the filtering consequence is minimal. To improve BOLD signal detection, a temporal gaussian kernel with a cutoff frequency of 120 seconds and sigma of 2.8 seconds was applied to the acquired data and the modeled design matrix. This in effect acts as a band pass filter. The degrees of freedom were adjusted for their reduction caused by temporal filtering (19). A voxel-based t test was applied to evaluate changes in mean signal intensity between the off and on states. Data were analyzed without normalizing mean signal intensity to global signal changes to limit false-positive errors (20). The signal change due to evoked activity was modeled as a convolution of a hemodynamic response function, which can be described as a summation of two gamma functions (19) with a boxcar function. This response takes into account a 6-second rise time as well as a 15-second poststimulus undershoot. An uncorrected P value of less than .05 and clusters of κ greater than five voxels were used to identify active regions in the spinal cord segments. A region of activation was defined by an incremental increase in the BOLD signal correlating with activity; that is, an increase of oxyhemoglobin (a decrease of deoxyhemoglobin) and the resultant hemodynamic response of increased local blood flow. Deactivation was defined as a decrease in BOLD signal correlating with activity; that is, a direct negative correlation with the BOLD response, possibly corresponding to a negative hemodynamic response. Areas of activation and deactivation were generated simultaneously in various locations with the spinal cord.
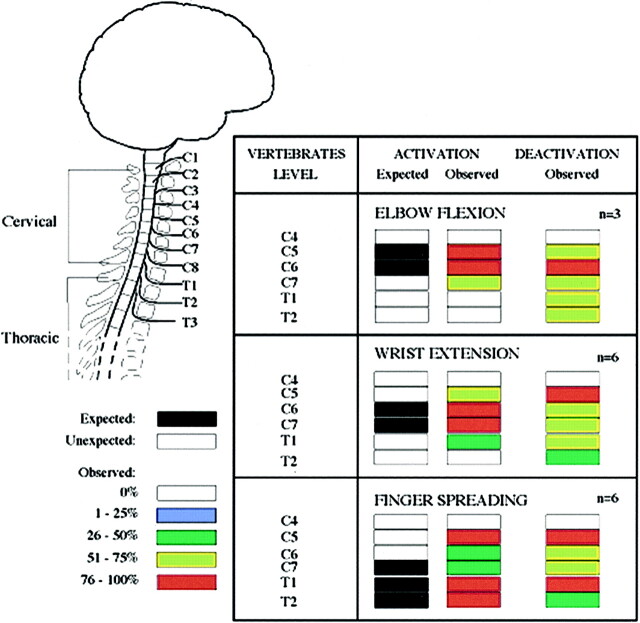
The anatomic location of a site of activation or deactivation in the spinal cord was referenced to the closest adjacent vertebral body. The anatomic locations for spinal cord activation were summated by task for all subjects and expressed in a graphic format (Fig 1).
fig 1.
Activation/deactivation sites (increased/decreased BOLD signal) evoked by three different motor tasks: elbow flexion, wrist extension, and finger spreading. Chart shows frequency of significant signal increases or decreases, on a segment-by-segment basis, across the subjects imaged (elbow flexion, n = 3; wrist extension and finger spreading, n = 6)
To further reduce the effect of subject motion in our analysis, the motion parameters were included and the activation/deactivation regions that correlated with motion were excluded. If the motion parameters followed the task paradigm, then this method might have produced false-negative results.
To analyze the images acquired during the isometric task, a vector (W) representing the time series of the applied force was used to detect voxels correlating with W zero order, first order, and second order. Zero-order activation tests for voxels with a mean signal greater than baseline, whereas first-order activation tests for voxels that have a better fit between linear response and applied force, and second-order activation tests for voxels that have a better fit between second-order response and applied force.
Results
Distribution of Activation Response as a Function of Motor Task
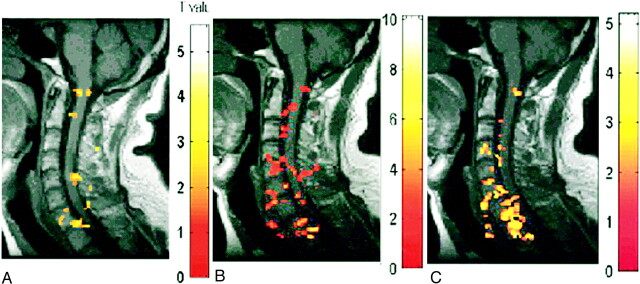
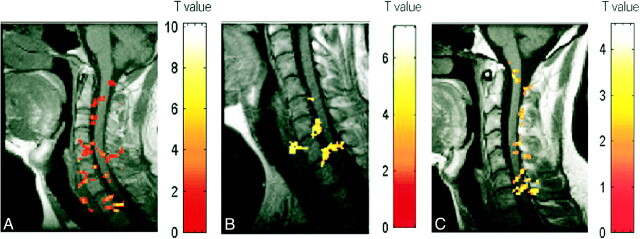
Figure 1 shows the proportion of subjects exhibiting areas of activation in the sagittal view at each anatomic location in the spinal cord (C4–T2). In all subjects, the distribution of detected activity varied with the task (Fig 2) but remained, for the most part, consistent across subjects (Fig 3). Moreover, the observed location of activity for each task primarily matched expected anatomic locations on the basis of known innervation patterns of the tested muscle groups (Fig 1). For example, elbow flexion (biceps) elicited a functional MR imaging signal in the expected locations of C5 and C6 for all three subjects (Figs 1 and 3). Similarly, wrist extension, which is performed by the extensor carpi radialis longus and brevis muscles, should elicit activity at approximately the C6 and C7 locations, as was observed in five of the six subjects tested. Activation of additional adjacent segments was observed in most cases; however, this was less consistent across subjects. For finger abduction, activity is expected in C7–T1. It was found in T1 for all six subjects and in T2 in five of the subjects. In only half the subjects was C7 involved. In all the cases, the activated area did not form a single zone for any given task, but, as illustrated in Figures 2 and 3, consisted of discontinuous clusters. The amplitude of the observed signal varied widely, from 0.5% to 7.5%, among subjects.
fig 2.
A–C, Activation maps for one subject evoked by three motor tasks: elbow flexion (A), wrist extension (B), and finger spreading (C). Color bar indicates the t statistics
fig 3.
A–C, Activation maps for three subjects (A, B, and C, respectively) evoked by wrist extension. Color bar indicates the t statistics
Deactivation Response
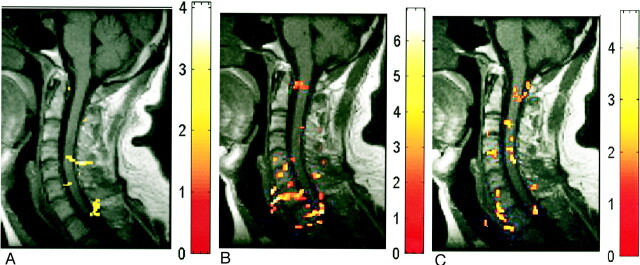
In addition to signal increase, decreased signal was also observed at discrete locations in the spinal cord during motor activity (Fig 1). This response was more diffuse relative to the areas of activation. For example, the deactivation response was identified in locations of the spinal cord parenchyma spanning C5 to T1 during biceps activity, whereas activation was concentrated primarily at levels C5, C6, and C7. As was the case for activation, deactivation was observed to occur over noncontiguous clusters (Fig 4).
fig 4.
A–C, Deactivation maps (decreased BOLD signal) in one subject evoked by three motor tasks: biceps flexion (A), wrist extension (B), and finger spreading (C). Color bar indicates the t statistics
Axial Sections
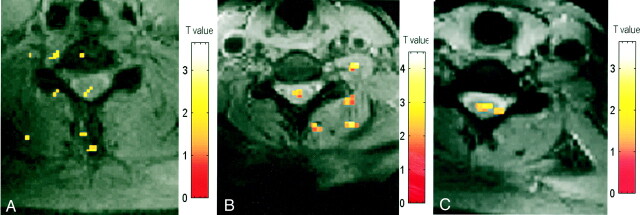
In three subjects, axial images were acquired during wrist extension. Ipsilateral activity was detected at C5 or C6, as shown in Figure 5. The activity was not limited to the anterior section of the cord in all subjects. Activity in the posterior region was detected in one subject. Contralateral activity was also detected in one subject.
fig 5.
A–C, Activation maps evoked by wrist extension (axial view) in three subjects (A, B, and C, respectively). Color bar indicates the t statistics (L = R)
Alteration in BOLD Signal with Change in Isometric Force
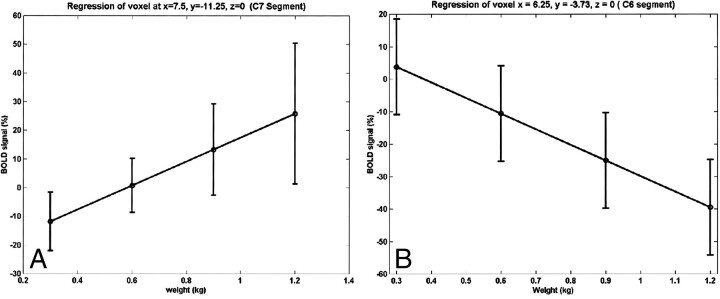
The relationship between the strength of the BOLD signal in the spinal cord and the amount of effort or force applied to the key muscle is shown in Figure 6. The strength of the BOLD signal for both activation and deactivation for a substantial fraction of the active voxels shows a linear relationship with respect to applied force. When tested for a quadratic relation, no voxels were detected. The anatomic location of the activity was similar to that observed with active exercise, as shown in Figure 1. For all but one subject, a signal (activation or deactivation) was detected at the C5–C6 level during isometric exercise. These locations are in agreement with the results obtained from active exercise with elbow flexion. Additional activity was detected at the C8 through T1 levels.
fig 6.
Linear relationship between BOLD and isometric force at two different voxels for one subject. The linear BOLD signal changes with isometric applied force in some voxels.
A and B, Positive (A) and negative (B) correlations were observed.
Error bars indicate standard error in the mean over repeated sessions.
Discussion
Despite the known inherent technical limitations in obtaining a useful functional MR imaging signal from the spinal cord, we have shown that meaningful data can be obtained using conventional clinical imagers, surface coils, and pulse sequences. Moreover, we were able to demonstrate a task dependency of the observed spinal cord BOLD signal. The anatomic location of the activated zones altered with use of different muscle groups, supporting the segmental organization of motor innervation in the spinal cord and brachial plexus: the segments that innervate participating muscles were active in nearly all subjects while other segments were less frequently involved. Furthermore, as expected, the signal amplitude varied with the force exerted. There is substantial evidence that the BOLD signal level is modified by the neural activity level (19, 21–23) and that there would be increased neural activity associated with greater contractile force (24).
Our success in obtaining useful functional MR imaging data from the human spinal cord is related to modifications in the technique to decrease inherent artifacts. In addition to the signal degradation from inherent spinal cord motion, the spinal cord size and the presence of large veins were potential difficulties in producing successful functional MR imaging of the cord. To reduce the impact of large vessels, spoiler gradients were used. The flow contribution to the detected signal was minimal, owing to the fact that one slice was acquired every 500 ms, and in an interleaved way. Moderate-resolution imaging (about 1 mm in-plane voxel size) was used to compensate for the small size of the cord. These as well as residual signal from large vessels probably contributed to the high signal amplitude observed (8, 9, 25). Note that BOLD signal has an effective spatial resolution of only 2 to 3 mm because of the diffuse nature of the hemodynamic changes that can be detected at 1.5 T. A number of additional factors were important contributors to the detection of the BOLD signal. The volume neck coil used is characterized by a constant frequency response around resonance frequency. Signal reception was improved by placing each subject's neck close to the upper section of the coil. Finally, a higher receiver bandwidth with ramp sampling was used, 75 kHz as compared with the conventional 62 kHz. Motion artifacts were reduced by restraining the subjects and by postprocessing, 3D alignment, and removal of active voxels correlated with the motion parameters. However, even after these steps were taken, some motion-related active voxels remained, as has been observed by others (26, 27). This is the probable explanation for the presence of signal outside the spinal cord during all but isometric motor tasks. While some of this activity may arise from the vascular bed draining the cord, the absence of much of this activity during performance of the isometric task suggests that gross motion is a contributing factor.
The observation that activity is identified at multiple segments during exercise of a single muscle group other than the known site of innervation merits explanation. Although the tasks performed by each subject were designed to emphasize a single muscle group, each activity represented a complex coordinated effort of all the muscles of the arm and forearm. Both agonist and antagonist muscles are affected, as well as accessory muscles. Moreover, complex afferent sensory input is also being received by the spinal cord during activity. While the subjects were instructed to limit their movements to the task under study, variation in task performance, such as unnoticed additional motion, may have occurred. For example, forceful elbow flexion may introduce activation in C7 because of additional wrist activation. Similarly, for the wrist extension exercise, additional activation at C7 and C8 is accounted for by the extensor digitorum longus. For the hand abductor task, activity at C7 could be accounted for by recruitment of the extensor digitorum longus muscles, which stabilize the metacarpal phalangeal joints in extension. In the isometric force study, additional activity in the lower cervical levels can be accounted for by increasing force exerted by the fingers to hold the weight using the finger muscles. This additional activation suggests that in future studies electromyography should be used in conjunction with functional MR imaging to identify activated muscles on a trial-by-trial basis.
Other considerations that help to explain the observed pattern of activation include the known duality of innervation of all muscle groups by at least two adjacent spinal roots. Moreover, there are individual differences in the innervation of muscles (17).
Coordinated motor activity involves not only recruitment of the agonist muscles but also the antagonist muscles, and some of those may receive input from other spinal segments. The signal extended not only to other segments but also from the anterior to the dorsal part of the cord. This may be due to sensory activation and to the anatomy of the vascular bed. Indeed, at times, the activity appeared to follow the shape of small radial veins; this was especially true at the lower cervical levels. As described by Gillilan (28), “in the lower cervical levels, the radial veins pass obliquely posterolaterally from the plexus within the retrodorsolateral cell column to the coronal veins near the posterior nerve roots.”
The identification of regions of spinal cord deactivation is particularly compelling. Although the cause of this observation is unknown, a similar phenomenon has been reported in functional MR imaging studies of the brain (29, 30). Interestingly, we find that there are voxels whose level of signal decrement is proportional to the force exerted. It is speculated that the regions of deactivation may correspond to regions of neural inhibition either to antagonist or accessory musculature.
The transfer function between neural activity and the BOLD signal is controversial, with linear (21, 22) and nonlinear (19, 23) models proposed. The observed linear relation exhibited by some voxels in the present study during isometric biceps contraction lends support to the former case. Based on findings from electrophysiological studies (24), it is expected that there is a monotonic relation between contractile force and neural activity of at least some of the elements of the spinal circuitry involved.
Beyond the implication at the level of basic science, the linear correlation between motor force and BOLD signal offers a potential practical advantage. A vector representing the order of applied forces was used as a covariate in the analysis of the data. No correlation between the applied force and motion parameters was detected. By using the parametric dependence of the BOLD signal on the applied force, it is possible to differentiate activity-dependent signal from motion-induced artifacts.
Most of our current understanding of human spinal cord physiology is inferred from mammalian and primate research. This is the first investigation to show the complexity of human spinal cord activity by noninvasive means. Correlation of the patterns of functional MR imaging activation with electrical activity (through electromyography) will be necessary to validate the observed response. Future challenges include application of this technique to lumbar spinal cord function, assessment of complex motor tasks and behaviors, and modeling plasticity of spinal cord function in the setting of disease or injury.
Conclusion
Our results validate a robust noninvasive method for reliably assessing spinal cord function by using standard clinical imagers, surface coils, and commercial pulse sequences. The BOLD response was identified at multiple locations within the spinal cord, with concentrated activity at the site of muscle innervation. The strength of the functional MR imaging signal is directly proportional to the force applied by the muscle group. This technique has a broad application in the study of human spinal cord physiology and pathology.
Footnotes
Address reprint requests to Jonathan Nissanov, PhD, Department of Neurobiology and Anatomy, Medical College of Pennsylvania/Hahnemann University, 2900 Queen Lane, Philadelphia, PA 19129.
References
- 1.Belliveau JW, Rosen BR, Kantor HL, et al. Functional cerebral imaging by susceptibility-contrast NMR. Magn Reson Med 1990;14:538-546 [DOI] [PubMed] [Google Scholar]
- 2.Curtin AJ, Chakeres DW, Bulas R, et al. MR imaging artifacts of the axial internal anatomy of the cervical spinal cord. AJR Am J Roentgenol 1989;152:835-842 [DOI] [PubMed] [Google Scholar]
- 3.Czervionke LF, Daniels DL, Ho PS, et al. The MR appearance of gray and white matter in the cervical spinal cord. AJNR Am J Neuroradiol 1988;9:557-562 [PMC free article] [PubMed] [Google Scholar]
- 4.Matsuzaki H, Wakabayashi K, Ishihara K, et al. The origin and significance of spinal cord pulsation. Spinal Cord 1996;34:422-426 [DOI] [PubMed] [Google Scholar]
- 5.Mikulis DJ, Wood ML, Zerdoner OA, et al. Oscillatory motion of the normal cervical spinal cord. Radiology 1994;192:117-121 [DOI] [PubMed] [Google Scholar]
- 6.Takizawa H, Sugiura K, Baba M, et al. Spectral analysis of cerebrospinal fluid wave. No To Shinkei 1983;35:1223-1227 [PubMed] [Google Scholar]
- 7.Nakamura K, Urayama K, Hoshino Y. Site of origin of spinal cerebrospinal fluid pulse wave. J Orthop Sci 1998;3:60-66 [DOI] [PubMed] [Google Scholar]
- 8.Boxerman JL, Bandettini PA, Kwong KK, et al. The intravascular contribution to fMRI signal change: Monte Carlo modeling and diffusion-weighted studies in vivo. Magn Reson Med 1995;34:4-10 [DOI] [PubMed] [Google Scholar]
- 9.Menon RS, Hu X, Adriany G, et al. Comparison of spin echo EPI, asymmetric spin echo EPI, and conventional EPI applied to functional neuroimaging: the effect of flow crushing gradients on the BOLD signal. In: Proceedings of the Society of Magnetic Resonance, 1994. Society of Magnetic Resonance; 1994;2:622
- 10.Gati JS, Menon RS, Ugurbil K, et al. Experimental determination of the BOLD field strength dependence in vessels and tissue. Magn Reson Med 1997;38:296-302 [DOI] [PubMed] [Google Scholar]
- 11.Ogawa S, Lee TM, Barrere B. The sensitivity of magnetic resonance image signals of a rat brain to changes in the cerebral venous blood oxygenation. Magn Reson Med 1993;29:205-210 [DOI] [PubMed] [Google Scholar]
- 12.Tadie M, Hemet J, Freger P, et al. Morphological and functional anatomy of spinal cord veins. J Neuroradiol 1985;12:3-20 [PubMed] [Google Scholar]
- 13.Stroman PW, Nance PW, Ryner LN. BOLD MRI of the human cervical spinal cord at 3 tesla. Magn Reson Med 1999;42:571-576 [DOI] [PubMed] [Google Scholar]
- 14.Yoshizawa T, Nose T, Moore GJ, et al. Functional magnetic resonance imaging of motor activation in the human cervical spinal cord. Neuroimage 1996;4:174-182 [DOI] [PubMed] [Google Scholar]
- 15.Porszasz R, Beckmann N, Bruttel K, et al. Signal changes in the spinal cord of the rat after injection of formalin into the hindpaw: characterization using functional magnetic resonance imaging. Proc Natl Acad Sci U S A 1997;94:5034-5039 [DOI] [PMC free article] [PubMed] [Google Scholar]
- 16. Thomas Jefferson University Hospital Spinal Cord Injury Research & Training Center. Research Student Training Guide, 1992. Philadelphia: Thomas Jefferson University; 1992
- 17. American Spinal Cord Association. Standards for Neurological and Functional Classification of Spinal Cord Injury, Revised. Chicago: American Spinal Cord Association; 1992
- 18.Friston KJ, Ashburner J, Poline JB, et al. Spatial registration and normalization of images. Hum Brain Map 1995;2:165-189 [Google Scholar]
- 19.Friston KJ, Josephs O, Rees G, et al. Nonlinear event-related responses in fMRI. Magn Reson Med 1998;39: (B) 41-52 [DOI] [PubMed] [Google Scholar]
- 20.Aguirre GK, Zarahn E, D'Esposito M. The inferential impact of global signal covariates in functional neuroimaging analyses. Neuroimage 1998;8:302-306 [DOI] [PubMed] [Google Scholar]
- 21.Boynton GM, Engel SA, Glover GH, et al. Linear systems analysis of functional magnetic resonance imaging in human, VI. J Neurosci 1996;16:4207-4221 [DOI] [PMC free article] [PubMed] [Google Scholar]
- 22.Dale A, Buckner R. Selective averaging of rapidly presented individual trials using fMRI. Hum Brain Map 1997;5:329-340 [DOI] [PubMed] [Google Scholar]
- 23.Vasques AL, Noll DC. Nonlinear aspects of the BOLD response in functional MRI. Neuroimage 1998;7:108-118 [DOI] [PubMed] [Google Scholar]
- 24.Maier MA, Perlmutter SI, Fetz EE. Response patterns and force relations of monkey spinal interneurons during active wrist movement. J Neurophysiol 1998;80:2495-2513 [DOI] [PubMed] [Google Scholar]
- 25.Oja JM, Gillen J, Kauppinen RA, et al. Venous blood effects in spin-echo fMRI of human brain. Magn Reson Med 1999;42:617-626 [DOI] [PubMed] [Google Scholar]
- 26.Jezzard P, Clare S. Sources of distortion in functional MRI data. Hum Brain Map 1999;8:80-85 [DOI] [PMC free article] [PubMed] [Google Scholar]
- 27.Wu DH, Lewin JS, Duerk JL. Inadequacy of motion correction algorithms in functional MRI: role of susceptibility artifacts. J Magn Reson Imaging 1997;7:365-370 [DOI] [PubMed] [Google Scholar]
- 28.Gillilan LA. Veins of the spinal cord: anatomic details; suggested clinical applications. Neurology 1970;20:860. [DOI] [PubMed] [Google Scholar]
- 29.Rauch SL, Whalen PJ, Curran T, et al. Thalamic deactivation during early implicit sequence learning: a functional MRI study. Neuroreport 1998;9:865-870 [DOI] [PubMed] [Google Scholar]
- 30.Seitz RJ, Roland PE. Vibratory stimulation increases and decreases the regional cerebral blood flow and oxidative metabolism: a positron emission tomography (PET) study. Acta Neurol Scand 1992;86:60-67 [DOI] [PubMed] [Google Scholar]


