Abstract
BACKGROUND AND PURPOSE: Midsagittal morphologic changes often aid in the diagnosis of hydrocephalus. Stretching and upward displacement of the corpus callosum, widening of third ventricular recesses, and decreased mammillopontine distance have been described as indicating the possibility of hydrocephalus. Quantitative studies are scarce. We performed retrospective, quantitative analysis to verify and quantify changes in midline morphology that might differentiate hydrocephalus and ventriculomegaly due to atrophy.
METHODS: Sagittal MR imaging studies of 22 patients with hydrocephalus and 32 patients with atrophy were analyzed, as were 42 studies with normal findings. The studied parameters included mammillopontine and mammillocommissural distances, callosal height at two points, and the distances between the lines passing through the chiasm (chiasmal line) and the edge of the callosal splenium. Various angles between the chiasmal line and surrounding structures were measured. Similar measurements were done with the line passing through the third ventricular floor segment anterior to the mammillary bodies (third ventricular line).
RESULTS: In hydrocephalus, mammillopontine distance decreased, mammillocommissural distance increased, the third ventricular floor segment was concave in most cases, and the chiasmal line rotated clockwise. These changes were not seen in atrophy. Callosal height was increased in hydrocephalus significantly more than in atrophy.
CONCLUSION: Specific changes of the midsagittal plane in hydrocephalus, some of which have not been described previously, can be observed and quantified, which might aid in differentiating this condition from atrophy.
One of the challenges in modern neuroimaging is to differentiate active hydrocephalus from atrophic ventriculomegaly. This differentiation guides the clinician about whether to initiate therapy at all and, when surgery is indicated, whether to perform an external diversion (eg, shunt) or endoscopic third ventriculostomy. Dilatation of the temporal horns, increased frontal horn radius, and acuteness of the ventricular angle (1) have been described as the classic structural changes suggestive of hydrocephalus. Periventricular interstitial edema resulting from transependymal flow of CSF (2) and intraventricular flow void from CSF movement at MR imaging (3) also have been proposed as signs aiding the diagnosis. Structural changes in the midsagittal plane include widening of the third ventricular recesses (4), stretching and upward displacement of the corpus callosum (3, 5), depression of the posterior fornix with increase in the superior-inferior dimensions of the lateral ventricles, and decreased mammillopontine distance (3).
Quantitative assessment tools for these midline changes are scarce. Therefore, we quantitatively assessed the morphology of midsagittal T1-weighted MR images of patients with hydrocephalus or brain atrophy, as well as a group of studies with normal findings. Our basic assumption was that at least part of the midline structures have constant geometric relations as determined by distances and angles between them. These distances and angles were assessed to determine the most prominent and constant changes from the norm in each condition.
Methods
Patients
Morphometric analysis of midline T1-weighted sagittal MR images of 22 patients with clinical and radiologic diagnosis of hydrocephalus and 32 patients with moderate to marked atrophy, as well as 42 MR studies with normal findings, was retrospectively performed.
All cases of hydrocephalus were diagnosed using a combination of clinical and radiologic criteria. The clinical criteria included the signs and symptoms of increased intracranial pressure, such as headache, nausea, and papilledema. One patient with normal pressure hydrocephalus had the clinical triad of Hakim radiologic evidence of hydrocephalus based on the aforementioned criteria.
Of the 22 cases of hydrocephalus, obstructive hydrocephalus was present in 17 patients, nine of whom had tumors obstructing the aqueduct and eight of whom had congenital aqueductal stenosis. Communicating hydrocephalus was present in four patients. In one case, the type of hydrocephalus could not be established. Postsurgical studies for eight of these patients who had clinically successful shunt insertion (n = 3) or endoscopic third ventriculostomy (n = 5) were available and analyzed.
The 32 cases of moderate to marked atrophy were selected on the basis of a subjective impression of the degree of atrophy and the absence of a space-occupying lesion. In this group, patients did not have any signs or symptoms suggestive of increased intracranial pressure or normal pressure hydrocephalus. The presence of ischemic or demyelinating findings did not constitute exclusion criteria in this group.
The 42 MR studies with normal findings were selected from cases studied for various clinical problems.
Lines, Distances, and Angles
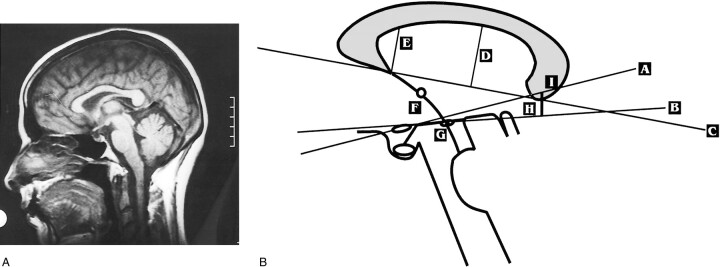
The lines, distances, and angles measured are graphically portrayed in Figure 1 and are defined as follows:
fig 1.
A, Normal midsagittal spin-echo T1-weighted MR image of the brain (400/12 [TR/TE]).
B, Schematic representation of the parameters, which are defined in the text.
A, chiasmal line; B, third ventricular line; C, callosal line; D, callosal height; E, anterior callosal height; F, mammillocommissural distance; G, mammillopontine distance; H, third ventricular splenial distance; I, spleniochiasmal distance.
Definitions of Lines
The chiasmal line is that which passes through the long axis of the chiasm (Fig 1B [A]). The third ventricular line is that which passes through the segment of the third ventricle anterior to the mammillary bodies. When this segment was concave, the posterior most part of it was used to draw the line (Fig 1B [B]). The basisphenoid line is that which passes through the nasion and tuberculum sellae. The callosal line is that which passes through the inferior edges of the splenium and rostrum of the corpus callosum (Fig 1B [C]).
Measurements
The spleniochiasmal distance is the shortest distance between the chiasmal line and the edge of the splenium of the corpus callosum. Negative values were given when the line was below the splenium (Fig 1B [I]). The third ventricular splenial distance is the shortest distance between the third ventricular line and the edge of the splenium of the corpus callosum. Negative values were given when the line was below the splenium (Fig 1B [H]). The callosal height is the maximal height between the callosal line and the inner surface of the corpus callosum (Fig 1B [D]). The anterior callosal height is that between the callosal line and the inner surface of the corpus callosum measured at the inferior edge of the rostrum (Fig 1B [E]). The mammillopontine distance is the shortest distance between the center of the mammillary bodies and the upper surface of the pons (Fig 1B [G]). The mammillocommissural distance is that between the centers of the mammillary bodies and the anterior commissure (Fig 1B [F]). The mammillary body ratio is that between the mammillocommissural and mammillopontine distances. The basisphenoid chiasmal angle is that between the basisphenoid and chiasmal lines. The third ventricular chiasmal angle is that between the third ventricular and chiasmal lines.
The relevant morphologic points and lines were drawn on semitransparent paper. The different distances and angles were measured with a hand ruler and a goniometer by a single reader (M.U.). Difficulties in identifying any of the anatomic landmarks were settled in a consensus session (M.U., S.Y.). Although the readers were not blinded with regard to group stratification, measurements were done sequentially and randomly without prior discussion on the clinical correlate. A group of 26 cases was analyzed for interobserver agreement (S.Y.).
Statistical Analysis
The relationship between variables was examined using the appropriate coefficient or test: Pearson correlation for continuous variables, Spearman correlation for ordinal scale variables, and the chi-square test for nominal scale variables. Comparison between groups with regard to continuous variables was performed using Student's t test for two groups and one-way analysis of variance for three or more groups. The preoperative to postoperative change in parameters was evaluated using the Wilcoxon nonparametric test for small samples. A logistic regression model was applied to each one of the parameters to estimate the probability of allocation to one of two diagnostic groups. On the basis of this model, the sensitivity, specificity, and percentage of correct classification were calculated for each parameter.
Interobserver agreements were assessed by comparing the means and Pearson correlation coefficients. Means were compared by using the Mann-Whitney and Wilcoxon tests.
Results
Tables 1–3 detail the results of the measurements and their statistical analysis. Table 1 summarizes the different parameters studied in cases of hydrocephalus and atrophy and in normal brains, with corresponding statistically significant differences. Table 2 presents, for each parameter studied, a value or range of values achieving maximum accuracy in differentiating atrophy from hydrocephalus.
TABLE 1:
Mean ± SD values for each parameter in hydrocephalus (H), atrophy (A), and brains with normal findings (N) and statistically significant differences
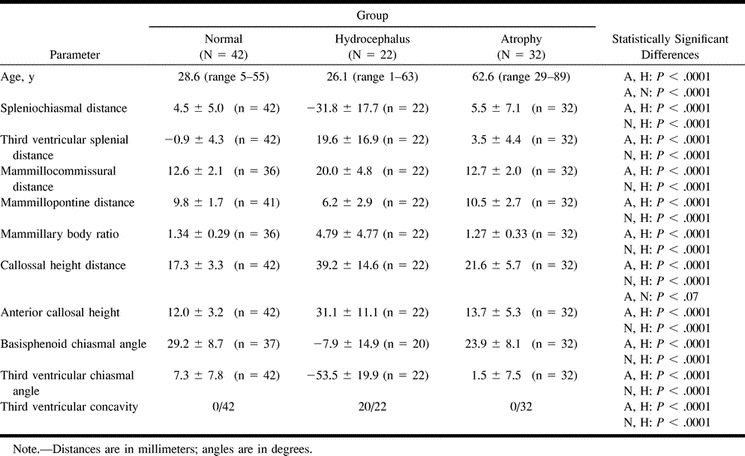
TABLE 2:
A value or range of values achieving maximum accuracy in differentiating atrophy from hydrocephalus for each parameter
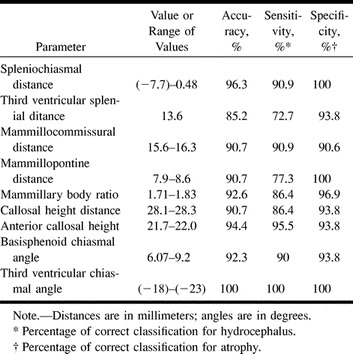
No significant correlation was found between age or sex and any of these parameters in the normal group. In a few cases, when identification of certain anatomic structures was not possible, the relevant parameters were not recorded.
Chiasmal Line
The normal relations of this line to the splenium, basisphenoid line, and other structures are fairly constant. No significant change was observed in atrophy. In hydrocephalus, a clockwise rotation (given that the nose is on the left side of the observer) was seen, thus the spleniochiasmal distance was increased (negative values). The rotation of the chiasm was the basic phenomenon behind the changes observed in the basisphenoid chiasmal angle. These changes were not observed in atrophy. At times, concavity of the upper surface of the chiasm was demonstrated in cases with hydrocephalus. In these cases, the anteriormost and posterior edges of the chiasm were used to draw the lines. The prevalence of this phenomenon was not recorded in this study.
Third Ventricular Line
The normal third ventricular floor segment between the aqueduct and the mammillary bodies was a straight line except for a small dip representing the infundibular recess that was sometimes seen. In most cases of hydrocephalus, concavity of this segment could be appreciated. Consequently, a counterclockwise rotation of the third ventricular line occurred, with an increase in third ventricular splenial distance and a significant change in the third ventricular chiasmal angle. These changes were not observed in atrophy.
Mammillary Bodies, Anterior Commissure, and Upper Surface of the Pons
In most cases of hydrocephalus, mammillopontine distance decreased, mammillocommissural distance increased, and, consequently, the ratio of these distances changed significantly.
Corpus Callosum
Both callosal and anterior callosal heights differed significantly in hydrocephalus versus atrophy or normal brains. Callosal height approached a statistically significant difference in atrophy versus that in normal brains.
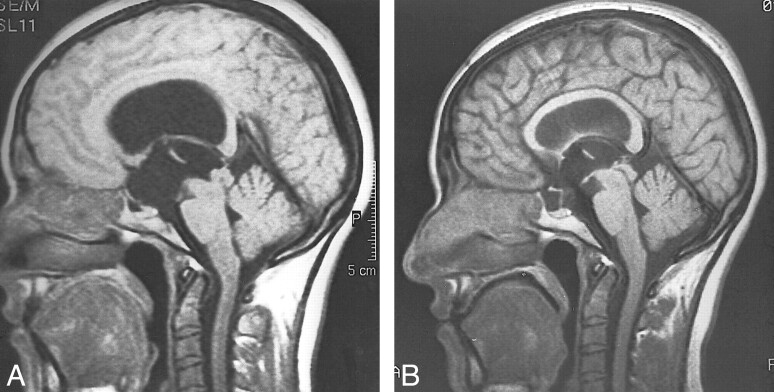
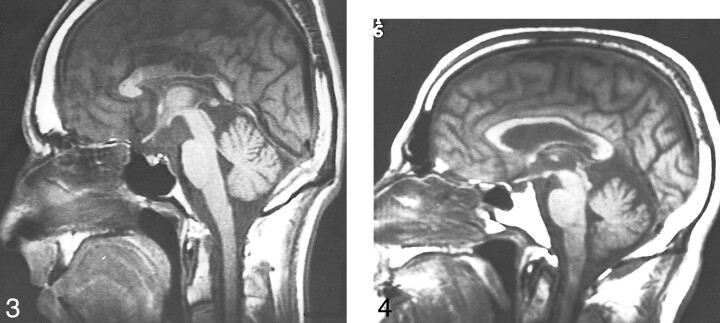
Table 3 summarizes the results of the postoperative cases in comparison with the preoperative studies of the same patients and in comparison with the group with normal findings (Fig 2). A common feature in these cases was a change of the measured parameters toward normality, but in most of them a significant difference from normal values remained. In one exceptional case, postoperative overdrainage was successfully diagnosed and treated. In this case (Fig 3), some of the midline parameters (eg, spleniochiasmal distance, mammillopontine and mammillocommissural distances) were changed even beyond normal values, including reversal of mammillary body ratio and some counterclockwise rotation of the chiasm.
TABLE 3:
Comparison of preoperative (Pr) and postoperative (Po) studies of hydrocephalus (Wilcoxon nonparametric test) and comparison of postoperative group and group with normal (N) brain findings (Student's t test)
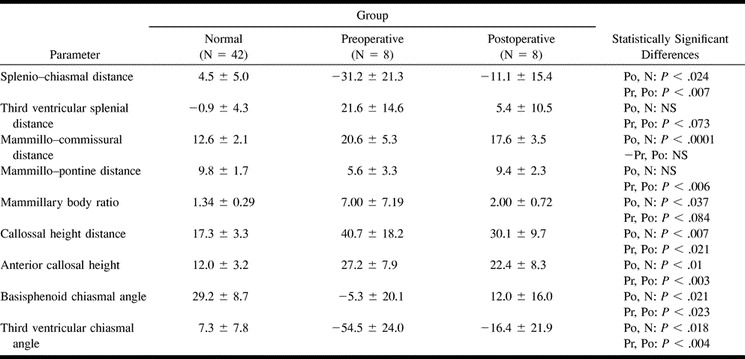
fig 2.
Hydrocephalus secondary to aqueductal stenosis.
A, Spin-echo T1-weighted image at 400/12. When compared with normal appearance in fig 1, there is clockwise rotation of the chiasm, the mammillopontine distance is decreased, the mammillocommissural distance is increased, and the third ventricular floor is concave with consequent counterclockwise rotation of its line.
B, Following endoscopic third ventriculostomy, there is a significant improvement but not normalization of midline appearance. The change in ventricular size was minimal and difficult to appreciate in the axial plane.
fig 3.
Shunt overdrainage. Spin-echo T1-weighted image at 500/15. Following surgery for marked hydrocephalus secondary to aqueductal stenosis, the classic clinical and radiologic pictures of overdrainage were present. Note beyond normal changes of midline structures, including reversal of the mammillary body ratio. Following third ventriculostomy, with marked clinical improvement, midline structures changed in the expected direction (not shown). Encephalomalacic, including cystic, changes are present in the corpus callosum secondary to impingement. fig 4. Marked atrophy in a case of long- standing multiple sclerosis. Spin-echo T1-weighted image at 400/12. Relations between midline structures are similar to those of normal brain
Interobserver Agreement
No statistically significant difference between the means of the measurements done by the two readers was found for all eight parameters. The Pearson correlation coefficient was high for six of eight measurements (range, 0.89–0.95) and somewhat lower for mammillopontine distance (0.6) and mammillocommissural distance (0.69). This discrepancy might be explained by the relatively low standard deviation of these two measurements. P values were less than .003 or lower for all parameters.
Discussion
Of the morphologic changes in hydrocephalus, widening of the third ventricular recesses was considered by Barkovich and Edwards (4) to be one of the most reliable signs. Quantitative studies of midline changes are scarce. The most distinct study, by El Gammal et al (3), describes the reduction of the mammillopontine distance from inferior bowing and displacement of the hypothalamus by the distended third ventricle, among other findings. Detailed measurements of the corpus callosum in patients with hydrocephalus performed by Hoffman et al (5) mainly showed elevation of the corpus callosum and, to a lesser degree, increase in length in patients with hydrocephalus compared with that in healthy volunteers.
The results of our study confirm previous observations. We also added a few parameters that had not been previously described, including mammillocommissural distance, mammillary body ratio, and the rotation of the chiasmal and third ventricular lines. The midline changes in hydrocephalus may be divided into three main groups (Fig 2A). The first group of changes is associated with the chiasm. The pressure gradient between the third ventricle and the suprasellar cistern causes bulging of the chiasmatic recess with a clockwise rotation of the chiasm. The parameters that change secondary to the chiasmatic rotation are the spleniochiasmal distance and the angles measured between the chiasmal line and the basisphenoid and third ventricular lines.
The second group of changes is associated with the third ventricular floor between the chiasm and the mammillary bodies. The downward bulge of this segment is associated with the decrease in the mammillopontine and the increase in the mammillocommissural distances. The concavity of this segment of the third ventricular floor also might be explained by this pressure gradient and is a specific finding that was observed in most cases of hydrocephalus. In no case of normal or atrophic brain was this parameter observed. Our results of the normal mammillopontine distance (9.8 mm) differ from those published by El-Gammal et al (11.5 mm) probably because our point of reference was the center of the mammillary bodies rather than the upper-anterior part of them (3).
The third group of changes is associated with the bulging corpus callosum. Our definition of callosal height differs from that of others (5), in that we define the upper border as the inner rather than the outer surface of the corpus callosum. This maximizes differences primarily with the normal group, in which the corpus callosum was relatively thick. Although a tendency of increased callosal height is seen in atrophy, it is significantly more prominent in hydrocephalus. Anterior callosal height is an alternative parameter with similar properties. The first two groups of changes result from the distention of the third ventricle, whereas corpus callosum bulging results from the distention of the lateral ventricles.
Intracranial hypotension secondary to shunt overdrainage is associated with a negative pressure gradient, which might explain the changes observed in the aforementioned case of overdrainage. Further studies are needed to confirm the usefulness of these morphologic changes in overdrainage cases.
The findings described were observed in cases of both obstructive and communicating hydrocephalus. Hoffman et al (5) proved that the upward bulge of the corpus callosum was more prominent in obstructive than in communicating hydrocephalus. Our impression was that this, as well as other parameters, was indeed more prominent in obstructive hydrocephalus, but because of the small number of communicating hydrocephalus cases, specific statistical analysis could not be performed. Only one case in our series was a patient with classic idiopathic normal pressure hydrocephalus that responded to shunt placement. Although midline changes in this case were similar to those in the other cases, further studies are needed to estimate prevalence of these changes in this specific group of patients and their potential usefulness in differentiating those who would respond to shunt placement.
The significant age difference between the group with atrophy and both the group with hydrocephalus and individuals with normal brains was due to difficulties in recruiting young patients with moderate to marked atrophy. There was no significant age difference between the group with hydrocephalus and the group with normal brains. The absence of correlation between the studied parameters with age, as was proved in the normal group, suggests that no significant bias was created by this difference. The only other parameter that approached significant difference between the group with atrophy and the normal group was the callosal height; thus, midline morphology in atrophy is close to normal (Fig 4).
On postoperative images of successfully treated patients, there is a significant, but often only partial, change of midline morphology toward normality, the reason for which is unclear. A possible explanation is that the pressure gradient that was present before the operation caused some irreversible changes by stretching. Another theoretical explanation is that some pressure gradient between the third ventricle and the suprasellar cistern remains.
Because of the small number of cases, it was not possible to do a detailed analysis of the postoperative group, including comparison of shunt insertion versus endoscopic third ventriculostomy and comparison between successful and failed cases (the latter not occuring in our small sample).
Some potential pitfalls in midline analysis, although not present in this study, must be kept in mind. First, a somewhat concave third ventricular floor segment may be seen in intracranial hypotension secondary to CSF leak (6–8). The mechanism may be similar in that in both situations there is a pressure gradient between the third ventricle and the suprasellar cistern. Other parameters including ventricular size, brain stem displacement, and dural enhancement distinguish intracranial hypotension. Second, in some cases of spontaneous or postoperative empty sella syndrome, changes in chiasmal and third ventricular lines are similar to those observed in hydrocephalus because of downward displacement, but with no other parameters suggesting hydrocephalus. Third, dolichoectatic vertebrobasilar arteries exist. In these common cases, elevation of the third ventricular floor might be observed and potentially mask the midline changes in hydrocephalus. Similarly, any space-occupying lesion in the region of the third ventricle might obscure these changes. Finally, in any case of hydrocephalus where the third ventricle is not involved, such as obstruction of the foramina of Monro and trapped fourth ventricle.
Conclusion
The normal midsagittal plane has some constant features. Some of them may be summarized as rules of thumb: the chiasmal and third ventricular lines are near parallel and pass close to the edge of the splenium; the normal mammillocommissural distance is only slightly greater than the mammillopontine distance.
Most of these parameters change significantly in hydrocephalus but not in atrophy. There is a clockwise rotation of the chiasm. The bulging concave third ventricular floor causes counterclockwise rotation of the third ventricular line. The mammillopontine distance decreases and the mammillocommissural distance increases, with a consequent change of the ratio of these distances. Significant bulging of the corpus callosum also is observed. Following successful surgical treatment, most of these parameters approach normality but often remain significantly different from normal values.
The clinical use of these parameters must be judicious. It is only the combination of these parameters, as well as other imaging findings, knowledge of potential pitfalls, and the clinical state of the patient, that may yield the correct conclusions. Further studies are needed to compare these parameters in communicating versus obstructive hydrocephalus to confirm possible usefulness in the diagnosis of shunt overdrainage, and to confirm and detail findings in postoperative cases.
Footnotes
Address reprint requests to Yoram Segev, MD, Radiology Department, Tel-Aviv Sourasky Medical Center, 6 Weizman Street, Tel-Aviv, Israel.
References
- 1.Heinz ER, Ward A, Drayer BP, et al. Distinction between obstructive and atrophic dilatation of ventricles in children. J Comput Assist Tomogr 1980;4:320-325 [DOI] [PubMed] [Google Scholar]
- 2.LeMay M, Hochberg FH. Ventricular differences between hydrostatic hydrocephalus and hydrocephalus ex vacuo by computed tomography. Neuroradiology 1979;17:191-195 [DOI] [PubMed] [Google Scholar]
- 3.El Gammal T, Allen MB Jr, Brooks BS, Mark EK. MR evaluation of hydrocephalus. AJNR Am J Neuroradiol 1987;8:591-597 [DOI] [PubMed] [Google Scholar]
- 4.Barkovich AJ, Edwards MSB. Applications of neuroimaging in hydrocephalus. Pediatr Neurosurg 1992;18:65-83 [DOI] [PubMed] [Google Scholar]
- 5.Hoffman E, Becker T, Jackel M, et al. The corpus callosum in communicating and noncommunicating hydrocephalus. Neuroradiology 1995;37:212-218 [DOI] [PubMed] [Google Scholar]
- 6.Sell JJ, Rupp FW, Orrison WW. Iatrogenically induced intracranial hypotension syndrome. AJR Am J Roentgenol 1995;165:1513-1515 [DOI] [PubMed] [Google Scholar]
- 7.Fishman RA, Dillon WP. Dural enhancement and cerebral displacement secondary to intracranial hypotension. Neurology 1993;43:609-611 [DOI] [PubMed] [Google Scholar]
- 8.Pannullo SC, Reich JB, Krol G, et al. MRI changes in intracranial hypotension. Neurology 1993;43:919-926 [DOI] [PubMed] [Google Scholar]


