

Abstract
BACKGROUND AND PURPOSE: Relative cerebral blood volume (rCBV) and vascular permeability (Ktrans) permit in vivo assessment of glioma microvasculature. We assessed the associations between rCBV and Ktrans derived from dynamic, susceptibility-weighted, contrast-enhanced (DSC) MR imaging and tumor grade and between rCBV and Ktrans.
METHODS: Seventy-three patients with primary gliomas underwent conventional and DSC MR imaging. rCBVs were obtained from regions of maximal abnormality for each lesion on rCBV color maps. Ktrans was derived from a pharmacokinetic modeling algorithm. Histopathologic grade was compared with rCBV and Ktrans (Tukey honestly significant difference). Spearman and Pearson correlation factors were determined between rCBV, Ktrans, and tumor grade. The diagnostic utility of rCBV and Ktrans in discriminating grade II or III tumors from grade I tumors was assessed by logistic regression.
RESULTS: rCBV was significantly different for all three grades (P ≤ .0005). Ktrans was significantly different between grade I and grade II or III (P = .027) but not between other grades or combinations of grades. Spearman rank and Pearson correlations, respectively, were as follows: rCBV and grade, r = 0.817 and r = 0.771; Ktrans and grade, r = 0.234 and r = 0.277; and rCBV and Ktrans, r = 0.266 and r = 0.163. Only rCBV was significantly predictive of high-grade gliomas (P < .0001).
CONCLUSION: rCBV with strongly correlated with tumor grade; the correlation between Ktrans and tumor grade was weaker. rCBV and Ktrans were positively but weakly correlated, suggesting that these parameters demonstrate different tumor characteristics. rCBV is a more significant predictor of high-grade glioma than Ktrans.
Grading of gliomas is of significant clinical import because high-grade gliomas are usually treated with adjuvant radiation therapy or chemotherapy after resection, whereas low-grade gliomas are not. The current criterion standard for tumor grading is histopathologic assessment, but this has limitations, such as inherent sampling error associated with the limited number of biopsy samples. Even with cytoreductive surgery, histology can be performed only on excised tumor, and residual tumor tissue cannot be examined. The histopathologic classification of gliomas itself is a controversial subject, one under constant discussion and revision (1).
Advanced MR imaging techniques, such as diffusion, perfusion, and MR spectroscopic imaging, can provide important in vivo physiologic and metabolic information that may complement the histopathologic grade. Ultra-high-field, high-resolution MR imaging at 8 T and above can enable the anatomic visualization of microvascularity in normal and diseased brains (2, 3). MR imaging measurements of tumor hemodynamics are potentially useful in characterizing tumors because tumor aggressiveness and growth are associated with both endothelial hyperplasia and endothelial neovascularization (4). In addition to increased vascularity in tumors, new vessels and damaged mature vessels are permeable to contrast agents, unlike vessels in normal brain. Relative cerebral blood volume (rCBV) measurements reliably correlate with tumor grade and histologic findings of increased tumor vascularity (5–15). Vascular permeability may also be measured by using either T1- or T2- weighted imaging (16–18). Roberts et al (19) and Provenzale et al (17) demonstrated that vascular permeability is correlated with glioma grade. Recently, numerous animal experiments have investigated new tracers and techniques for measuring both blood volume and vascular permeability simultaneously (20–22).
In this study, we simultaneously examined rCBV and the volume transfer constant (Ktrans) in humans to determine their correlation with histologic grade. rCBV was calculated by using conventional intravascular indicator dilution theory (IIDT) (11, 23) and Ktrans, a parameter related to vascular permeability, was calculated from a two-compartment pharmacokinetic model (24). Both of these parameters were measured from the same dynamic, susceptibility-weighted, contrast-enhanced (DSC) MR imaging data. Although rCBV and vascular permeability have already been correlated with glioma grade, determining which parameter has a stronger correlation and whether rCBV and vascular permeability correlate with each other has not yet been fully investigated by using the same perfusion dataset. Furthermore, given that the glioma microenvironment is complex and heterogeneous, DSC MR imaging is used to measure an even more complex summation of vascular permeability, blood flow, vascular surface area, and hydrostatic and osmotic pressures (25, 26).
We hypothesized that rCBV and Ktrans may measure different parameters of tumor angiogenesis. First, reduced tumor perfusion (rCBV) or hypoxia stimulates mediators of angiogenesis such as vascular endothelial growth factor/vascular permeability factor (VEGF/VPF) (27). Reduced perfusion (rCBV) initiates the formation of new vessels, which are immature and leaky, resulting in an increase in Ktrans. Second, as these new vessels enlarge, rCBV increases with continued increases in Ktrans. Finally, with vessel maturation, rCBV continues to increase, moreso than Ktrans. Hence, rCBV and Ktrans may be correlated differently with glioma grade and they may not be correlated as strongly with each other, as each may be measuring different parameters in angiogenesis. In vivo determination of which parameter demonstrates a higher correlation with glioma grade not only provides insight into the stages of angiogenesis important for glioma grading but also aids in determining which parameters are more important in providing an unambiguous endpoint to anti-angiogenic therapies (28). We also hypothesized that Ktrans depends on a complex combination of vascular permeability, blood flow, vascular surface area, and hydrostatic and osmotic pressures and that these factors may affect the correlation between Ktrans and rCBV.
Methods
Patients and Histopathologic Analysis
We retrospectively reviewed data obtained from patients with a diagnosis of primary intracranial glioma who underwent MR examination at our institution between November 1999 and July 2002. A total of 73 patients had preoperative conventional and DSC MR imaging data suitable for evaluation. The patients were aged 4–85 years, with a mean age of 42 years. The group included were 47 male and 26 female patients. Approval for this study was obtained from the Institutional Board of Research Associates.
An experienced neuropathologist (D.Z.) performed the histopathologic evaluations. These were based on a modified Ringertz three-tier classification of gliomas (29), as follows: grade I = low-grade glioma (n = 31), grade II = anaplastic astrocytoma (n = 16), and grade III = glioblastoma multiforme (GBM; n = 26). The low-grade group (n = 31) included 21 gliomas and 10 low-grade oligodendrogliomas. Pilocytic astrocytomas were not included. Although they are classified as World Health Organization (WHO) grade I neoplasms, the nodule of enhancement often seen with these tumors demonstrates elevated rCBV and permeability, putting these tumors into a different group in terms of perfusion characteristics. Furthermore, only four patients were in the pediatric age group (adolescents or young adults). The grade II lesions were all anaplastic astrocytomas. Sixteen patients (21.9%, primarily with low-grade gliomas) underwent biopsy alone for histologic grading. Table 1 provides details regarding patient ages and histologic diagnoses.
TABLE 1:
Patient demographics and histologic diagnosis distributed by each age group
| Decade (year) | Low-Grade Glioma (n = 21) | Low-Grade Oligodendroglioma (n = 10) | Anaplastic Astrocytoma (n = 16) | GBM (n = 26) |
|---|---|---|---|---|
| 0–9 | 3 | 1 | 0 | 0 |
| 10–19 | 1 | 0 | 3 | 0 |
| 20–29 | 4 | 4 | 2 | 1 |
| 30–39 | 0 | 3 | 6 | 4 |
| 40–49 | 5 | 2 | 2 | 4 |
| 50–59 | 5 | 0 | 1 | 9 |
| 60–69 | 3 | 0 | 1 | 3 |
| 70–79 | 0 | 0 | 1 | 3 |
| 80–89 | 0 | 0 | 0 | 2 |
Conventional MR Imaging
Imaging was performed on 1.5-T systems (Vision or Symphony; Siemens, Erlangen, Germany). A localizing sagittal T1-weighted image was obtained, followed by nonenhanced axial T1-weighted spin-echo (TR/TE, 600/14), axial fluid-attenuated inversion recovery (FLAIR) (TR/TE/TI, 9000/110/2500) and T2-weighted (3400/119) images. Postcontrast axial T1-weighted imaging was performed following the acquisition of DSC MR imaging data.
DSC MR Imaging
DSC MR images were acquired with a gradient-echo echo-planar imaging sequence during the first pass of a standard bolus (0.1 mmol/kg) of gadopentetate dimeglumine (Magnevist; Berlex Laboratories, Wayne, NY). Seven to 10 sections were selected through the tumor on the basis of T2-weighted and FLAIR findings. Imaging parameters were as follows: field of view, 230 × 230 mm; section thickness, 5 mm; matrix, 128 × 128; in-plane voxel size, 1.8 × 1.8 mm; intersection gap, 0–30%; flip angle, 30°; and signal intensity bandwidth, 1470 Hz per pixel. Contrast medium was injected at a rate of 5 mL/s followed by a 20-mL bolus of sodium chloride solution at 5 mL/s. The injection rate was 5 mL/s in all patients, except for the four aged 0–9 years, in whom the rate was reduced to 3 mL/s. Although the rate of injection can theoretically affect Ktrans calculation, other cardiovascular parameters (eg, cardiac output and pulse pressure) can also theoretically affect Ktrans. Given that the reduction in rate was somewhat proportional to the reduction in the subject’s size and cardiovascular output, the overall effect on Ktrans should not have been greatly affected. A total of 60 images were acquired at 1-second intervals with the injection occurring at the 10th image.
rCBV Measurements
Standard algorithms were used to calculate rCBV from the DSC MR imaging data (11, 23). Data processing was performed on a Unix workstation with programs developed in-house by using C and IDL programming languages. Color overlay maps of rCBV were calculated. Four regions of interest (ROIs) were selected for rCBV calculation, and the maximal rCBV was obtained from these four ROIs. This method for the measurement of maximal abnormality provides the highest intraobserver and interobserver reproducibility in rCBV measurements (30). To minimize confounding factors in rCBV analysis, the size of the ROIs was kept constant (radius = 3.6 mm). The effects of contrast-agent leakage can be reduced by fitting a gamma-variate function to the curve of measured signal intensity versus time. The gamma-variate function approximates the curve that would have been obtained without recirculation or leakage. Despite this correction, cerebral blood volume (CBV) is overestimated in regions with substantial blood-brain barrier (BBB) disruption due to leakage and T1 effects. Therefore, in clinical practice, CBV measurements are made relative to the contralateral normal-appearing white matter, which acts as a standard internal reference. As a result, CBV measurements become a relative measure and are called rCBV, thereby further correcting for recirculation and leakage and reducing noise. Relative CBV measurements were obtained by a neuroradiologist (S.Y.) experienced with perfusion dataacquisition at our institution.
First-Pass Pharmacokinetic Modeling for Vascular Permeability
First-pass pharmacokinetic modeling (FPPM) (24) was used to calculate Ktrans from the same DSC MR imaging data used to calculate rCBV. FPPM applies an exact expression for tissue contrast-agent concentration, assuming that contrast agent exists in two interchanging compartments (plasma and the extravascular-extracellular space). An estimate of vascular contrast-agent concentration is acquired from normal white matter and fitted to the tissue concentration expression to derive Ktrans. In principle, it is possible to form maps of Ktrans on a pixel-by-pixel basis; however, the calculation is time-consuming and can be sensitive to noise. Instead, maps of the fractional signal intensity drop at 25 seconds after the bolus (SD25 maps) were calculated. If vascular permeability is high, residual contrast-agent concentration is also high after the bolus has passed, and the SD25 value is also high. The SD25 maps therefore provide a simple index related to vascular permeability that can be used to select ROIs for Ktrans calculation. Ktrans was calculated in ROIs demonstrating the highest SD25 values.
The following derivation for Ktrans is similar to that described by Tofts and Kermode (31) and follows the internationally agreed standardized nomenclature of Tofts et al (32).
Flow of tracer into the extravascular-extracellular space (EES) is described by Equation 1:
 |
1) |
where ve is the fractional EES volume, and Ce and Cp are the tracer concentrations in the EES and plasma, respectively.
The solution of the first-order differential equation (Eq 1) is as shown in Equation 2:
 |
2) |
Total tissue concentration, Ct, is shown in Equation 3:
 |
3) |
where vp is the fractional plasma volume.
An estimate of Cp is acquired from a region of normal white matter (33). This estimate can then be fitted to the model function (Eq 3), with Ktrans, ve and vp as fitting parameters.
Statistical Analysis
The Tukey honestly significant difference procedure was used to make pair-wise comparisons among the tumor grades with respect to rCBV and Ktrans, while unequal variance t tests were conducted to compare low-grade (grade I) versus high-grade (grades II or III) groups and also grades I and II versus grade III. P values less than .05 indicated significance.
The associations between rCBV and glioma grade, Ktrans and glioma grade, and rCBV and Ktrans were assessed by using Pearson product moment and Spearman rank correlation coefficients. Binary logistic regression was used to assess the diagnostic utility of using rCBV and Ktrans to discriminate high-grade (grade II or III) tumors from low-grade (grade I) tumors
Results
Values of rCBV and Ktrans are given in Table 2. Both rCBV and Ktrans were highest in GBMs (grade III/III), lowest in low-grade tumors (grade I/III), and intermediate in anaplastic astrocytomas (grade II/III). rCBV was significantly different between all three grades (P ≤ .0005; Table 2). Ktrans was significantly different between low-grade (grade I) gliomas and high-grade (grade II and III) gliomas (P = .027) but not between the other grades or combination of grades compared (Table 3). rCBV was strongly and positively correlated with tumor grade (Fig 1A). Ktrans also correlated positively with tumor grade, but more weakly (Fig 1B). rCBV and Ktrans were correlated only modestly (Fig 1C).
TABLE 2:
Maximal rCBV and maximal Ktrans by tumor grade
| Tumor Grade | rCBV* | Ktrans (seconds) |
|---|---|---|
| I/III | 1.75±0.85 | 0.00053 ± 0.0013 |
| II/III | 3.79 ± 1.48 | 0.0011 ± 0.0015 |
| III/III | 6.05 ± 2.22 | 0.0020 ± 0.003 |
Note.—Data are the mean ± standard deviation. Grade I = low-grade glioma, grade II = anaplastic astrocytoma, and grade III = GBM.
P < .0005.
P < .4662.
TABLE 3:
P values for the comparison of tumor grade with respect to rCBV and Ktrans
| Tumor Grade |
P Value |
|
|---|---|---|
| rCBV | Ktrans (second) | |
| I versus II* | <.0001 | 0.4662 |
| I versus III* | <.0001 | 0.0912 |
| II versus III* | .0005 | 0.4424 |
| I versus II and III† | <.0001 | 0.027 |
| I and II versus III† | <.0001 | 0.068 |
Note.—Grade I = low-grade glioma, grade II = anaplastic astrocytoma, and grade III = GBM.
Tukey honestly significant difference procedure.
Unequal variance t test.
Fig 1.

Correlation analysis of rCBV, K trans, and glioma grade.
A, rCBV and glioma grade were strongly correlated, with Spearman r = 0.817 (P = .0001) and Pearson r = 0.771 (P = .0004). The slope and its gradient are consistent with a strong positive correlation with highly significant P values.
B, A weaker correlation was observed between K trans and glioma grade: Spearman r = 0.234 (P = .046) and Pearson r = 0.277 (P = .017). Although the slope indicates a positive correlation, its gradient is less pronounced, with less significant P values than in A. Furthermore, more overlap is noted in K trans measurements than in the rCBV measurements in A.
C, Relationship between rCBV and Ktrans is characterized by a modest yet statistically significant Spearman rank correlation (r = 0.266; P = .023) and a weak, statistically insignificant Pearson product moment correlation (r = 0.163; P = .168).
D, Receiver operating characteristic curves for rCBV and Ktrans, as estimated from logistic regression. rCBV was a significant predictor of high-grade gliomas with higher sensitivity and specificity than Ktrans.
Logistic regression indicated that rCBV was a significant predictor of high-grade gliomas (P < .0001), whereas Ktrans was not (P = .07). The estimated receiver operating characteristic curves for rCBV and Ktrans are shown in Fig 1D. rCBV demonstrated higher sensitivity and specificity in predicting a high-grade glioma than Ktrans.
In all three glioma grades, the area of highest rCBV did not always correspond to the area of greatest enhancement or the area of greatest vascular permeability, as indicated by the SD25 maps. Figure 2 shows a low-grade astrocytoma (grade I/III) with a few foci of mildly elevated rCBV, whereas the SD25 map suggests low permeability throughout the lesion. Figure 3 shows rCBV and SD25 maps in an anaplastic astrocytoma (grade II/III). Moderately elevated rCBV and SD25 values were seen in the same areas around the periphery of the lesion. Figure 4 shows a GBM (grade III/III) with markedly elevated rCBV and SD25 values. However, the region of maximal rCBV elevation does not directly correspond to the regions of maximal SD25.
Fig 2.
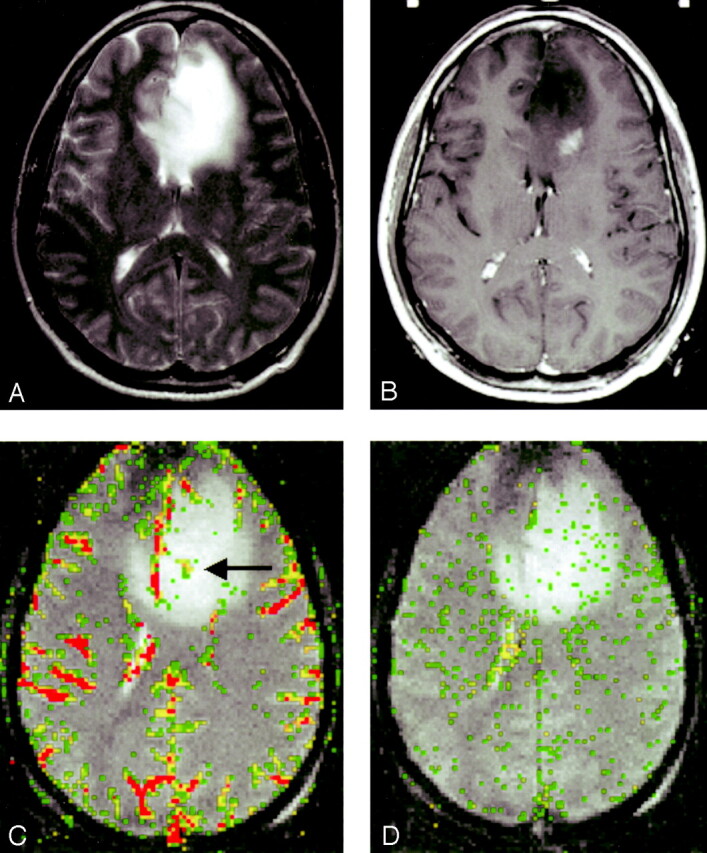
Low-grade astrocytoma (grade I/III).
A, T2-weighted image (3158/119) demonstrates bifrontal abnormalities in signal intensity centered primarily in the left frontal lobe.
B, Contrast-enhanced T1-weighted image (600/14/1) demonstrates an ill-defined focus of enhancement.
C, rCBV map demonstrates a few foci of mildly elevated perfusion (arrow), which are in a location different from the region of maximal enhancement in B.
D, SD25 color map suggests low permeability throughout the lesion.
Fig 3.
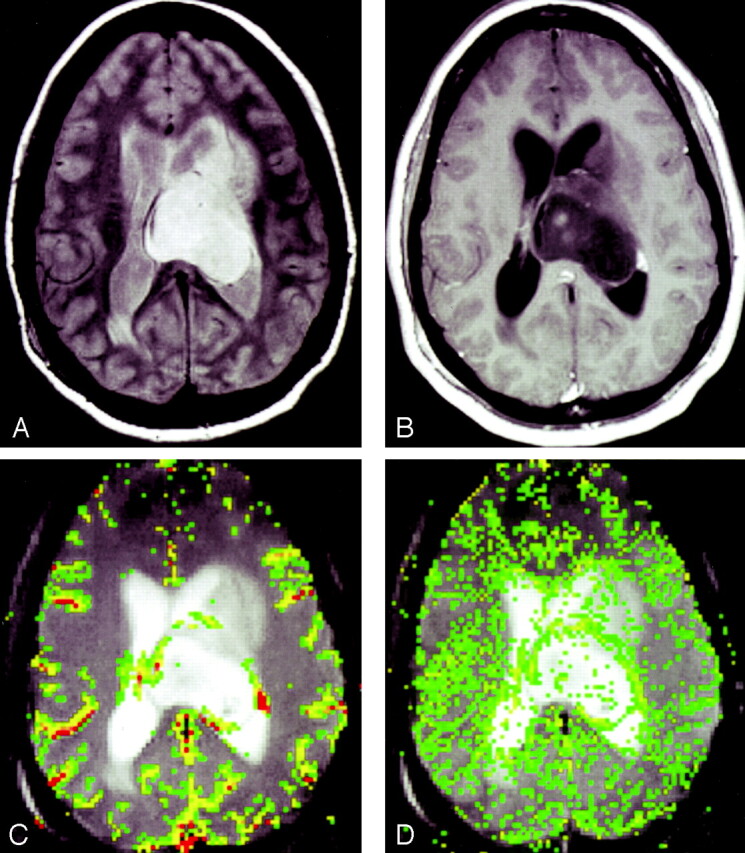
Anaplastic astrocytoma (grade II/III).
A, Proton density–weighted image (3158/17) demonstrates heterogeneous, left-sided paraventricular lesion extending into the left lateral ventricle. There is a small amount of vasogenic edema.
B, Contrast-enhanced T1-weighted image (600/14/1) demonstrates a small focus of peripheral enhancement.
C, rCBV map demonstrates elevated perfusion. On this occasion, the finding corresponds to the enhancing focus in B.
D, SD25 color map suggests intermediate permeability in the solid portions of this tumor.
Fig 4.
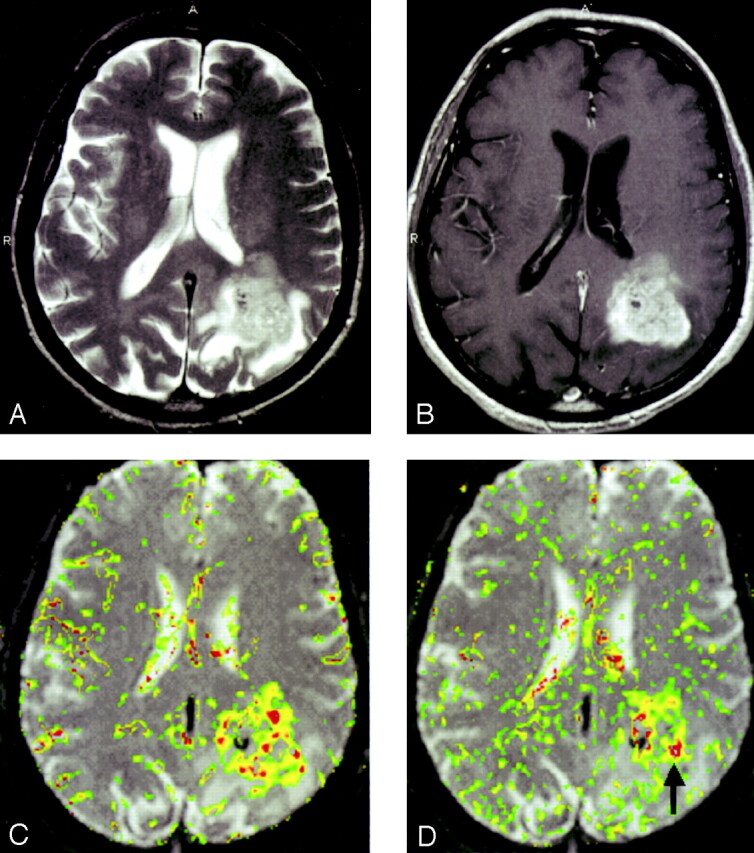
GBM (grade III/III).
A, T2-weighted image (3158/119/1) demonstrates a left parietal lesion with mass effect, edema, and signal-intensity heterogeneity. These are features of a high-grade glioma, such as a GBM.
B, Contrast-enhanced T1-weighted (600/14/1) with extensive, heterogeneous contrast enhancement.
C, rCBV map shows markedly elevated perfusion.
D, SD25 color map suggests markedly elevated permeability. Note that the areas of highest rCBV elevation do not directly correspond to the regions of highest SD25 (arrow).
Typical normalized signal-intensity curves for the three glioma grades were also plotted (Fig 5).
Fig 5.

Typical normalized signal-intensity curves for the three glioma grades studied. Grade I glioma demonstrates a shallow perfusion signal-intensity curve with SD25 after the bolus peak; this was relatively close to the prebolus baseline, suggesting relatively low permeability. Grade II glioma demonstrates a more substantial initial signal intensity drop, indicating higher rCBV with slower return to baseline. SD25 is considerably larger than that seen in grade I gliomas. Grade III glioma shows a larger area above the curve, indicating high rCBV with a similarly delayed return to baseline; this suggests high permeability.
Discussion
Vajkoczy and Menger describe endothelial proliferation as a common feature of glioma vasculature (34). This endothelial cell and vascular hyperplasia is thought to be related to three mechanisms: neovascularization (tumor angiogenesis), vascular intussusception (infiltration of vessel intima and tissue interstitium by tumor cells), and vascular cooption (recruitment of existing vessels by tumor). Histopathologically, endothelial proliferation is an important factor in determining glioma grade, with the other factors being nuclear atypia, mitoses, and necrosis (1). The diameter of normal cerebral capillaries has a limited range of 3–5 μm, whereas gliomas contain tortuous, hyperplastic vessels 3–40 μm in diameter (34). Furthermore, the endothelial thickness in glioma vessels is approximately 0.5 μm versus 0.26 μm in normal cerebral vessels. The cross-sectional luminal area of a vessel decreases with increased vessel-wall thickness. Although this may be true, gradient-echo sequences exploit the local paramagnetic susceptibility in the vessel lumen, the vessel wall, and the surrounding tissues, resulting in intravascular and extravascular spins undergoing a reduction of T2* signal intensity (35). Hence, increases in vessel diameter, vessel-wall thickness, and vessel number should lead to increased blood volume measurements made with DSC MR imaging. It is therefore not surprising that rCBV measurements are reliably correlated with tumor grade and histologic findings of increased tumor vascularity (5–15).
We found that rCBV was a more accurate predictor of tumor grade that than Ktrans in this three-tiered glioma classification system. rCBV distinguished all three groups of glioma grades (Table 2, Figs 2–4), whereas Ktrans distinguished only grade I from grades II and III combined (Table 3). This differentiation between low-grade gliomas and high-grade gliomas with permeability measurements is similar to findings of an earlier study of 12 patients by Provenzale et al (17). Although both rCBV and Ktrans correlate with the degree of vascular and endothelial proliferation, and hence glioma grade, our findings suggest that the correlation between vascular permeability and grade may not be as strong as expected. There may be a number of reasons for this finding. This result is consistent with previous findings from conventional MR imaging studies. Conventional, contrast-enhanced MR imaging provides evidence of contrast enhancement indicating breakdown of the BBB, which is often associated with higher tumor grade. However, contrast enhancement alone is not always accurate in predicting tumor grade. Ginsberg et al (36) demonstrated that a lack of enhancement in supratentorial gliomas does not indicate a low-grade glioma. In another study, all low-grade tumors showed contrast enhancement, but almost one-fifth of GBMs did not (11). In many lesions studied, the region of maximal rCBV from the rCBV map did not correspond to the region of maximal permeability suggested by the SD25 map (Fig 4C and D); therefore, the region of maximal vascular hyperplasia may not correspond to the region of maximal vascular permeability. In a study of human breast cancer, Rydland et al (37) also demonstrated that the tumor regions with high blood volume do not necessarily contain the vessels with highest permeability, and vice versa.
We found only a modest correlation between vascular volume (rCBV) and vascular permeability (Ktrans). At first sight, this relatively weak correlation is somewhat surprising, as Ktrans is the product of vascular permeability and vascular surface area (32). Therefore, we might expect a strong correlation because increases in vascular surface area would accompany increases in volume. However, there are potentially a number of confounding factors. First, Ktrans describes only the permeability-surface area product when the transport of tracer across the vessel wall is limited by permeability (32). When blood flow is slow, Ktrans becomes flow dependent. Second, as described earlier, the region of maximal rCBV from the rCBV map did not always correspond to the region of maximal permeability suggested by the SD25 map. More importantly, there are biologic reasons why increases in blood volume may not be accompanied by increases in vascular permeability. Vascular permeability should be strongly correlated with neovascularization and early angiogenesis when the proportion of immature, hyperpermeable vessels is relatively high (16). Such neovascularity can be seen in both gliomas and nontumoral conditions (1). On the other hand, although endothelial proliferation with concomitant vascular enlargement can result from neovascularization, it can also occur by other mechanisms. Some of the mechanisms presented earlier, such as vascular cooption and vascular intussusception, may recruit mature, existing vessels, leading to endothelial proliferation without a corresponding increase in vascular permeability. Conversely, animal studies have shown that disruption in the BBB, and hence increases in vascular permeability, can occur before neovascularization does (38). At least in the mouse model, increased rCBV may be a later phenomenon. Tumor hypoxia, an earlier phenomenon resulting in reduced blood volume (27), mediated angiogenesis, which later results in increased rCBV. In the complex development of gliomas, the following may therefore be possible: increases in vascular volume without increases in vascular permeability, increases in permeability without increases in volume, and increases in both to varying degrees. Another recent study also showed that perfusion (r = 0.62; P = .05) is correlated with microvascular density but that permeability is moderately correlated with maximal enhancement and not perfusion or microvascular attenuation (21). Hence, although overlap exists, evidence suggests that Ktrans and rCBV may be measuring different aspects of tumor angiogenesis.
In the early stages, tumor hypoxia leads to increased expression of hypoxia-inducible factor-1α (HIF-1α), which in turn mediates an increase in VEGF/VPF (27, 39) that stimulates the growth of new, immature, leaky blood vessels (neovascularization). In this phase, low rCBV is low and Ktrans is high. Then, as these vessels mature, vascular intussusception (infiltration of the vessel intima and tissue interstitium by tumor cells) and vascular cooption (recruitment of existing vessels by tumor) occurs, resulting in vascular hyperplasia and increased microvascular density (34, 39). This results in both elevated rCBV and elevated Ktrans. Finally, as these vessels mature further and the vascular basement membrane (which comprises and envelops maturing endothelial cells, pericytes, and blood-vessel smooth muscle cells [25]) becomes less permeable, rCBV continues to increase, moreso than Ktrans. This may partly account for the modest yet statistically significant correlation between rCBV and Ktrans.
Roberts et al (19) found a better correlation between Ktrans and tumor grade than between CBV and tumor grade. There are two possible reasons for this discordance with our results. First, the method used by Roberts et al was based on measurements acquired during the washout of contrast material from the tumor. At this time, vascular contrast-agent concentration is low relative to the extravascular concentration. Consequently, CBV measurements obtained in this way may be less accurate than IIDT measurements, which are acquired during the contrast bolus when the vascular concentration is high. Conversely, measurements of Ktrans obtained with FPPM may be less accurate than those of Roberts et al, because FPPM data are acquired only during the first pass of the bolus; however, this has yet to be determined. A second difference is that the method used by Roberts et al requires the leakage of contrast agent for accuracy; therefore, measurements can be made only when the BBB is disrupted. As discussed before, the largest rCBV values can sometimes be found in regions where the BBB is spared. There are two other differences between our approach and that of Roberts et al. Ours was based on T2* changes, and theirs, on T1 changes. Also, our method requires a correction for contrast-agent leakage, whereas their method inherently takes this into account. It is not clear, however, what effect these differences have on the measurements.
Our method has certain advantages over previously reported techniques. Methods that acquire data during washout of contrast material often require data collection over minutes. FPPM allows simultaneous calculation of rCBV and permeability acquired during the first pass of contrast material. The method is based on T2*-weighted imaging; therefore, confounding T1 effects are minimized. This eliminates the need to preload the patient with contrast agent, as in some previously described techniques. Curves of signal intensity versus time acquired during the bolus can provide a visual indication of not only the degree of signal-intensity drop (related to CBV) but also the vascular permeability, as demonstrated by the SD25 (Fig 5).
Although, in principle, it is possible to form maps of Ktrans on a pixel-by-pixel basis, the calculation can be sensitive to noise and time-consuming. We therefore calculated Ktrans only on the ROI data. However, to give a visual indication of contrast-agent leakage, we also calculated SD25 maps. The choice of 25 seconds was arbitrary but was based on our observation that the bolus had always passed and was returning to the baseline by that time but that it also always occurred within our 1-minute acquisition. If vascular permeability is high, residual contrast-agent concentration is also high after the bolus has passed, and hence, the SD25 value is also high. Conversely, if permeability is low, the signal intensity returns close to the precontrast baseline rapidly, and the SD25 value is low. Therefore, SD25 maps provide a simple index related to vascular permeability that can be used to select ROIs for Ktrans calculation. Ktrans was calculated in ROIs demonstrating the highest SD25 values. SD25 is not exactly correlated with vascular permeability because other factors (eg, cardiac output and contrast-agent dose) affect its value. However, when those factors are constant in one individual, a high correlation (though not a linear one) is likely. We previously found high correlations between empirical indices such as SD25 and more exact parameters (40).
There are, however, potential limitations in measuring vascular permeability during 60 seconds of imaging. Gliomas, particularly high-grade gliomas, are characterized by bizarre and extreme tortuosity in their angioarchitectural morphology. Blood flow can be extremely variable and heterogeneous in any given region of a tumor (26, 34). Indeed, multiple factors influence the leakiness of a blood vessel. These include luminal surface area; permeability of the vessel wall; blood flow; and hydrostatic, interstitial, and osmotic gradients across the endothelium (25, 26, 41). Hence, K trans may be underestimated if extremely slow flow or low hydrostatic/osmotic gradients is presentin a group of extremely tortuous vessels or if substantial vasogenic edema is present. Furthermore, if the measurement period is only the first 60 seconds of the first pass of contrast agent, delayed permeability might not be measured. For this reason, we are undertaking studies in a mouse glioma model to assess the optimal imaging parameters and the time course for determining vascular permeability and to objectively correlate these findings with those of Evan blue extravasation.
Another potential limitation of this study is that it examined only gliomas and not a random group of consecutive tumors; this might have falsely produced better differentiation. However, it is still important to demonstrate the potential utility of this technique in differentiating a subset of tumors that sometimes eludes differentiation with conventional MR imaging. A recent study demonstrated the ability of this technique in differentiating typical meningiomas (WHO grade I) and atypical meningiomas (WHO grade II) with pathologic confirmation; this further demonstrates the utility and validity of this technique (42). Additional studies with a random group of tumors may demonstrate the usefulness of these parameters in differentiating tumors such as mixed glial-neuronal tumors, gliomas, meningiomas, primitive embryonal tumors, and metastases.
Use of a gradient-echo echo-planar imaging sequence becomes problematic in the setting of substantial necrosis or hemorrhage. Notable susceptibility from necrosis and hemorrhage may have artifactually increased or decreased our measurements of rCBV and Ktrans. However, review of the conventional MR images demonstrated that few lesions (predominantly GBMs) had significant hemorrhage that would have adversely affected our measurements. Substantial mass effect from the tumor and vasogenic edema might also reduce vascular permeability, as this may alter the hydrostatic and interstitial gradients across vascular endothelium (25–27, 39). It would therefore be interesting to determine the relationship between the degree of vasogenic edema and mass effect on Ktrans measurements. Review of the T1 postcontrast studies demonstrated that 23 (88.5%) of 26 GBMs, 11 (68.8%) of 16 anaplastic astrocytomas, and 14 (45.1%) of 31 low-grade gliomas were enhancing. This suggests that contrast enhancement and permeability measurements were greater in high-grade gliomas than in low-grade gliomas. A moderate correlation (P = .21, Spearman rank correlation) was demonstrated between contrast enhancement and Ktrans, as reported by other investigators (21). There are a number of explanations for this moderate correlation. In some cases, the region of maximum vascular permeability did not correlate with the region of contrast enhancement. Our contrast enhancement data were based on the presence or absence of enhancement and not on the degree. This approach may explain the higher percentage of low-grade gliomas that demonstrated minimal enhancement and the moderate correlation between Ktrans and contrast enhancement.
The correlation between rCBV, Ktrans, and grade suggests that these methods for the in vivo characterization of glioma microvasculature are valid and reproducible in the simultaneous assessment of glioma vascularity and permeability (41). Our Ktrans values are similar to those Li et al (41) found in a group of five gliomas by using an approximate T1 method. Our values are slightly lower than those Parker et al (43) found in a single astrocytoma. Using an approximate T2* technique, Roberts et al found that Ktrans values in high-grade neoplasms were similar to our values, though the units were not specified (19). Therefore, our results are in reasonable agreement with those in the literature. Nonetheless, to our knowledge, no method of measuring Ktrans has been thoroughly validated, and the exact physiologic correlate is not known with certainty.
For neurosurgeons, any and all preoperative information about the nature of a glioma affects decision-making before and during surgery. This is especially true for the noted discordance between histopathologic grade and contrast enhancement. Supplemental information regarding the aggressive nature of a glioma may alter the neurosurgeon’s risk-benefit equation. Knowing preoperatively that a lesion is high grade can affect the decision to resect close to eloquent regions of the brain. Knowing the vascularity of a glioma may alter the planned size, shape, and extent of craniotomy. At our institution, patients with gliomas routinely undergo preoperative angiography to delineate the arterial supply, tumor vascularity, and venous drainage, as this information is helpful before and during surgery (44). After surgery, the vascularity of a lesion may enter into the decision to give aggressive adjuvant therapy. Although the pathology may be interpreted as low-grade, increased rCBV, considered along with proliferation indices, may be one of the characteristics of a lesion that induces the treating team to proceed with adjuvant therapy. It may well affect the choice of adjuvant therapies, especially the use of anti-angiogenesis strategies.
Conclusions
rCBV and vascular permeability measurements demonstrate modest correlation with each other and are correlated with histopathology to varying degrees. These tools provide physiologic information to supplement conventional imaging in predicting glioma grade. Statistically, rCBV is useful in distinguishing low, intermediate, and high grades (I, II, and III). Ktrans is helpful in differentiating between low-grade (grade I) and high-grade (grade II or III) tumors. There appears to be a stronger positive correlation between rCBV and glioma grade than between Ktrans and glioma grade. rCBV and Ktrans are positively, though not strongly, correlated; this suggests a complex relationship between these measures of the glioma microvascular environment. These two perfusion parameters may be related to different aspects of tumor microvasculature and may provide different information about tumor biologic behavior. At this time, we have not investigated whether Ktrans increases the power of glioma grading above and beyond rCBV alone. rCBV has been demonstrated to be superior to conventional MR imaging alone in predicting tumor grade (45). However, a similar study comparing rCBV, Ktrans, and conventional MR imaging is underway at our institution to determine which parameter or combination of parameters is most useful in a clinical setting to differentiate between low-grade gliomas and high-grade gliomas.
Footnotes
Supported by grant RO1CA093992 from the National Cancer Institute/National Institute of Health.
Presented at the annual meeting of the American Society of Neuroradiology, Washington, DC, April 2003.
References
- 1.Daumas-Duport C, Scheithauer B, O’Fallon J, Kelly P. Grading of astrocytomas: a simple and reproducible method. Cancer 1988;62:2152–2165 [DOI] [PubMed] [Google Scholar]
- 2.Christoforidis GA, Bourekas EC, Baujan M, et al. High resolution MRI of the deep brain vascular anatomy at 8 tesla: susceptibility-based enhancement of the venous structures. J Comput Assist Tomogr 1999;23:857–866 [DOI] [PubMed] [Google Scholar]
- 3.Christoforidis GA, Grecula JC, Newton HB, et al. Visualization of microvascularity in glioblastoma multiforme with 8-T high-spatial-resolution MR imaging. AJNR Am J Neuroradiol 2002;23:1553–1556 [PMC free article] [PubMed] [Google Scholar]
- 4.Burger P. Malignant astrocytic neoplasms: classification, pathology, anatomy, and response to therapy. Semin Oncol 1986;13:16–20 [PubMed] [Google Scholar]
- 5.Aronen HJ, Gazit IE, Louis DN, et al. Cerebral blood volume maps of gliomas: comparison with tumor grade and histologic findings. Radiology 1994;191:41–51 [DOI] [PubMed] [Google Scholar]
- 6.Bruening R, Kwong KK, Vevea MJ, et al. Echo-planar MR determination of relative cerebral blood volume in human brain tumors: T1 versus T2 weighting. AJNR Am J Neuroradiol 1996;17:831–840 [PMC free article] [PubMed] [Google Scholar]
- 7.Sugahara T, Korogi Y, Kochi M, et al. Correlation of MR imaging-determined cerebral blood volume maps with histologic and angiographic determination of vascularity of gliomas. AJR Am J Roentgenol 1998;171:1479–1486 [DOI] [PubMed] [Google Scholar]
- 8.Sugahara T, Korogi Y, Shigematsu Y, et al. Value of dynamic susceptibility contrast magnetic resonance imaging in the evaluation of intracranial tumors. Top Magn Reson Imaging 1999;10:114–124 [DOI] [PubMed] [Google Scholar]
- 9.Wong ET, Jackson EF, Hess KR, et al. Correlation between dynamic MRI and outcome in patients with malignant gliomas. Neurology 1998;50:777–781 [DOI] [PubMed] [Google Scholar]
- 10.Wong JC, Provenzale JM, Petrella JR. Perfusion MR imaging of brain neoplasms. AJR Am J Roentgenol 2000;174:1147–1157 [DOI] [PubMed] [Google Scholar]
- 11.Knopp EA, Cha S, Johnson G, et al. Glial neoplasms: dynamic contrast-enhanced T2*-weighted MR imaging. Radiology 1999;211:791–798 [DOI] [PubMed] [Google Scholar]
- 12.Cha S, Knopp EA, Johnson G, Wetzel SG, Litt AW, Zagzag D. Intracranial mass lesions: dynamic contrast-enhanced susceptibility- weighted echo-planar perfusion MR imaging. Radiology 2002;223:11–29 [DOI] [PubMed] [Google Scholar]
- 13.Lev MH, Rosen BR. Clinical applications of intracranial perfusion MR imaging. Neuroimaging Clin N Am 1999;9:309–331 [PubMed] [Google Scholar]
- 14.Shin JH, Lee HK, Kwun BD, et al. Using relative cerebral blood flow and volume to evaluate the histopathologic grade of cerebral gliomas: preliminary results. AJR Am J Roentgenol 2002;179:783–789 [DOI] [PubMed] [Google Scholar]
- 15.Petrella JR, Provenzale JM. MR perfusion imaging of the brain: techniques and applications. AJR Am J Roentgenol 2000;175:207–219 [DOI] [PubMed] [Google Scholar]
- 16.Roberts HC, Roberts TP, Ley S, Dillon WP, Brasch RC. Quantitative estimation of microvascular permeability in human brain tumors: correlation of dynamic Gd-DTPA-enhanced MR imaging with histopathologic grading. Acad Radiol 2002;9(Suppl 1):S151–S155 [DOI] [PubMed] [Google Scholar]
- 17.Provenzale JM, Wang GR, Brenner T, Petrella JR, Sorensen AG. Comparison of permeability in high-grade and low-grade brain tumors using dynamic susceptibility contrast MR imaging. AJR Am J Roentgenol 2002;178:711–716 [DOI] [PubMed] [Google Scholar]
- 18.Uematsu H, Maeda M, Sadato N, et al. Vascular permeability: quantitative measurement with double-echo dynamic MR imaging–theory and clinical application. Radiology 2000;214:912–917 [DOI] [PubMed] [Google Scholar]
- 19.Roberts HC, Roberts TPL, Brasch RC, Dillon WP. Quantitative measurement of microvascular permeability in human brain tumors achieved using dynamic contrast-enhanced MR imaging: correlation with histologic grade. AJNR Am J Neuroradiol 2000;21:891–899 [PMC free article] [PubMed] [Google Scholar]
- 20.Marzola P, Farace P, Calderan L, et al. In vivo mapping of fractional plasma volume (fpv) and endothelial transfer coefficient (Kps) in solid tumors using a macromolecular contrast agent: correlation with histology and ultrastructure. Int J Cancer 2003;104:462–468 [DOI] [PubMed] [Google Scholar]
- 21.Kiessling F, Krix M, Heilmann M, et al. Comparing dynamic parameters of tumor vascularization in nude mice revealed by magnetic resonance imaging and contrast-enhanced intermittent power Doppler sonography. Invest Radiol 2003;38:516–524 [DOI] [PubMed] [Google Scholar]
- 22.Bogin L, Margalit R, Mispelter J, Degani H. Parametric imaging of tumor perfusion using flow- and permeability-limited tracers. J Magn Reson Imaging 2002;16:289–299 [DOI] [PubMed] [Google Scholar]
- 23.Rosen BR, Belliveau JW, Vevea JM, Brady TJ. Perfusion imaging with NMR contrast agents. Magn Res Med 1990;14:249–265 [DOI] [PubMed] [Google Scholar]
- 24.Johnson G, Wetzel SG, Cha S, Bobb J, Tofts PS. Measuring blood volume and vascular transfer constant from dynamic, T2*-weighted contrast-enhanced MRI. Magn Res Med 2004;51: in press [DOI] [PubMed] [Google Scholar]
- 25.McDonald DM, Blank P. Significance of blood vessel leakiness in cancer. Cancer Res 2002;62:5381–5385 [PubMed] [Google Scholar]
- 26.McDonald DM, Choyke PL. Imaging of angiogenesis: from microscope to clinic. Nat Med 2003;9:713–725 [DOI] [PubMed] [Google Scholar]
- 27.Bhujwalla ZM, Artemov D, Natarajan K, Solaiyappan M, Kollars P, Kristjansen PEG. Reduction of vascular and permeable regions in solid tumors detected by macromolecular contrast magnetic resonance imaging after Treatment with antiangiogenic agent TNP-470. Clin Cancer Res 2003;9:355–362 [PubMed] [Google Scholar]
- 28.Robinson SP, McIntyre DJ, Checkley D, Tessier JJ, Howe FA, Griffith JR. Tumour dose response to the antivascular agent ZD6126 assessed by magnetic resonance imaging. Br J Cancer 2003;88:1592–1597 [DOI] [PMC free article] [PubMed] [Google Scholar]
- 29.Ringertz J. Grading of gliomas. Acta Pathol Microbiol Scand 1950;27:51–64 [PubMed] [Google Scholar]
- 30.Wetzel SG, Cha S, Johnson G, et al. Relative cerebral blood volume measurements in intracranial mass lesions: interobserver and intraobserver reproducibility study. Radiology 2002;224:797–803 [DOI] [PubMed] [Google Scholar]
- 31.Tofts PS, Kermode AG. Measurement of the blood-brain barrier permeability and leakage space using dynamic MR imaging: fundamental concepts. Magn Res Med 1991;17:357–367 [DOI] [PubMed] [Google Scholar]
- 32.Tofts PS, Brix G, Buckley DL, et al. Estimating kinetic parameters from dynamic contrast-enhanced T(1)-weighted MRI of a diffusible tracer: standardized quantities and symbols. J Magn Reson Imaging 1999;10:223–232 [DOI] [PubMed] [Google Scholar]
- 33.Leenders KL, Perani D, Lammertsma AA, et al. Cerebral blood flow, blood volume and oxygen utilization. Normal values and effect of age. Brain 1990;113(pt 1):27–47 [DOI] [PubMed] [Google Scholar]
- 34.Vajkoczy P, Menger MD. Vascular microenvironment in gliomas. J Neurooncol 2000;50:99–108 [DOI] [PubMed] [Google Scholar]
- 35.Sorensen AG, Reimer P. Cerebral MR Perfusion Imaging: Principles and Current Applications. New York: Thieme,2000
- 36.Ginsberg LE, Fuller GN, Hashmi M, Leeds NE, Schomer DF. The significance of lack of MR contrast enhancement of supratentorial brain tumors in adults: histopathological evaluation of a series. Surg Neurol 1998;49:436–440 [DOI] [PubMed] [Google Scholar]
- 37.Rydland J, BjOrnerud A, Haugen O, et al. New intravascular contrast agent applied to dynamic contrast enhanced MR imaging of human Breast cancer. Acta Radiologica 2003;44:275–283 [DOI] [PubMed] [Google Scholar]
- 38.Cha S, Johnson G, Wadghiri YZ, et al. Dynamic, contrast-enhanced perfusion MRI in mouse gliomas: Correlation with histopathology. Magn Reson Med 2003;49:848–855 [DOI] [PubMed] [Google Scholar]
- 39.Degani H, Chetrit-Dadiani M, Bogin L, Furman-Haran E. Magnetic resonance imaging of tumor vasculature. Thromb Haemost 2003;89:23–33 [PubMed] [Google Scholar]
- 40.Cha S, Lu S, Johnson G, Knopp EA. Dynamic susceptibility contrast MR imaging: correlation of signal intensity changes with cerebral blood volume measurements. J Magn Reson Imaging 2000;11:114–119 [DOI] [PubMed] [Google Scholar]
- 41.Li KL, Zhu XP, Checkley DR, et al. Simultaneous mapping of blood volume and endothelial permeability surface area product in gliomas using iterative analysis of first-pass dynamic contrast enhanced MRI data. Br J Radiol 2003;76:39–51 [DOI] [PubMed] [Google Scholar]
- 42.Yang S, Law M, Zagzag D, et al. Dynamic contrast enhanced perfusion MRI measurements of endothelial permeability: differentiation Between atypical and typical meningiomas. AJNR Am J Neuroradiol 2003;24:1554–1559 [PMC free article] [PubMed] [Google Scholar]
- 43.Parker GJ, Suckling J, Tanner SF, et al. Probing tumor microvascularity by measurement, analysis and display of contrast agent uptake kinetics. J Magn Reson Imaging 1997;7:564–574 [DOI] [PubMed] [Google Scholar]
- 44.Wetzel SG, Cha S, Law M, et al. Preoperative assessment of intracranial tumors with perfusion MR and a volumetric interpolated examination: a comparative study with DSA. AJNR Am J Neuroradiol 2002;23:1767–1774 [PMC free article] [PubMed] [Google Scholar]
- 45.Law M, Yang S, Wang H, et al. Glioma grading: sensitivity, specificity and predictive value of perfusion MRI and proton spectroscopic imaging compared with conventional MR imaging. AJNR Am J Neuroradiol 2003. :24:1989–1998 [PMC free article] [PubMed] [Google Scholar]