

Abstract
BACKGROUND AND PURPOSE: The assessment of whether brain development is at an appropriate level for age has become an integral part of clinical MR reporting, although few studies have quantitatively defined the developmental changes occurring in premature infants. We have developed a simple scoring system to assess four parameters of cerebral maturation—myelination, cortical folding, glial cell migration, and germinal matrix distribution—to determine the total maturation score (TMS). The aim of this study was to validate this scoring system in a large population of preterm infants across a range of gestational ages.
METHODS: A retrospective analysis was conducted of MR images acquired over a 3-year period with an identical imaging protocol. Infants born more than 14 days before the imaging examination and those with a clinical or radiologic history suggestive of neuroabnormality were excluded from the study. The TMS was derived by consensus. Interobserver agreement was evaluated by using the Bland-Altman plot.
RESULTS: Images from 134 infants (23–41 weeks' gestational age) were evaluated. The TMS was significantly related to the postmenstrual age of the infant, with the mean TMS for each age group increasing with advancing postmenstrual age. Interobserver agreement was found to be high (mean difference in score = 0.07, SD = 0.56).
CONCLUSION: This scoring system provides a standardized method for assessing cerebral maturation in the premature infant. The TMS is easy to calculate from standard MR images, is reproducible, and can help detect changes occurring within a postnatal age of a few weeks.
Increasing numbers of newborn infants are undergoing MR imaging of the brain as part of routine neonatal practice. The safety of the technique is well established, and a number of publications have documented the MR features of the newborn brain (1–11), many of which are not well demonstrated by either CT or cranial sonography. The progressive stages of fetal brain development have been well characterized by postmortem studies (12–14). Although neuronal migration is complete by 20 weeks' gestation, an enormous amount of development occurs in the fetal brain during the last trimester, including myelination of white matter, glial cell migration, and the development of a complex gyral pattern. Because these features can be documented on MR images, MR imaging provides a means of accurately assessing cerebral maturation in vivo.
A number of groups have attempted to quantitatively assess cerebral maturation using the findings on MR images. Scoring systems have been devised to grade myelination and cortical folding (3, 15) and more complex measurements of specific parameters have been formulated (4, 5, 16–18). However, many of these techniques are too complicated to apply in clinical practice or need to be modified to detect maturational change occurring in very preterm infants.
In addition to the progressive developmental changes in myelination and cortical folding, we and other authors have described two features of the neonatal brain that regress with increasing maturity, namely, the distribution of the subependymal germinal matrix and the appearance associated with glial cell migration (7–9, 11).
We have devised a scoring system based on the graded assessment of the four parameters of cortical folding, myelination, germinal matrix distribution, and glial cell migration on MR images. The aim of this retrospective study was to validate this scoring system in a large population of newborn infants and to determine whether this simple quantitative evaluation of cerebral maturation would be applicable in clinical practice and sufficiently sensitive to help detect minor maturational changes in the neonatal brain.
Methods
Patient Selection
During the 3-year period from October 1996 to October 1999, 367 infants admitted to the regional neonatal intensive care unit at the General Infirmary at Leeds underwent MR brain imaging as part of a larger research program, and these images formed the basis for this retrospective study. In addition, 15 parents of healthy infants on the postnatal wards were randomly selected and asked if they would consent to having their infants undergo an MR brain study.
To minimize the influence of postnatal factors on cerebral maturation and the potential bias of assessing developmental changes in a small number of infants, the study population included only infants whose postnatal age was less than 14 days on the day of MR imaging. In addition, infants with a history of cerebral infection, fits, hydrocephalus, or hypoxic ischemic encephalopathy, or infants found to have an abnormality on MR images (with the exception of isolated germinal matrix hemorrhage), were excluded from further analysis.
Gestational Age Assessment
Gestational age (GA) was confirmed in each infant on an antenatal sonogram at 18 to 20 weeks' gestation. Measurements of biparietal diameter and femur length were made and GA was derived from Chitty tables (19). In the case of a discrepancy between the sonographic data and maternal dates, further measurements of occipitofrontal circumference and abdominal circumference were made to determine the most accurate assessment of gestation.
Clinical Outcome
To support the premise that the study population selected did not include a significant number of infants with neurodevelopmental impairment, clinical outcome data were collected from a random sample of 15% of those infants undergoing MR assessment in the year between October 1996 and September 1997. The outcome was determined by telephone consultation with the practitioner most closely involved with the child's care at that time. Developmental screening records were accessed through the child's health visitor.
MR Acquisition
All infants underwent the same imaging protocol on a 1.5-T unit with a receive-only quadrature head coil. T2-weighted images were acquired in the axial and coronal planes, and T1-weighted images in the axial and sagittal planes. The parameters used for the T1-weighted spin-echo images were 800/13 (TR/TE), 180-mm field of view (FOV), 4-mm slice thickness with a 0.4-mm gap, and an imaging time of 3 minutes 52 seconds. The parameters for the T2-weighted fast spin-echo images were 6000/200, 180-mm FOV, 3-mm slice thickness with no gap, an echo train length of 13, and an imaging time of 5 minutes 12 seconds.
Images were obtained after a feeding, and the majority of the infants were imaged without the use of sedation. The head was immobilized by a pillow filled with polystyrene balls and molded into shape by vacuum extraction to minimize movement artifacts. The infants were continuously monitored with pulse oximetry and ECG recording, and a trained pediatrician was present at all times.
Scoring System
A further modification of the McArdle score (3, 15) was devised to highlight more subtle changes in myelination and cortical folding (Table). Myelination was scored separately on T1- and T2-weighted images. These scores were then averaged to give the myelination score. The distribution of the germinal matrix and the typical appearance of bands of migrating glial cells were graded on the basis of our previous studies (7, 9) (Table).
Scoring system to assess four parameters of cerebral maturation in preterm infants
Myelination and germinal matrix distribution were derived from assessment of the whole brain. For simplicity and reproducibility, cortical folding and glial cell migration scores were derived from assessment of the T1- and T2-weighted images closest to the foramen of Monro. The total maturation score (TMS) was calculated as the sum of the four separate scores. Figures 1 through 4 illustrate the MR appearance of different features across a range of postmenstrual ages.
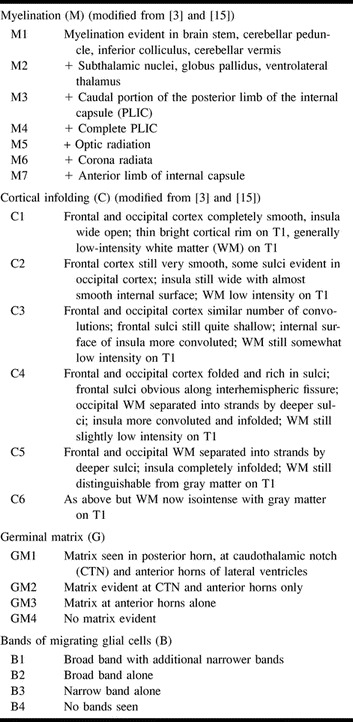
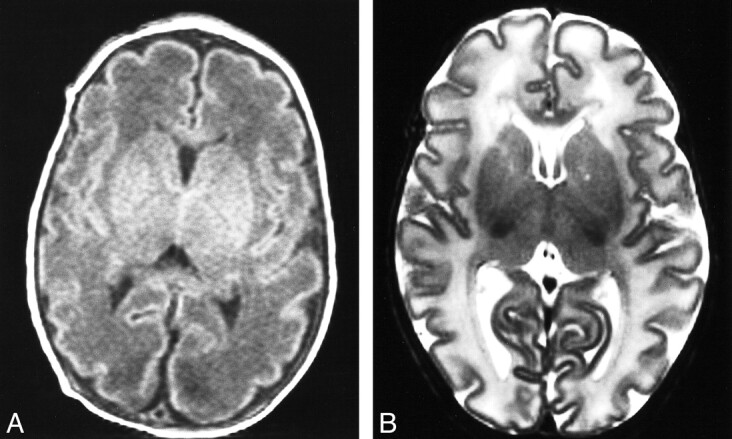
fig 1.
Germinal matrix distribution.
A, Axial T2-weighted image from an infant of 23 weeks' gestation (PMA = 24 weeks). Germinal matrix can be seen in the posterior horns (arrowheads), anterior horns (short arrows), and at the caudothalamic notch (long arrows). Score: GM1, B1, C1, M1; TMS = 4.
B, Axial T2-weighted image from infant of 27 weeks' PMA (GA = 25 weeks). Germinal matrix can be seen in same distribution as in A, but is much less evident. Score: GM1, B1, M2, C2; TMS = 6.
MR Analysis
The MR images were viewed on a stand-alone workstation, using proprietary software, by up to four trained operators. The individual scores, and hence the TMS, were reached by consensus.
Linear regression calculations were made with SPSS and Microsoft Excel software to determine whether the maturation score was related to the postmenstrual age (GA + postnatal age) of the infants.
Interobserver Agreement
To establish reproducibility, 58 images were assessed independently by two observers 6 months after the original analysis. The two operators were blinded to the postmenstrual ages of the infants and to each other's observations. The Bland-Altman plot (20) was used to evaluate any interobserver error.
Results
Study Population
One hundred thirty-four infants were enrolled in this study, including eight infants from the postnatal wards. The GAs ranged from 23 to 41 weeks. The median postmenstrual age (PMA) was 34 weeks (range, 24–43 weeks).
Sixty-six infants underwent MR imaging in the 12 months from October 1996 to September 1997. Clinical outcome data were obtained from 10 (15%) of the infants, whose median age was 3 years 10 months (range, 3 years 7 months to 4 years 3 months). Eight infants have now been discharged from regular hospital follow-up. One infant is being followed up for gastroesophageal reflux and one for developmental monitoring. The children's general practitioner and health visitor were contacted in each case, and hospital records were consulted for the two children still under hospital care. None of the infants had evidence of cerebral palsy or focal neurologic abnormality. Nine infants have made normal developmental progress, and one remains under review for mild global developmental delay.
Maturation Scores
The individual scores for myelination, cortical folding, germinal matrix distribution, and glial cell migration pattern all correlated with the maturity of the infants. However, the strongest association with PMA was seen for the TMS (Fig 5), with a Pearson coefficient of .84 and a correlation coefficient of .72. Linear regression analysis of the relation between TMS and PMA yielded a slope constant of .65 (95% confidence intervals = .58–.72). Therefore, the TMS is significantly related to increasing PMA (P < .001).
fig 5.

Graph plots TMS against PMA in weeks. Each infant is represented by a single point, although a number of points overlap (ie, four infants with a PMA of 34 weeks have a TMS of 8)
Because of the relatively small number of infants in each age group, it was not possible to calculate statistically valid reference ranges for different PMA groups. However, the mean TMS for each age group can be seen to increase with advancing PMA (Fig 6).
fig 6.

Graph shows different TMSs for different PMA groups. The graph has been plotted so that each infant is identifiable as a single point. Key to x-axis: numbers in boldface type = PMA (in weeks) of infants within each group; n = total number of infants in each group; μ = mean TMS for each age group
Interobserver Agreement
The Bland-Altman plot derived from 58 babies showed excellent correlation between the two independent observers (Fig 7), the mean difference in score being 0.07 (SD = 0.56). Thus, 2 SD of difference in score only represents ±1 of the TMS.
fig 7.

Bland-Altman plot with average TMS for each infant plotted against the difference in TMS between the observers for that infant. The points have been separated so that each infant can be identified. The solid line represents the mean difference in score (0.07); dotted lines represent 2 SD from the mean (1.12)
Discussion
We have devised a simple scoring system to evaluate cerebral maturation in preterm infants, in which four developmental parameters are graded to produce a maturation score. In this study we examined the brain MR images of a large population of healthy preterm infants, across a range of GAs, to validate this method of assessing brain development. We found that the TMS increases significantly with increasing PMA and has been sensitive enough to help detect changes in brain development occurring within a postnatal age of a few weeks. The score is easy to calculate from standard MR images and shows good interobserver agreement.
The assessment of cerebral maturation and of its applicability to an infant's overall maturity has become an important component of clinical MR analysis. In the past, such assessment has only been approximate, as the original descriptive reports involved few preterm infants (2, 3). The scoring system devised by McCardle et al (3) focused predominantly on postterm and older infants. Huppi et al (15) revised the system to compare maturation in a cohort of infants born at 32 weeks' gestation with that of a cohort of term infants, but this modified scoring system has not been applied to more premature infants. Other investigators have related specific parameters on MR images to overall cerebral maturation; however, these studies used techniques that were either too time-consuming or too complex to be of value in routine clinical practice. It has therefore been difficult to compare infants of similar PMA or to accurately monitor development longitudinally in those infants born extremely prematurely or who have sustained a cerebral insult.
A number of factors are thought to affect the development of the premature brain, including gestation, hypoxia, infection, congenital malformation, and genetic abnormality, although the precise effect and relative importance of each is unknown. It is still not clear whether extrauterine life provides increasing stimulus for brain development, albeit in a suboptimal environment, or whether brain maturation takes place at the same rate as in utero.
The study by Huppi et al (15), which looked at a cohort of 18 infants born at 32 weeks' gestation, suggested that maturation is delayed relative to that in a similar group of infants born at term. Studies by Ajayi-Obe et al (21) and Maalouf et al (11) also have shown maturational differences between infants born prematurely and those born at term, although the preterm populations studied included a number of infants known to have had a history of neurologic abnormality in the neonatal period. Delayed myelination (22–24) and delayed glial cell migration (9) have previously been noted in neurologically impaired infants. However, it is not clear what the mechanisms for such delay might be and whether all aspects of brain development are equally affected by a particular neurologic insult.
In this study we attempted to minimize the effect of extrauterine life on the normal pattern of brain development by excluding those infants whose MR images had been obtained after 14 days' postnatal age. In addition, we excluded infants with underlying clinical or radiologic evidence of neuroabnormality, and we looked at a much larger cohort than in previous studies to determine the range of normal variation in cerebral maturation and to reduce bias from those infants with as yet undetected neurologic impairment.
Conclusion
We developed a standardized method for assessing cerebral maturation in newborn infants that is easily incorporated into routine clinical reporting of neonatal MR images. This score can be used to monitor the progressive cerebral maturation of individual infants who have been subjected to direct neurologic or other more general insults, such as sepsis or hypoxia. It can also be used to assess cerebral maturation in different subgroups of infants, such as those with intrauterine growth retardation or those resulting from a multiple pregnancy, who are known to have a greater frequency of neurodevelopmental problems. We plan to develop this score further with a view to characterizing other developmental MR features noted in the premature brain.
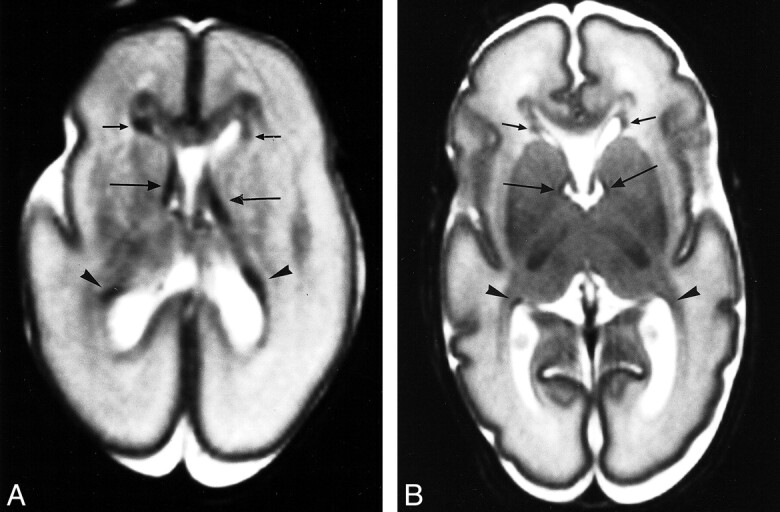
fig 2.
Myelination.
A, Axial T2-weighted image from an infant of 35 weeks' PMA (GA = 35). Myelination can be seen to have started in the posterior limb of the internal capsule (arrows). Score: GM2, B1, M3, C3; TMS = 9.
B, Axial T1-weighted image from an infant of 52 weeks' PMA, too old for this study and only included to illustrate features of myelination. Myelination is seen in anterior and posterior limbs of internal capsule, together with the optic radiation and corona radiata. The unmyelinated white matter is isointense with the gray matter. Score: GM4, B4, M7, C6; TMS = 21.
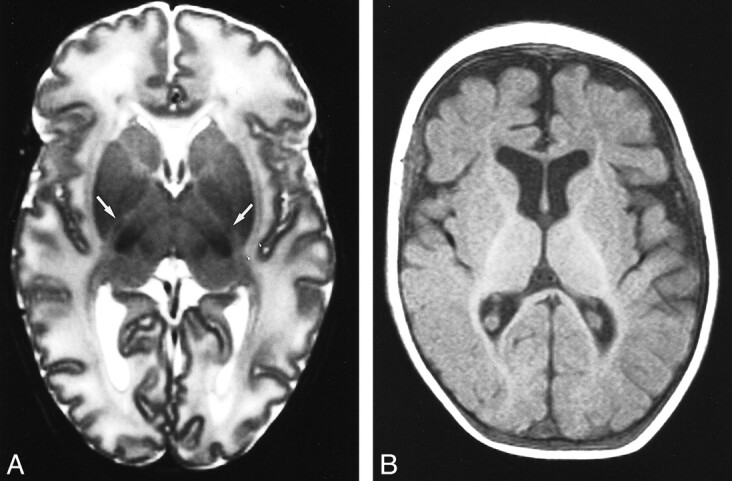
fig 3.
Bands of migrating glial cells.
A, Axial T2-weighted image through foramen of Monro in an infant of 35 weeks' PMA (GA = 35 weeks). A broad band of low signal intensity (arrows) with additional narrower bands (arrowheads) can be seen in the frontal periventricular white matter. Score: GM2, B1, M2, C2; TMS = 7.
B, Axial T2-weighted image from an infant of 42 weeks' PMA (GA = 42). There is no band of low signal intensity in the frontal periventricular white matter. Score: GM4, B4, M4, C5; TMS = 17.
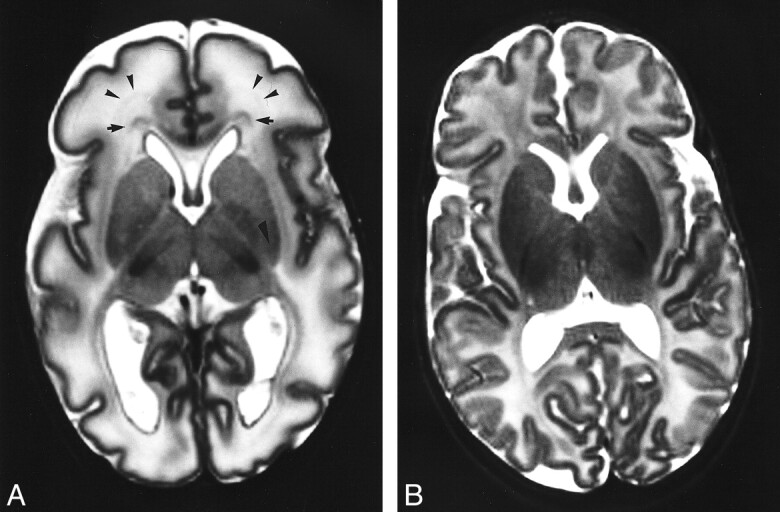
fig 4.
Cortical infolding.
A, Axial T1-weighted image from an infant of 34 weeks' PMA (GA = 34). The frontal and occipital cortices have a similar number of shallow convolutions, and the internal surface of the insula is developing convolutions. The unmyelinated white matter is of low intensity in relation to gray matter. Score: GM2, B1, M3, C3; TMS = 9.
B, Axial T2-weighted image from an infant of 36 weeks' PMA (GA = 36). The frontal and occipital cortices are folded and quite rich in sulci, with deeper sulci evident along the interhemispheric fissure. The insula is more convoluted, and the posterior white matter shows some separation into strands by deeper sulci than in the frontal cortex. Score: GM2, B2, M3, C4; TMS = 11.
Acknowledgments
We are indebted to the staffs of the neonatal unit and the MR department for their assistance. Many thanks to Darren Greenwood, Department of Medical Statistics, University of Leeds, for his advice, and to Catherine McAndrew, Department of Paediatrics, Leeds General Infirmary, for technical assistance.
Footnotes
Supported by a grant from the Special Trustees of Leeds General Infirmary.
Address reprint requests to Dr. Anne-Marie Childs, Division of Paediatrics, D Floor, Clarendon Wing, Leeds General Infirmary, Belmont Grove, Leeds LS2 9NS, UK.
References
- 1.Holland BA, Haas DK, Norman D, Brant-Zawadski M, Newton TH. MRI of normal brain maturation. AJNR Am J Neuroradiol 1986;7:201-206 [PMC free article] [PubMed] [Google Scholar]
- 2.Barkovich AJ, Kjos BO, Jackson DE, Norman D. Normal maturation of the neonatal and infant brain: MR imaging at 1.5T. Radiology 1988;166:173-180 [DOI] [PubMed] [Google Scholar]
- 3.McArdle CB, Richardson CJ, Nicholas DA, Mirfakhraee M, Hayden CK, Amparo EG. Developmental features of the neonatal brain: MR imaging, I: gray/white matter differentiation and myelination. Radiology 1987;162:223-229 [DOI] [PubMed] [Google Scholar]
- 4.van der Knaap MS, van Mezel-Meijler MD, Barth PG, Barkhof F, Ader HJ, Valk J. Normal gyration and sulcation in preterm and term neonates: appearance on MR images. Radiology 1996;200:389-396 [DOI] [PubMed] [Google Scholar]
- 5.Sie LTL, van der Knaap MS, van Mezel-Meijler MD, Valk J. MRI assessment of myelination of motor and sensory pathways in the brain of preterm and term-born infants. Neuropediatrics 1997;28:1-10 [DOI] [PubMed] [Google Scholar]
- 6.Battin M, Maalouf EF, Counsell S, Herlihy AH, Edwards AD. Magnetic resonance imaging of the brain of premature infants (letter). Lancet 1997;349:1741. [DOI] [PubMed] [Google Scholar]
- 7.Evans DJ, Childs AM, Ramenghi LA, Arthur RJ, Levene MI. Magnetic resonance imaging of the brain of premature infants (letter). Lancet 1997;350:522. [DOI] [PubMed] [Google Scholar]
- 8.Battin MR, Maalouf EF, Counsell SJ, et al. Magnetic resonance imaging of the brain in very preterm infants: visualization of the germinal matrix, early myelination and cortical folding. Pediatrics 1998;101:957-962 [DOI] [PubMed] [Google Scholar]
- 9.Childs AM, Ramenghi LA, Evans DJ, et al. MR features of developing periventricular white matter in preterm infants: evidence of glial cell migration. AJNR Am J Neuroradiol 1998;19:971-976 [PMC free article] [PubMed] [Google Scholar]
- 10.Barkovich AJ. MR of the normal neonatal brain: assessment of deep structures. AJNR Am J Neuroradiol 1998;19:1397-1403 [PMC free article] [PubMed] [Google Scholar]
- 11.Maalouf EF, Duggan PJ, Rutherford MA, et al. Magnetic resonance imaging of the brain in a cohort of extremely premature infants. J Pediatr 1999;135:351-357 [DOI] [PubMed] [Google Scholar]
- 12.Minkowski A. ed. The Myelogenetic Cycles of Regional Maturation of the Brain and Regulation of Brain in Early Life. Oxford: Blackwell; 1967
- 13.Feess-Higgins A, Larroche J-C. Development of the Human Foetal Brain: An Anatomical Atlas. Paris: Masson; 1987
- 14.Felderhoff-Mueser U, Rutherford MA, Squier WV, et al. Relationship between MR imaging and histopathologic findings of the brain in extremely sick preterm infants. AJNR Am J Neuroradiol 1999;20:1349-1357 [PMC free article] [PubMed] [Google Scholar]
- 15.Huppi P, Schuknecht B, Bossi E, Felberger J, Fusch C, Herschkowitz N. Structural and behavioural delay in postnatal brain development of preterm infants. Pediatr Res 1996;39:895-900 [DOI] [PubMed] [Google Scholar]
- 16.Ferrie JC, Barantin L, Saliba E, et al. MR assessment of the brain maturation during the perinatal period: quantitative T2 MR study in premature newborns. Magn Reson Imaging 1999;17:1275-1288 [DOI] [PubMed] [Google Scholar]
- 17.Huppi PS, Warfield S, Kikinis R, et al. Quantitative magnetic resonance imaging of brain development in premature and mature newborns. Ann Neurol 1998;43:224-235 [DOI] [PubMed] [Google Scholar]
- 18.Huppi PS, Maier SE, Peled S, et al. Microstructural development of human newborn cerebral white matter assessed in vivo by diffusion tensor magnetic resonance imaging. Pediatr Res 1998;44:584-590 [DOI] [PubMed] [Google Scholar]
- 19.Chitty LS, Altman DG, Henderson A, Campbell S. Charts of fetal size 1–4. Br J Obstet Gynaecol 1994;101:29-43 125–135 [DOI] [PubMed] [Google Scholar]
- 20.Bland JM, Altman DG. Statistical methods for assessing agreement between two methods of clinical measurement. Lancet 1986;1:307-310 [PubMed] [Google Scholar]
- 21.Ajayi-Obe M, Saeed N, Cowan FC, Rutherford MA, Edwards AD. Reduced development of cerebral cortex in extremely preterm infants. Lancet 2000;356:1162-1163 [DOI] [PubMed] [Google Scholar]
- 22.Dietrich RB, Bradley WG, Zaragoza EJ, et al. MR evaluation of early myelination patterns in normal and developmentally delayed infants. AJNR Am J Neuroradiol 1988;9:69-76 [DOI] [PubMed] [Google Scholar]
- 23.Johnson MA, Pennock JM, Bydder GM, et al. Clinical NMR imaging of the brain in children: normal and neurologic disease. AJR Am J Roentgenol 1983;141:1005-1018 [DOI] [PubMed] [Google Scholar]
- 24.van der Knaap MS, Valk J. Myelination and retarded myelination. In: Magnetic Resonance of Myelin, Myelination and Myelin Disorders. 2nd ed. Berlin: Springer; 1995:31–52