

Abstract
Summary: The purpose of this study was to evaluate collateral circulation by describing anterior cerebral artery and middle cerebral artery perfusion areas. Pairs of image sets spin labeled on the medial and lateral side were used. A pixel-by-pixel t test was performed, with blue gradation used to display lateral perfusion (ie, middle cerebral artery) and orange gradation for anterior cerebral artery perfusion. Extensions of anterior cerebral artery perfusion areas in cases of middle cerebral artery stenosis were described. This method may aid in estimation of collateral circulation for stroke treatment.
Perfusion of the cerebrum is covered by anterior cerebral artery (ACA), middle cerebral artery (MCA), and posterior cerebral artery. Watershed areas exist between territories of these arteries. The distribution of arterial perfusion changes by development of leptomeningeal anastomosis with hemodynamic changes by occlusion or stenosis of these arteries. Information on the distribution of arterial perfusion is important in evaluation of collateral circulation for management of ischemic diseases. However, the distribution of perfusion by each artery can be evaluated only by using conventional angiography.
The purpose of the present study was to establish a method of color-coded perfusion direction mapping by using arterial spin labeling focusing on ACA and MCA perfusion and to evaluate development of collateral circulation after stenosis or occlusion of MCA by describing ACA and MCA perfusion areas separately.
Methods
The study participants were 12 patients with MCA stenosis or occlusion and 12 control volunteers with intact MCAs. MCA stenosis was evaluated according to the North American Symptomatic Carotid Endarterectomy Trial method (1), and cases with >70% MCA stenosis were included in the MCA stenosis group. All participants provided informed consent for the imaging performed in this project.
We used arterial spin labeling to describe the direction of perfusion. For image sampling, a signal intensity targeting with alternating RF-half Fourier single shot turbo spin-echo (STAR-HASTE) sequence (10.9/87.0 [TR/TE]; matrix, 256 × 72; field of view, 300 mm; section thickness, 8 mm) was applied (2, 3). To determine directions of perfusion by arterial spin labeling, we made two sets of images: a set with saturation pulse on the medial side (medial set) and a set with saturation pulse on the lateral side (lateral set). The inversion time for spin labeling pulse was 800 ms. To reduce noise and obtain sufficient signals, we acquired 30 images for each image set. To compare signal intensity between the two image sets, we performed a t test, rather than simple subtraction. When the signal intensity of a pixel was greater in image sets with medial saturation than in those with lateral saturation, perfusion of the pixel was from the lateral side. A pixel-by-pixel t test was performed for each pair of images. We displayed P values by color code, with blue-colored gradation according to P value indicating perfusion from the lateral side (ie, perfusion by MCA) and orange-colored gradation indicating perfusion from the medial side (ie, perfusion by ACA); greater P values indicated greater perfusion.
To eliminate effects of CSF flow on half Fourier single shot turbo spin-echo images, we deleted the CSF signal intensity by thresholding before the t test. To evaluate distribution of ACA and MCA perfusion areas, we set up three imaging planes, as follows: plane A, sagittal plane, including internal carotid artery top (superior margin of internal carotid artery); plane B, 10-degree laterally tilted sagittal plane, including internal carotid artery top; plane C, 20-degree laterally tilted sagittal plane, including internal carotid artery top (Fig 1). Orange-colored areas within the region outside the lateral ventricle and anterior to the parietooccipital sulcus were considered areas with ACA perfusion. The ratios of areas with ACA perfusion were calculated in the above three planes for each case, and distributions of ACA areas were compared between the two groups.
Fig 1.
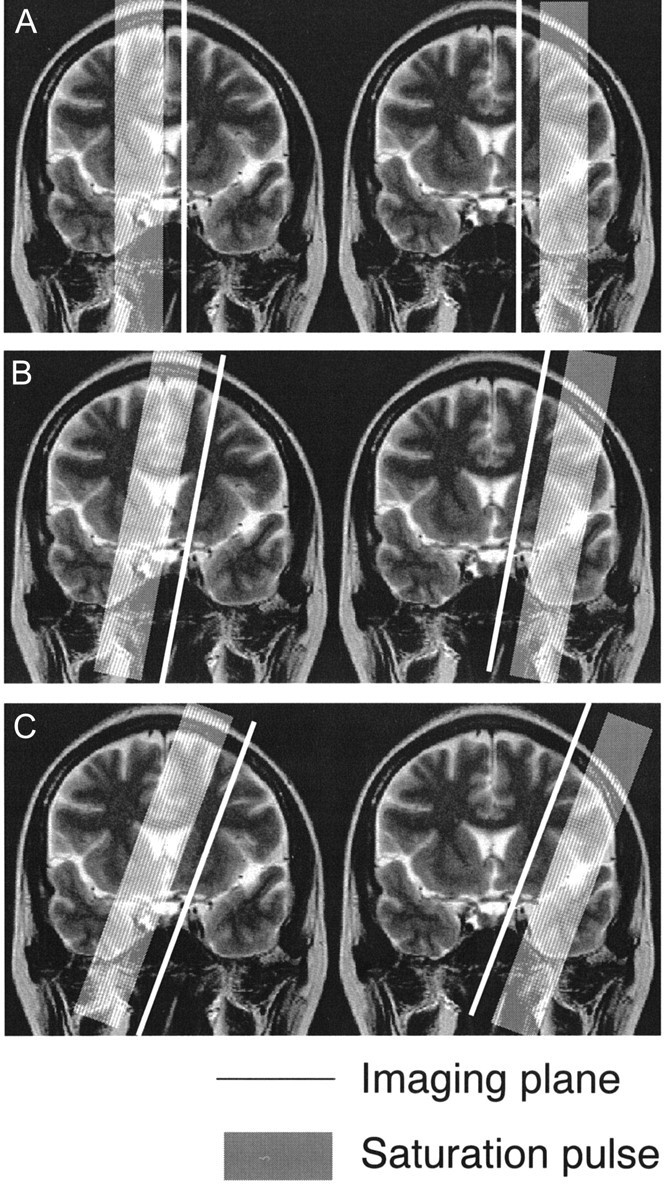
Imaging plane for arterial spin labeling method. We used three imaging planes: plane A, sagittal plane; plane B, 10-degree laterally tilted sagittal plane; plane C, 20-degree laterally tilted sagittal plane. All three imaging planes included the internal carotid artery top. ACA is located on the medial side of the imaging plane, and MCA is located on the lateral side. In the frontal lobe, plane A includes the superior frontal gyrus and plane C includes the middle frontal gyrus. Plane B is located around the superior frontal sulcus in most cases.
Results
With the above method, distribution of the area with perfusion from the lateral and medial sides was clearly described on color-coded perfusion direction maps (Figs 2–4). Percentage of area with ACA perfusion is shown in Figure 5. In participants with intact MCAs, mean ratios of areas with ACA perfusion were 80% on plane A, 59% on plane B, and 42% on plane C. Thus, as the imaging plane shifts to the lateral side, the areas with ACA perfusion become smaller. In participants with MCA stenosis or occlusion, mean ratios of areas with ACA perfusion were 79% on plane A, 68% on plane B, and 57% on plane C. The area with ACA perfusion was larger than that of participants with intact MCAs, especially in the more lateral planes, indicating lateral extension of areas with ACA perfusion.
Fig 2.

Images of a 50-year-old man with right internal carotid artery-posterior communicating artery aneurysm. Area with perfusion from the medial side is displayed by orange gradation, and area with perfusion from the lateral side is displayed by blue gradation. Three imaging planes were set up.
A, Plane A, sagittal plane, including internal carotid artery top. On plane A, the orange area (indicating perfusion from the ACA) is dominant (ratio of ACA area, 82%).
B, Plane B, 10-degree laterally tilted sagittal plane, including internal carotid artery top. On plane B, the blue area (indicating perfusion from the MCA) is becoming dominant (ratio of ACA area, 54%).
C, Plane C, 20-degree laterally tilted sagittal plane, including internal carotid artery top. On plane C, which is located near the superior frontal sulcus, the blue area is dominant (ratio of ACA area, 44%). Color scale shows P values.
D−F, Corresponding half Fourier single shot turbo spin-echo images are shown.
G, Digital subtration angiogram shows watershed (arrow) located in the middle of the middle frontal gyrus.
Fig 4.

Images of a 70-year-old man with MCA occlusion at horizontal part. Digital subtraction angiogram (D) shows that territory of ACA has spread wide into the lateral area (arrow). Area with ACA perfusion is larger in the tilted plane than in the images shown in Figures 2 and 3 (86% on plane A, 78% on plane B, and 79% on plane C). Color scale shows t values.
Fig 5.

Percentage of area with ACA perfusion in participants with intact MCAs and with MCA stenosis or occlusion. In participants with intact MCAs, as the imaging plane shifts to the lateral side, the areas with ACA perfusion become smaller. In participants with MCA stenosis or occlusion, the area with ACA perfusion is larger than in participants with intact MCAs.
Discussion
Perfusion of the cerebrum is covered by three artery systems, and borders between these systems are called watershed areas. Watershed areas are not fixed but may move according to dysfunction of a system. The ACA-MCA watershed area is located in the middle frontal gyrus. With hemodynamic changes from occlusion or stenosis of MCA or ACA, the watershed area moves via development of leptomeningeal anastomosis. Information regarding locations of watershed areas or distribution of ACA and MCA perfusion can aid description of collateral circulation in management of ischemic diseases (4–6).
Distribution of cerebral blood flow can be evaluated by radioisotope imaging. Also, bolus tracking MR perfusion imaging can be used to evaluate cerebral hemodynamics. These modalities are relatively noninvasive and widely used in clinical evaluation. However, they can only show overall flow information and cannot provide flow information for discrete arteries such as the ACA, MCA, and posterior cerebral artery. Flow information for specific arteries can be acquired only by conventional angiography, which is an invasive technique. Although MR angiography can provide morphologic information regarding arteries, flow distributions of peripheral regions cannot be evaluated. MR digital subtraction angiography is a new technique for imaging hemodynamics (7), but it does not provide sufficient information regarding peripheral circulation for evaluation of peripheral blood flow in regions such as watershed areas. Although the phase contrast method is a sequence that can provide information on flow direction, it is mainly used for angiography and not suitable for displaying tissue perfusion.
Arterial spin labeling is a method for describing brain perfusion based on MR imaging. In arterial spin labeling, flowing blood is used as a perfusion tracer for RF (STAR) labeling. Signal intensity targeting with alternating RF is a method of arterial spin labeling perfusion MR imaging that has the great advantage of “flow direction dependence,” unlike other perfusion imaging methods.
With the present trial, we attempted to differentiate regions with ACA and MCA perfusion by describing the direction of perfusion: from the medial side or lateral side of the imaging plane, respectively. The most unique aspect of the present imaging method was that it produced several sagittal oblique images arranged in a “fan” shape, with the hub of the fan at the top of the internal carotid artery. With this arrangement, flow from the medial side of the imaging plane is always from the ACA and flow from the lateral side of the plane is always from the MCA.
For sampling, we used the half Fourier single shot turbo spin-echo (HASTE) sequence (8), which is the only ultrafast sequence we can use with saturation pulse on our system. On half Fourier single shot turbo spin-echo images, CSF has a very high signal intensity, and signal intensity changes due to CSF flow are larger than signal intensity differences due to perfusion of brain parenchyma; this can be an obstacle to statistical processing. As described under Methods, we deleted the CSF signal intensity by thresholding before the t test to eliminate effects of CSF flow. However, it is very difficult to delete the CSF signal intensity by using only thresholding, and some CSF flow artifacts remained on the surface of the brain.
In the present study, the percentage of area with ACA perfusion was greater in the patients with MCA stenosis or occlusion, indicating enlarged ACA territory and lateral shift of watershed due to leptomeningeal anastomosis. The present method may also be useful in evaluation of chronic ischemic changes in situations such as course watching of moya-moya disease, which shows progressive intracranial arterial stenosis and alteration of arterial perfusion area. The method will also be useful in postsurgical evaluation of the superficial temporal artery-MCA bypass.
Conclusion
In cases with MCA stenosis or occlusion, extension of the area with ACA perfusion (indicating collateral circulation) was described on color-coded perfusion direction maps. Color-coded perfusion direction mapping is a noninvasive, useful tool for obtaining information regarding distributions of ACA and MCA perfusion that cannot be obtained by using conventional perfusion MR imaging. This information may aid in the evaluation of collateral circulation for the treatment of stroke.
Fig 3.

Images of a 45-year-old man with MCA stenosis at the horizontal part.
A, On plane A, area with ACA perfusion is 87%, which is similar to the ratio of the patient whose images are shown in Figure 2.
B and C, Tilted plane, however, shows that area with ACA perfusion did not diminish as in participants without MCA stenosis (70% on plane B and 69% on plane C). Color scale shows P values.
D, Digital subtraction angiogram shows that territory of ACA has spread into the lateral part of middle frontal gyrus, indicating lateral shift of watershed area (arrow).
References
- 1.North American Symptomatic Carotid Endarterectomy Trial Collaborators. Beneficial effect of carotid endarterectomy in symptomatic patients with high-grade carotid stenosis. N Engl J Med 1991;325:445–453 [DOI] [PubMed] [Google Scholar]
- 2.Chen Q, Siewert B, Bly BM, Warach S, Edelman RR. STAR-HASTE: perfusion imaging without magnetic susceptibility artifact. Magn Reson Med 1997;38:404–408 [DOI] [PubMed] [Google Scholar]
- 3.Hatabu H, Tadamura E, Prasad PV, Chen Q, Buxton R, Edelman RR. Noninvasive pulmonary perfusion imaging by STAR-HASTE sequence. Magn Reson Med 2000;44:808–812 [DOI] [PubMed] [Google Scholar]
- 4.Caviness VS, Makris N, Montinaro E, et al. Anatomy of stroke: part II. volumetric characteristics with implications for the local architecture of the cerebral perfusion system. Stroke 2002;33:2557–2564 [DOI] [PubMed] [Google Scholar]
- 5.Caviness VS, Makris N, Montinaro E, et al. Anatomy of stroke: part I. an MRI-based topographic and volumetric system of analysis. Stroke 2002;33:2549–2556 [DOI] [PubMed] [Google Scholar]
- 6.Coyle P, Heistad DD. Development of collaterals in the cerebral circulation. Blood Vessels 1991;28:183–189 [DOI] [PubMed] [Google Scholar]
- 7.Sakamoto M, Taoka T, Iwasaki S, et al. Detection of early venous filling in gliomas on MRI: preliminary study by 2D time-resolved dynamic contrast-enhanced MR angiography with echo-sharing technique. Magn Reson Imaging 2001;19:1193–1201 [DOI] [PubMed] [Google Scholar]
- 8.Ge Y, Korogi Y, Sugahara T, et al. Comparison between EPI and HASTE for ultra-fast MR imaging of the human brain. Neuroradiology 2001;43:1046–1055 [DOI] [PubMed] [Google Scholar]