Abstract
BACKGROUND AND PURPOSE: MR imaging and contrast-enhanced MR angiography have been used to detect evidence of spinal dural arteriovenous fistulae (AVF); however, the sensitivity and specificity of these techniques have not been shown. The purpose of this study was to establish the sensitivity, specificity, and accuracy of MR imaging alone compared with MR imaging plus MR angiography in determining whether dural AVF are present and to establish the accuracy of MR angiography in predicting fistula level.
METHODS: Twenty patients with surgically proven dural AVF (diagnosed with radiographic digital subtraction angiography) and 11 control patients who had normal digital subtraction angiography findings underwent routine MR imaging plus 3D contrast-enhanced MR angiography of the spine. Images were reviewed in two stages (stage I, MR images only; stage II, MR images plus MR angiograms) by three neuroradiologists who were blinded to the final diagnoses.
RESULTS: The sensitivity, specificity, and accuracy of the three reviewers in detecting the presence of fistulae ranged from 85% to 90%, from 82% to 100%, and from 87% to 90%, respectively, for stage I, compared with values of 80% to 100%, 82%, and 81% to 94%, respectively, for stage II. For each reviewer, there was no significant difference between the values for stages I and II; however, among the reviewers, one of the more experienced neuroradiologists had significantly greater sensitivity than a less experienced neuroradiologist for stage II. On average, the percentage of true positive results for which the correct fistula level was predicted increased from 15% for stage I to 50% for stage II, and the correct level ± one level was predicted in 73% for stage II. MR evidence of increased intradural vascularity was significantly greater in patients with dural AVF.
CONCLUSION: The addition of MR angiography to standard MR imaging of the spine may improve sensitivity in the detection of spinal dural fistulae. The principal benefit of MR angiography is in the improved localization of the vertebral level of the fistula, which potentially expedites the subsequent digital subtraction angiography study.
Spinal dural AVF is a lesion that can be easily misdiagnosed. It can mimic neoplasm or infection at physical examination and during noninvasive imaging studies (1, 2). It is important to recognize this lesion on MR images because surgical and endovascular treatments are relatively straightforward and are associated with low morbidity and mortality rates. The frequency with which various findings associated with dural AVF are observed on MR images has been reported by several groups (3–8). We are unaware, however, of any published articles reporting the sensitivity, specificity, and accuracy of standard MR imaging protocols in detecting spinal dural AVF. Furthermore, the effect of MR angiography, as an adjunct to current MR imaging protocols, on the accuracy of detecting untreated dural AVF has not been fully investigated. There have been a few studies documenting the appearance of spinal dural AVF in a series of cases using 3D contrast-enhanced MR angiography (8–14). The purpose of the present study was to determine the sensitivity, specificity, and accuracy of MR imaging without and with 3D contrast-enhanced MR angiography in the detection of spinal dural AVF and to determine the predictive value of MR angiography in locating the level of the fistula in a relatively large series of patients.
Methods
Study Participants
Twenty patients with dural AVF (age range, 41–72 years; mean age, 61 years) that were diagnosed based on spinal digital subtraction angiography (DSA) findings and were verified at surgery and 11 control patients (age range, 23–84 years; mean age, 56 years) who had normal DSA findings underwent MR imaging and 3D contrast-enhanced MR angiography of the spine on a 1.5−T whole body clinical MR imager between 1992 and 2000. The spinal region evaluated with MR imaging was chosen on the basis of clinical findings, as previously described (8). Nine of the patients with dural AVF and five of the control patients were drawn from previously published reports in which the 3D contrast-enhanced MR angiography technique for detecting intradural spinal vessels was described (8, 10, 15, 16).
Image Acquisition and Display
For the MR imaging part of the evaluation, the following images of the thoracic spine were acquired: T1−weighted sagittal and axial view spin-echo MR images (600/14–20/1–2 [TR/TE/number of excitations]; field of view, 26–30 cm; matrix, 210 × 256; section thickness, 3.5 mm; section gap, 0.5 mm), with and without IV administered contrast agent (0.2 mmol/kg gadopentetate dimeglumine); unenhanced fast spin-echo T2−weighted sagittal view MR images (4000/102–128/2; field of view, 28 cm; matrix, 192 × 256; section thickness, 3.5 mm; section gap, 0.5 mm); and gradient-echo sagittal view (before 1994) and axial view MR images (600–1100/18/1–4; flip angle, 20–30 degrees; field of view, 20–30 cm; matrix, 170–220 × 256; section thickness, 3.5 mm for sagittal view images and 6 mm for axial view images; section gap, 1 mm).
MR angiography was implemented using a 3D RF-spoiled FAST gradient-echo volume acquisition with the following parameters: 40–50/10; flip angle, 20 degrees; voxel, approximately 0.8 × 0.8 × 0.8 mm3; imaging time, approximately 10 min, as previously described (8, 15). The source images of the 3D data set, acquired immediately after completion of the IV administered bolus infusion of contrast agent, were parallel to the sagittal plane (sagittal slab); for some patients, a second 3D data set with coronal source images (coronal slab) was acquired. The transverse dimensions (anteroposterior and left-right) of the spinal canal were encompassed by the 3D volume. In the rostral/caudal direction, the field of view encompassed between seven and 11 vertebral levels. Spatial presaturation bands were applied to tissue outside the spinal canal, as previously described (8). The contrast-enhanced 3D MR angiography source images were acquired before the contrast-enhanced T1-weighted spin-echo MR images. Maximum intensity projection images in the sagittal and coronal planes were generated from the source images, following published procedures (8, 15). This post-processing step required an additional 30 min.
DSA was performed within 1 to 28 days of the MR examination. Segmental arteries were injected with 3 mL of iohexol (300 mg of iodine/mL of iohexol). The standard protocol was to inject all segmental arteries from the level of the vertebral/thyrocervical/costocervical branches to the level of the hypogastric branches. Images were obtained at a rate of two to four frames per second for 30 s, with 1024 × 1024 matrix resolution. The anterior spinal artery was identified in all cases.
Image Review
Three neuroradiologists who were blinded to the diagnosis for each participant retrospectively reviewed the randomized MR imaging and MR angiography studies. The level of experience of the neuroradiologists varied, with reviewers 1 and 2 having 26 and 15 years’s experience, respectively, as senior members of the American Society of Neuroradiology, and reviewer 3 having 2 years experience as a senior member. Reviewers 1 and 2 had similarly greater experience at the interpretation of MR images of the spine, based on estimates of the cumulative number of studies evaluated during the last 10 years by each of the reviewers. The reviewers had a working knowledge of MR angiography techniques and the appearance of spinal vessels on contrast-enhanced MR images and angiograms.
The MR studies of all participants were reviewed in two stages 1 week apart. In stage I, the reviewers evaluated only the images acquired during the MR imaging part of the study, as described above. In stage II, the reviewers evaluated maximum intensity projection and source images acquired during the MR angiography part of the study in conjunction with the images acquired during the MR imaging part. In each of the stages, the reviewers were asked to give ”yes“ or ”no“ answers to several questions.
For stage I, the questions were as follows. 1) Are intravascular ”flow voids“ that extend over at least three contiguous vertebral segments present in the extramedullary, intradural space on T2-weighted MR images? 2) Is serpentine enhancement that extends over at least three contiguous vertebral segments present in the extramedullary, intradural space on contrast-enhanced T1-weighted MR images? 3) Is a dural AVF present in this patient? If yes, what is the neural foraminal level or is it indeterminate?
For stage II, two questions requiring ”yes“ or ”no“ answers were asked. 4) Are there more than two medium or large vessels on the surface of the spinal cord on the MR angiography source and maximum intensity projection images? 5) Is a dural AVF present in this patient? If yes, what is the neural foraminal level or is it indeterminate?
For stage II, the reviewers were also instructed to characterize the appearance of the intradural vessels on MR angiography source and maximum intensity projection images. The instructions were as follows. 6) Estimate the tortuosity, defined as the number of turns per vertebral segment, of the dominant perimedullary vessel (17). 7) Estimate the length, defined as the length of the straight line connecting the two ends, of the longest contiguous perimedullary vessel in vertebral segments. 8) Categorize the size of the dominant intradural vessel as small, medium, or large, relative to the size of thoracolumbar posterior and anterior median veins shown on maximum intensity projection images of patients with normal spinal DSA findings (15).
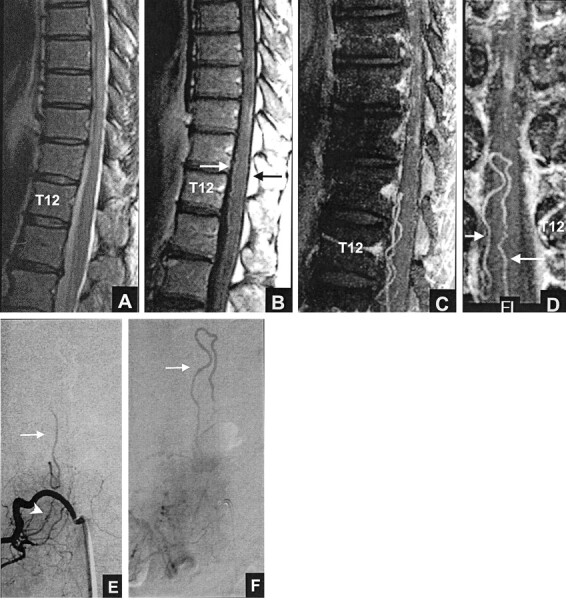
Figure 1 shows an example of a proven dural AVF that all three reviewers correctly identified as being present (true positive) based on MR imaging alone (”yes“ answer to question 3) and based on MR imaging plus MR angiography (”yes“ answer to question 5). When a reviewer answered ”yes“ to question 3, he or she was asked to assign a neural foraminal level to the suspected dural AVF. Similarly, when a reviewer answered ”yes“ to question 5, he or she was asked to assign a neural foraminal level. If the reviewer was unable to assign a level, the location was recorded as ”indeterminate.“ Five participants were excluded because the level of the fistula was not included in the field of view of the MR angiography 3D acquisition. Thus, the dural AVF group for this analysis consisted of 15 participants.
Fig 1.
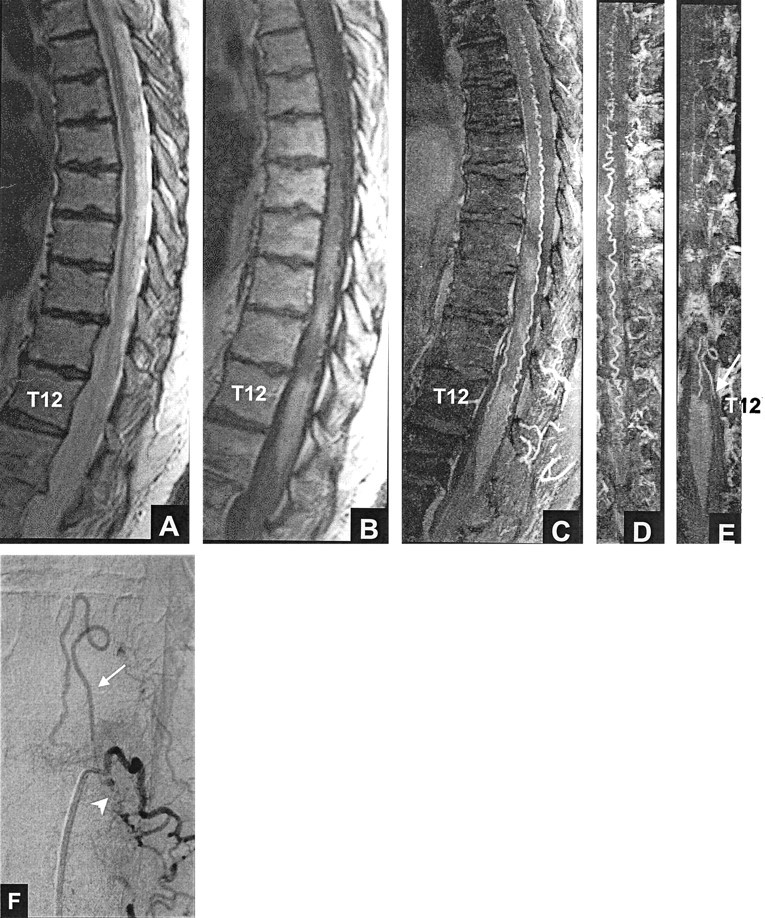
True positive result: left T12 dural AVF. All three reviewers thought that a fistula was present based on MR imaging (true positive, A and B) and based on MR imaging plus MR angiography (true positive, A–E).
A, Fast spin-echo T2-weighted MR image shows hyperintense cord from T9 to the conus tip and serpentine flow voids, consistent with enlarged intradural vessels, posterior to the cord from T6 to T10.
B, Contrast-enhanced T1-weighted MR image shows patchy enhancement within the cord from T9 to the conus tip.
C, Sagittal view maximum intensity projection image shows marked tortuosity of the posterior perimedullary vessel.
D, Coronal view maximum intensity projection image, targeted to the posterior half of the spinal canal.
E, Coronal view maximum intensity projection image, targeted to the mid-portion of the canal at the foraminal level, shows an enlarged, tortuous vessel (arrow) extending toward the left T12 foramen. The left T12 vessel corresponds to the posterior medullary vein.
F, Posteroanterior view DSA, obtained after injection of the dorsal ramus of the left T12 intercostal artery, shows the fistula (arrowhead) and draining medullary vein (arrow).
Data Analysis
The participants in the study were grouped as follows: patients with fistula proven by DSA and subsequent surgery (dural AVF group), patients with negative DSA findings (control group), and all patients together (total group). For each group, the Cochran Q test was used to determine the level of agreement of the reviewers’ responses (”yes“ or ”no“ answers) to questions 1 through 5. The responses to questions 3 and 5 were further analyzed using the McNemar χ2 test for related samples to make pair-wise comparisons between reviewers. Sensitivity, specificity, and accuracy for the detection of dural AVF by each reviewer were also calculated.
The numerical estimates of tortuosity and length (instructions 6 and 7 above) were compared among groups and among reviewers, and differences were tested for significance by repeated measures analysis of variance. The qualitative estimates of dominant vessel size (instruction 8) were analyzed using the χ2 test for marginal homogeneity.
Results
The sensitivity, specificity, and accuracy for the detection of dural AVF by MR imaging alone (stage I) and by MR imaging plus MR angiography (stage II) are presented in the Table. The analysis of the responses to questions about the presence of dural AVF (questions 3 and 5) revealed no significant differences among reviewers in either the stage I or the stage II evaluation of the control group and the total group. When the dural AVF group was analyzed, there was no significant difference among the reviewers for stage I; however, a significant difference between two reviewers was found for stage II (P = .039), with reviewer 3 correctly detecting dural AVF in only 16 of 20 cases, compared with 20 of 20 detected by reviewer 2. Figure 2 shows an example of a proven dural AVF that all three reviewers incorrectly scored as normal (false negative) based on MR imaging but that reviewer 2 correctly scored as dural AVF (true positive) based on MR imaging plus MR angiography.
Detection of the presence of dural AVF by MR imaging alone and by MR imaging plus MR angiography
| Sensitivity(%) |
Specificity (%) |
Accuracy (%) |
||||
|---|---|---|---|---|---|---|
| MRI | MRI + MRA | MRI | MRI + MRA | MRI | MRI + MRA | |
| R1 | 85 | 85 | 91 | 82 | 87 | 84 |
| R2 | 90 | 100 | 82 | 82 | 87 | 94 |
| R3 | 85 | 80 | 100 | 82 | 90 | 81 |
Note.—MMRI indicates MR imaging only; MRI + MRA, MR imaging plus MR angiography; R, reviewer.
Fig 2.
False negative result: right L1 dural AVF. None of the reviewers thought that a fistula was present based on MR imaging alone (false negative, A and B). After evaluating the MR angiograms, reviewer 2 thought that a dural AVF was present (true positive, A–D) and correctly predicted the fistula level at L1.
A, Midsagittal T2-weighted fast spin-echo MR image shows abnormal increased signal intensity in the cord from T8 to T10.
B, Contrast-enhanced T1-weighted MR image shows patchy enhancement in the cord from T8 to T10, as well as enhancing anterior (white arrow) and smaller posterior (black arrow) midline vessels.
C, Sagittal view maximum intensity projection image shows marked tortuosity of the anterior vessel(s), which is not as evident on the routine MR images shown in A and B.
D, Coronal view maximum intensity projection image, which encompasses the anterior half of the canal, reveals the continuity of a tortuous right L1 anterior medullary vein (short arrow) with the anterior median vein (long arrow).
E and F, Posteroanterior view DSA, obtained after injection of the right L1 lumbar artery, show the fistula (arrowhead) and draining medullary vein (arrows).
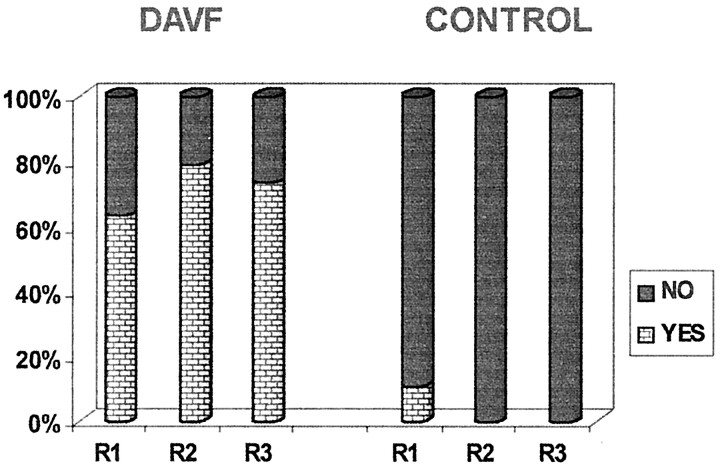
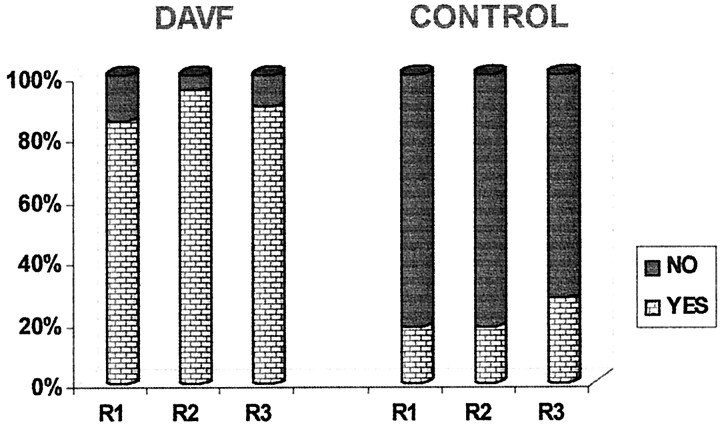
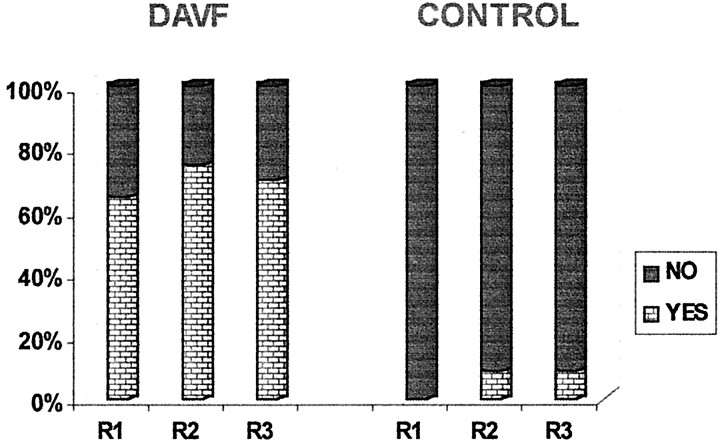
Histograms of the reviewers’ responses to the questions about flow voids (question 1) and serpentine enhancement (question 2) on MR images and the question of additional intradural vessels (question 4) on MR angiograms are presented in Figures 3, 4, and 5. The analysis of these responses for interobserver agreement revealed no statistically significant differences among reviewers for each of the three study groups. As can be seen in Figures 3 through 5, the detection of flow voids and serpentine enhancement on MR images and the detection of an increased number of major vessels on the cord surface on MR angiograms were each strongly associated with the presence of dural AVF. The detection of intradural serpentine enhancement was the finding most frequently associated with the presence of dural AVF. Conversely, the absence of flow voids, serpentine enhancement, and increased number of vessels were strongly associated with the absence of dural AVF. The absence of flow voids had the strongest association with the control (normal intradural vessels) condition.
Fig 3.
Graph depicts detection of intradural flow voids on T2−weighted MR images. DAVF (proven fistula) and CONTROL refer to the study groups; R1, R2, and R3 refer to the reviewers.
Fig 4.
Graph depicts detection of intradural serpentine enhancement on contrast-enhanced T1-weighted MR images. DAVF and CONTROL refer to the study groups; R1, R2, and R3 refer to the reviewers.
Fig 5.
Graph depicts detection of more than two major vessels on the cord surface on MR angiography source and maximum intensity projection images. DAVF and CONTROL refer to the study groups; R1, R2, and R3 refer to the reviewers.
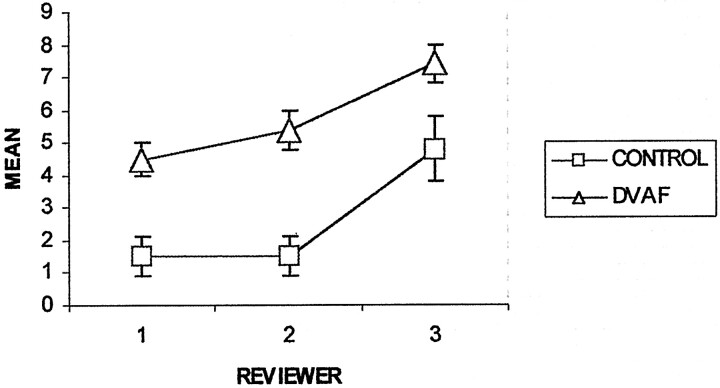
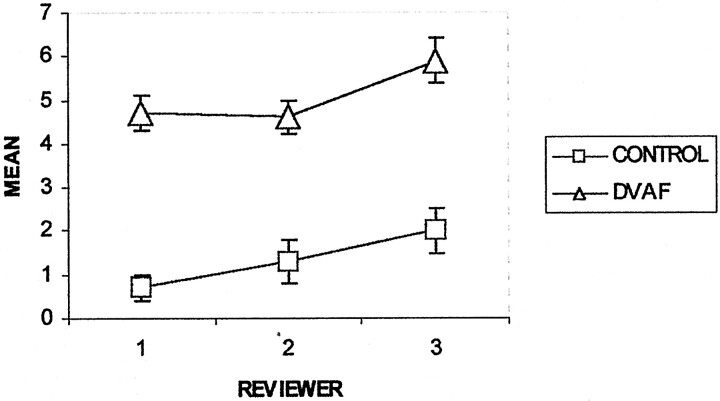
The mean values and standard errors of the tortuosity (instruction 6) and the length (instruction 7) of the dominant perimedullary vessel for each group and each reviewer are shown in Figures 6 and 7. The mean tortuosity for the dural AVF group was significantly greater than that for the control group for each reviewer (P<.001 for reviewers 1 and 2, P = .026 for reviewer 3) and for all the reviewers considered together (P <.001) (Fig 6). Within groups, reviewer 3 had significantly higher mean values of tortuosity compared with reviewer 1 (dural AVF, P <1; control, P = .005) and reviewer 2 (dural AVF, P = .008; control, P = .003). For example, within the dural AVF group, reviewer 3 reported a mean tortuosity of 7.4 ± 0.62 turns per vertebral segment compared with values of 4.5 ± 0.46 and 5.4 ± 0.6 reported by reviewers 1 and 2, respectively. The differences in tortuosity perceived by reviewer 3 compared with those perceived by reviewers 1 and 2 may have affected decisions regarding the presence or absence of fistulae. Figure 8 shows the spin-echo images and MR angiograms of a control patient with relatively high values of tortuosity (5.3 turns/segment, highest value for the control group). Reviewers 1 and 2 scored this case as positive (false positive) for the presence of dural AVF, based on MR imaging alone and based on MR imaging plus MR angiography, whereas reviewer 3 correctly scored the case as negative.
Fig 6.
Graph depicts mean tortuosity of the dominant intradural vessel on MR angiograms. CONTROL (n = 11) and DAVF (n = 20) refer to the study groups. The ordinate (y axis) has units of ”turns/vertebral segment.“ Error bars indicate standard error of the mean.
Fig 7.
Graph depicts mean length of the dominant intradural vessel on MR angiograms. CONTROL (n = 11) and DAVF (n = 20) refer to the study groups. The ordinate (y axis) has units of ”vertebral segments.“ Error bars indicate standard error of the mean.
Fig 8.
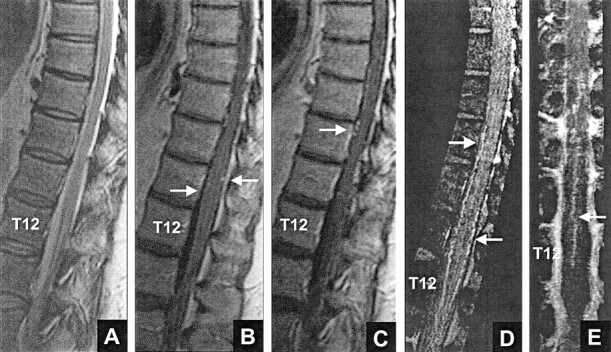
False positive result for reviewers 1 and 2: normal intradural vessels. Both reviewers thought that a fistula was present based on MR imaging (false positive, A–C) and based on MR imaging plus MR angiography (false positive, A–E).
A, Midsagittal T2-weighted fast spin-echo MR image shows normal size and signal intensity of the cord.
B and C, Contrast-enhanced T1−weighted MR images show no intrinsic cord enhancement. Enhancing linear segments (arrows) on the cord surface are noted.
D, Contrast-enhanced MR angiogram. Sagittal view maximum intensity projection image encompasses the midline vessels. The vessels (arrows) correspond to the anterior and posterior median veins.
E, Coronal view maximum intensity projection image encompasses approximately the anterior 10% to 20% of the canal and shows a midline vessel (arrow) with features of the anterior median vein.
The mean length for the dural AVF group was significantly (P < .001) greater than that for the control group, for each reviewer and for all the reviewers considered together (Fig 7). The mean length per reviewer 3 was significantly higher than that per reviewer 1 within each group (dural AVF, P = .001; control, P = .003). The mean length per reviewer 3 was significantly higher than that per reviewer 2 within the dural AVF group (P = .004) and approached significance within the control group (P = .07). Within the dural AVF group, for example, the mean length and standard error per reviewer 3 was 5.9 ± 0.5 vertebral segments compared with values of 4.7 ± 0.36 and 4.6 ± 0.38 segments per reviewers 1 and 2, respectively. The mean values per reviewers 1 and 2 did not differ significantly within either group.
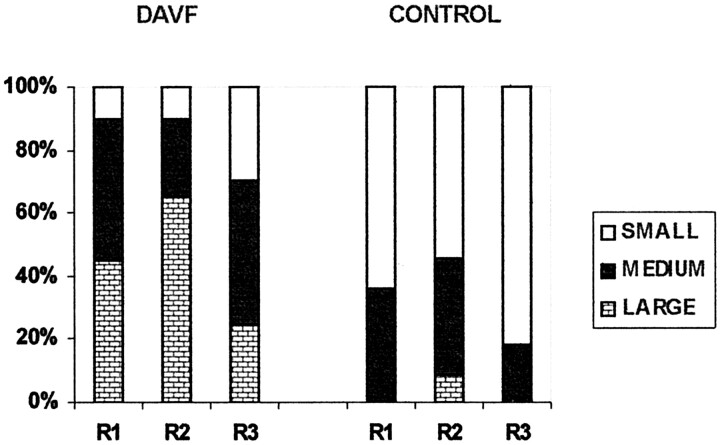
The distribution of sizes reported for the dominant intradural, perimedullary vessel for the dural AVF and control groups, by reviewer, are presented in Figure 9. Comparing groups, the size estimates for the dural AVF group were significantly increased compared with the size estimates for the control group, for each reviewer alone (reviewer 1, P = .002; reviewer 2, P = .005; reviewer 3, P = .017) and for all reviewers considered together (P < .001). Comparing reviewers, the size estimates by reviewer 3 were significantly smaller than the size estimates by reviewer 1 (P = .012) and reviewer 2 (P = .002). There was no significant difference in the size estimates by reviewer 1 and reviewer 2. As illustrated in Figure 9, each reviewer tended to favor a different size range: reviewer 1 tended to classify the major intradural vessel as medium, reviewer 2 as large, and reviewer 3 as small.
Fig 9.
Graph depicts sizes of dominant intradural vessels on MR angiograms. DAVF (n = 20) and CONTROL (n = 11) refer to the study groups; R1, R2, and R3 refer to the reviewers. Small, medium, and large refer to qualitative estimates of size, as described in the text.
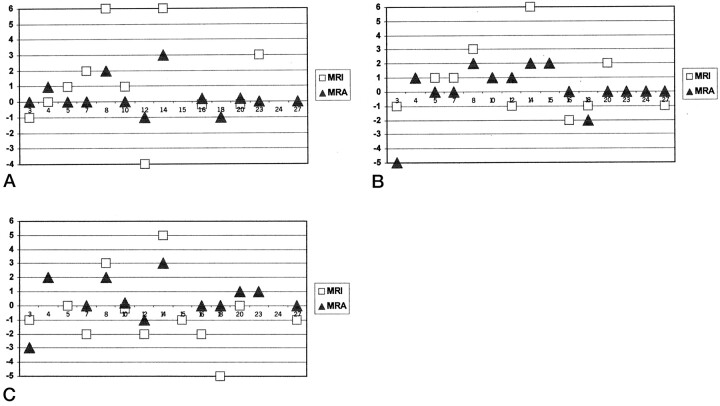
Each reviewer was asked to estimate a fistula level in the patients suspected of having dural AVF based on MR imaging (stage I, question 3) and/or based on MR imaging plus MR angiography (stage II, question 5). By reviewer, the ratio of ”indeterminate“ levels to true positive dural AVF results was as follows: reviewer 1, 2/13 (stage I) and 0/13 (stage II); reviewer 2, 4/14 (stage I) and 0/15 (stage II); reviewer 3, 1/13 (stage I) and 0/12 (stage II).
As shown in Figure 10, the deviation of the estimated level from the correct level was generally larger for the estimates based on MR imaging alone than for those based on MR imaging plus MR angiography. On average, the correct level was predicted in 15% of the patients with true positive results based on MR imaging alone and in 50% of the patients with true positive results based on MR imaging plus MR angiography. The estimated level corresponded to the correct level ± one vertebral segment in 43% of patients with true positive results based on MR imaging alone and in 73% of patients with true positive results based on MR imaging plus MR angiography. This difference was statistically significant (χ2 = 5.76, P = .016).
Fig 10.
Graphs depict estimation of vertebral levels of dural AVF by reviewers 1, 2, and 3 based on MR imaging alone (squares) and based on MR imaging plus MR angiography (triangles). Numbers on the y axis refer to the deviation (in vertebral segments) of the estimates from the correct levels of the fistulae (positive numbers, craniad; negative numbers, caudad). Numbers on the x axis are the case numbers assigned to the patients with documented dural AVF. The absence of a square or triangle for a case indicates that the reviewer did not suspect fistula (false negative) or that fistula was suspected but the level was indeterminate. MRI, MR imaging; MRA, MR angiography.
Discussion
The sensitivity, specificity, and accuracy of MR imaging alone or in combination with MR angiography in the detection of untreated spinal dural AVF have not previously been reported. Based on comparisons between the true positive rates of detection by MR angiography and MR imaging, some authors have concluded that MR angiography is more sensitive in detecting the presence of new or recurrent fistulae (8, 14). Earlier studies, however, did not include a control group, and reviewers were not blinded to the diagnosis in each case. The results presented in the Table are derived from a controlled, randomized, and blinded retrospective study.
Based on MR imaging alone (Table 1, ”MRI“ columns), no significant difference was found among the reviewers for sensitivity, specificity, or accuracy in detecting the presence of dural AVF. When MR images plus MR angiograms were evaluated (Table, ”MRI+MRA“ columns), a significant difference in sensitivity was found among the reviewers. The sensitivity increased to 100% for reviewer 2 and decreased to 80% for reviewer 3. The results suggest that MR angiography may improve the sensitivity of MR imaging in detecting dural AVF when an experienced neuroradiologist (reviewer 2) interprets the combined study. The experienced neuroradiologist possibly draws on his or her knowledge of spinal vascular anatomy and familiarity with the appearance of intradural vessels on contrast-enhanced MR angiograms to achieve higher sensitivity.
For each reviewer (Table 1, row R1, R2, or R3), the sensitivity, specificity, and accuracy for detecting the presence of fistulae based on MR imaging alone were not significantly different from the corresponding values based on MR imaging plus MR angiography. Although not significant, the specificity of MR imaging plus MR angiography was less than that of MR imaging alone (reviewers 1 and 3). This may in part be because of the study design, which required that the control group have normal DSA findings. Considering that only the more uncertain cases based on MR angiography are sent for DSA at our hospital, the control group tended not to have straightforward negative MR angiographic findings (15). This design could potentially select for cases more likely to be false positives when MR angiography is combined with MR imaging (Fig 8), resulting in a lower specificity (specificity = true negative/[true negative + false positive]). When a more specific and sensitive test (DSA in this study) is performed after a screening examination, high sensitivity is often preferable to high specificity. The lost opportunity to diagnose a treatable disease potentially has a greater effect on patient morbidity than does the risk incurred by patients without dural AVF (false positives) who undergo invasive DSA.
Another potential shortcoming resulting from the study design is that sensitivity and specificity calculations could be confounded because of the use of previously published cases in addition to newly reported cases. Although possible, this is unlikely for several reasons. First, none of the reviewers was involved in the evaluation of cases for the published articles (8, 10, 15, 16), and second, none of the reviewers was aware that some published cases were randomized along with new cases. Third, for the majority of reported cases, the spin-echo MR images and maximum intensity projection images were not displayed in the published articles; only a few illustrative images were shown. Fourth, each reviewer made the decision regarding whether a dural AVF was present based on his or her perception of the size, number, and tortuosity of the intradural vessels and not on specific criteria for these imaging features. No specific criteria for the diagnosis of dural AVF were developed in the previously published articles (8, 15).
A third shortcoming of the study design is that it cannot yield the true sensitivity, specificity, and accuracy of MR imaging or MR angiography because these are always influenced by the prevalence of the disease in the population studied and only patients with a diagnosis of dural AVF based on DSA were evaluated in this work. This population is different from the true population with dural AVF because some patients who have dural AVF fail to undergo DSA. In the absence of a true ”gold standard“ for the detection of dural AVF, however, DSA is routinely used as the standard against which other imaging methods are tested.
An important aspect of MR screening for dural AVF is the detection of the fistula location in positive cases. Considering the three reviewers together, MR angiography improved the percentage of true positive results for patients for whom the correct level was predicted noninvasively from 15% to 50% and improved the percentage of true positive results for patients for whom the correct level ± one level was predicted from 43% to 73% (Fig 10). Furthermore, the addition of MR angiography to the screening examination reduced the percentage of true positive results with an indeterminate level on screening from approximately 20% to 0%
The primary advantage, therefore, of adding MR angiography to routine MR imaging is the greater frequency in predicting the level of the fistula, based on the display on MR angiograms of the dominant, often tortuous (Figs 1 and 2), medullary vein draining the fistula. This knowledge allows the subsequent catheter DSA study to be initially targeted to one or a few spinal levels, and such targeting plus injection of the remaining segmental arteries along the spinal axis has been performed at our institution for the last 5 years. In one case of dural AVF, such targeting proved valuable because the patient refused to continue with the DSA study after only three segmental arteries (right and left T12 and right L1) had been injected. One of the injected levels (right T12, as predicted by MR angiography) showed the arterial supply to the dural AVF, which was later confirmed by intra-operative radiographic angiography and successful surgical treatment. In general, we have found that the arterial feeders are located within one vertebral level of the MR angiography–detected dural AVF. No patients with two or more dural AVF dispersed along the spinal axis were encountered in this study. The use of screening MR imaging and MR angiography, therefore, has the potential to shorten the spinal DSA examination time, amount of radiation exposure, and amount of iodinated contrast agent used. Although beyond the scope of this study, an analysis of the risks and benefits of a complete DSA examination versus limited DSA targeted to the MR angiography–predicted dural AVF level seems warranted. Such an analysis could address issues of cost containment and therapeutic outcome.
Both the dural AVF and control groups in this study included patients with abnormal cord signal intensity, size, or enhancement. The reviewers were asked to focus on the imaging findings that reportedly reflect the excessive number and size of intradural vessels observed in patients with dural AVF (3–7). These findings include scalloping of the cord contours on sagittal images, intradural serpentine and punctate low signal intensity (flow void) on T2−weighted MR images, and intradural serpentine enhancement on contrast-enhanced T1−weighted MR images. Based on our own MR angiography experience (15) and published radiographic myelography results presented by Gulliver and Noakes (17), a threshold of three vertebral levels was chosen as the spinal length above which serpentine hypointensity and contrast-enhanced serpentine enhancement were likely to be excessive and associated with dural AVF, and this threshold was explicitly specified in questions 1 and 2. As shown in Figures 3 and 4, flow voids and enhancement greater than three vertebral levels in length were each strongly associated with the presence of dural AVF. Flow voids and enhancement less than three levels were strongly associated with the absence of dural AVF. The choice of three vertebral levels as a threshold for suspecting dural AVF is supported by the evidence presented in Figure 7, assuming that the flow voids and/or enhancement on MR images approximately correspond to the largest intradural vessels detected on MR angiograms. As can be seen in Figure 7, the values for mean length of the dominant intradural vessel detected on MR angiograms of patients with dural AVF were ≥4.6 ± 0.38 vertebral levels (reviewer 2 had the lowest value). Alternatively, the values for mean length detected in control patients were ≤2 ± 0.45 levels (reviewer 3 had the highest value). The average of the three values for the dural AVF group was five vertebral levels, and the average for the control group was 1.3 levels. The result for the dural AVF group is less than the value of 6.5 vertebral segments reported by Mascalchi et al (14) who used three different MR angiography techniques, including phase-contrast and fast, time-resolved contrast-enhanced MR angiography, in their study.
Published studies describing the appearance of intradural vessels on MR angiograms, radiographic DSA, or radiographic myelography have emphasized at least four features that may be altered in patients with proven dural AVF: number, tortuosity, length, and size (16). The relationship between each of these features and the presence of dural AVF is presented in Figures 5, 6, 7, and 9. The more experienced neuroradiologists (reviewers 1 and 2) detected similar, statistically significant increases in the tortuosity and length of the dominant intradural vessel in patients with dural AVF compared with control patients (Figs 6 and 7), although reviewer 2 tended to classify the intradural vessels in both groups as relatively larger in size than did reviewer 1 (Fig 9). The increased tortuosity corresponds to the results that Gulliver and Noakes (17) determined by using radiographic myelography. In addition to increased tortuosity of the vessels on the cord surface, primarily the anterior and posterior median veins, the dominant medullary vein draining a fistula has been reported to show increased tortuosity on MR angiograms (8). Although the frequency and significance of this finding was not determined, its detection in one case (Fig 2) caused reviewer 2 to change a response of ”no fistula“ (false negative) based on MR imaging alone to one of ”fistula“ (true positive) based on MR imaging plus MR angiography.
Values for the mean length of the dominant intradural vessel (typically, the anterior or posterior median vein) in patients with dural AVF, reported herein and by Mascalchi et al (14), and in control patients probably underestimate the true values because of the lower spatial resolution of clinical MR angiography techniques compared with in vivo and ex vivo radiographic angiography (18–21). Nevertheless, a significant difference exists between mean lengths for the dural AVF and control groups based on MR angiography (Fig 7). Interestingly, the least experienced neuroradiologist (reviewer 3) reported significantly greater lengths than did the other reviewers for the dominant intradural vessel in both the dural AVF and control groups.
Reviewer 3 differed from reviewers 1 and 2 in other responses, as well. Reviewer 3 reported significantly greater tortuosity for the dominant intradural vessels in both the dural AVF and control groups (Fig 6) and tended to classify the vessels as relatively small in size compared with the reports by reviewers 1 and 2 (Fig 9). Although the responses of reviewer 3 yielded a significantly greater mean tortuosity and size for the dural AVF group compared with the control group, the levels of statistical significance were less than those for reviewers 1 and 2. The difference in perception of the tortuosity and size of the intradural vessels between reviewer 3 and reviewers 1 and 2 may in part explain the higher number of false negatives and lower sensitivity of reviewer 3 in the detection of the presence of dural AVF on MR angiograms (Table 1).
The remaining feature of intradural vessels that may be altered on MR angiograms or radiographic DSA studies of patients with dural AVF is the number of vessels detected. This feature is related to the size of the vessels, most of which are below the spatial resolution of the MR angiography technique. An increase in size due to venous engorgement from a dural AVF will result in more vessels in the coronal venous plexus than the normally seen anterior/posterior median veins being detected on the cord surface (15, 18, 19). Figure 5 shows that the number of vessels detected by the reviewers on MR angiograms was significantly increased for the dural AVF group compared with the control group. Detection of more than two vessels was used as a criterion because, as noted above, a dominant anterior and/or posterior median vein may be detected on the cord surface in normal participants (15). The detection of an increased number of vessels (Fig 5) is thus consistent with the significant increase in size of the intradural vessels for the dural AVF group compared with the control group (Fig 9). A direct relationship between visibility of vessels and mean size cannot be established by this study because vessel size was estimated qualitatively. The largest normal vessels on the cord surface are the anterior and posterior median veins, which typically measure approximately 1 to 2 mm in diameter (17, 20).
Conclusion
The addition of MR angiography to a standard MR imaging protocol does not significantly alter the sensitivity, specificity, or accuracy of detection of spinal dural AVF for a given reviewer (neuroradiologist); however, with the addition of MR angiography, a more experienced reviewer may achieve greater sensitivity of detection than a less experienced reviewer. The principal advantage of MR angiography is the improved detection of the fistula level, with the correct level ± one level identified in 73% of true positive cases. Significant differences in the appearance of intradural vessels in patients with and without dural AVF are evident. These differences are revealed by MR imaging findings, such as excessive length of flow voids and serpentine enhancement, and by MR angiography findings, such as increased tortuosity, length, and size of the dominant intradural vessel on the cord surface and increased number of visible perimedullary vessels. Overall, the combination of MR imaging and MR angiography provides improved screening for dural AVF and benefits the subsequent radiographic DSA study by helping target the level of the fistula.
References
- 1.Symon L, Kuyama H, Kendall B. Dural arteriovenous malformations of the spine: clinical features and surgical results in 55 cases. J Neurosurg 1984;60:238–247 [DOI] [PubMed] [Google Scholar]
- 2.Rosenblum DS, Myers SJ. Dural spinal cord arteriovenous malformation. Arch Phys Med Rehabil 1991;72:233–236 [PubMed] [Google Scholar]
- 3.Masaryk TJ, Ross JS, Modic MT, Ruff RL, Selman WR, Ratcheson RA. Radiculomeningeal vascular malformations of the spine: MR imaging. Radiology 1987;164:845–849 [DOI] [PubMed] [Google Scholar]
- 4.Dormont D, Gelbert F, Assouline E, et al. MR imaging of spinal cord arteriovenous malformations at 0.5 T: study of 34 cases. AJNR Am J Neuroradiol 1988;9:833–838 [PMC free article] [PubMed] [Google Scholar]
- 5.Minami S, Sagoh T, Nishimura K, et al. Spinal arteriovenous malformation: MR imaging. Radiology 1988;169:109– 115 [DOI] [PubMed] [Google Scholar]
- 6.Terwey B, Becker H, Thron AK, et al. Gadolinium-DTPA enhanced MR imaging of spinal dural arteriovenous fistulas. J Comput Assist Tomogr 1989;13:30–37 [DOI] [PubMed] [Google Scholar]
- 7.Gilbertson JR, Miller GM, Goldman MS, Marsh WR. Spinal dural arteriovenous fistulas: MR and myelographic findings. AJNR Am J Neuroradiol 1995;16:2049–2057 [PMC free article] [PubMed] [Google Scholar]
- 8.Bowen BC, Fraser K, Kochan JP, et al. Spinal dural arteriovenous fistulas: evaluation with MR angiography. AJNR Am J Neuroradiol 1995;16:2029–2043 [PMC free article] [PubMed] [Google Scholar]
- 9.Mascalchi M, Bianchi MC, Quilici N, et al. MR angiography of spinal vascular malformations. AJNR Am J Neuroradiol 1995;16:289–297 [PMC free article] [PubMed] [Google Scholar]
- 10.Lee TT, Gromelski EB, Bowen BC, Green BA. Diagnostic and surgical management of spinal dural arteriovenous fistulas. Neurosurgery 1998;43:242–247 [DOI] [PubMed] [Google Scholar]
- 11.Binkert CA, Kollias SS, Valavanis A. Spinal cord vascular disease: characterization with fast three-dimensional contrast-enhanced MR angiography. AJNR Am J Neuroradiol 1999;20:1785–1793 [PMC free article] [PubMed] [Google Scholar]
- 12.Mascalchi M, Cosottini M, Ferrito G, Quilici N, Bartolozzi C, Villari N. Contrast-enhanced time-resolved MR angiography of spinal vascular malformations. J Comput Assist Tomogr 1999;23:341–345 [DOI] [PubMed] [Google Scholar]
- 13.Shigematsu Y, Korogi Y, Yoshizumi K, et al. Three cases of spinal dural AVF: evaluation with first-pass, gadolinium-enhanced, three-dimentional MR angiography. J Magn Reson Imaging 2000;12:949–952 [DOI] [PubMed] [Google Scholar]
- 14.Mascalchi M, Ferrito G, Quilici N, et al. Spinal vascular malformations: MR angiography after treatment. Radiology 2001;219:346–353 [DOI] [PubMed] [Google Scholar]
- 15.Bowen BC, DePrima S, Pattany PM, Marcillo A, Madsen P, Quencer RM. MR angiography of normal intradural vessels of the thoracolumbar spine. AJNR Am J Neuroradiol 1996;17:483–494 [PMC free article] [PubMed] [Google Scholar]
- 16.Bowen BC, Pattany PM. Contrast-enhanced MR angiography of spinal vessels. Magn Reson Imaging Clin N Am 2000;8:597–614 [PubMed] [Google Scholar]
- 17.Gulliver D, Noakes J. Myelographic differentiation of spinal cord arteriovenous malformations from the normal population. Australas Radiol 1988;32:57–64 [DOI] [PubMed] [Google Scholar]
- 18.Gillilan LA. Veins of the spinal cord: anatomic details: suggested clinical applications. Neurology 1970;20:860–868 [DOI] [PubMed] [Google Scholar]
- 19.Moes P, Maillot C. Superficial veins of the human spinal cord: an attempt at classification [in French]. Arch Anat Histol Embryol 1981;64:5–110 [PubMed] [Google Scholar]
- 20.Thron AK. Vascular Anatomy of the Spinal Cord: Neuroradiological Investigations and Clinical Syndromes. New York: Springer-Verlag;1988
- 21.Lasjaunias P, Berenstein A. Functional vascular anatomy of the brain, spinal cord and spine. In: Lasjaunias P, Berenstein P, eds. New York:Springer-Verlag; Surgical Neuroangiography. 1990; Vol 3:15


