

Abstract
Summary: Serial MR imaging and quantitative proton MR spectroscopic imaging (MRSI) findings of a 4-year-old boy with acute disseminated encephalomyelitis (ADEM) are reported. Over a 2-month period characterized by an initial illness and two relapses, each with full recovery, MR imaging exhibited the appearance and disappearance of multifocal lesions throughout the CNS that correlated only partly with the neurologic impairment. During one relapse, MRSI revealed low levels of N-acetylaspartate (NAA) within the regions of prolonged T2 signal intensity. All other metabolites were normal. At follow-up, the MR imaging and MRSI abnormalities had fully resolved. MRSI might play an important role in the diagnosis of ADEM, as well as in the elucidation of underlying pathophysiologic processes in this poorly defined disorder of children. This case demonstrates that reduced levels of NAA are not always associated with neuronal loss, irreversible tissue damage, or poor neurologic outcome.
Acute disseminated encephalomyelitis (ADEM) is an immune-mediated disorder that produces multifocal abnormalities within the CNS (1) and is often associated with a preceding systemic infection or immunization. MR imaging typically shows asymmetrical bilateral T2 hyperintense lesions in white matter and deep gray matter, with occasional brain stem and spinal cord involvement. These lesions usually completely subside within a few weeks, or eventually organize into glial scars. Diagnosis generally is made on the basis of clinical semiology, CSF analysis, neuroimaging studies, and the absence of other definable etiologies. In some cases, the distinction of ADEM from multiple sclerosis (MS), leukodystrophy, or mitochondrial encephalomyopathy might be difficult. Prognosis is generally good, but differences in the ascertaining of cases have undermined prognostic studies as well as pathophysiologic inquiries. Early diagnosis might have implications for treatment, particularly in distinguishing ADEM from MS (2). Serial proton MR spectroscopic imaging (MRSI) of a boy with ADEM suggests that MRSI might have a clinical and investigative function in the evaluation of ADEM. Moreover, this case demonstrates an important caveat limiting the predictive value of low levels of N-acetylaspartate (NAA).
Case Report
A 4-year-old Caucasian boy had progressively worsening intermittent headache and vomiting beginning 1 week after initiation of oral antibiotics for presumed otitis media. Findings from the neurologic examination were normal, as were results from a noncontrast CT scan. CSF examination demonstrated mononuclear pleocytosis (Table 1), and the erythrocyte sedimentation rate was 50 mm/h with a peripheral white blood cell count of 21,000/mL. Viral meningitis was diagnosed. The patient's headache worsened and his vomiting persisted. After 1 week, dense left-sided hemiparesis and homonymous hemianopsia developed. An MR imaging scan showed isolated prolongation of T2 signal intensity bilaterally in the pulvinar, more prominent on the left side (Fig 1A). A second CSF sample showed increasing white blood cell and protein levels (Table 1). Polymerase chain reaction analysis of the CSF was positive for herpesvirus, and he was given a 2-week course of intravenous acyclovir, although the clinical appearance and course were highly atypical of Herpes encephalitis. No abnormal growth was detected in extensive bacterial and viral cultures of blood, urine, and stool; titers for Lyme disease and mycoplasmal pneumonia were normal and remained unchanged later during follow-up. One day after the onset of hemiparesis and hemianopsia both resolved without therapy.
TABLE 1:
CSF white and red blood cell counts and protein and glucose levels
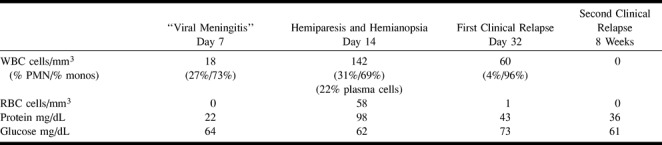
fig 1.

A–C. T2-weighted MR images at 3000/100/1 (TR/TE/excitation) at the following times after initial symptom (headache) onset. A, At 14 days, bilateral thalamic lesions (left slightly more prominent than right). B, At 21 days, thalamic lesions have increased in size and new lesion has appeared in left cerebral peduncle (lesions in left globus pallidus and forceps major not shown). C, At 32 days, further progression of thalamic lesions to involve right geniculate body, right posterior limb of internal capsule, and complete involvement of left putamen and globus pallidus tracking down to left cerebral peduncle (bilateral lesions in hemispheric white matter and left frontoparietal cortex not shown)
One week later (3 weeks after the onset of headache), follow-up MR imaging, in the absence of new symptoms or signs, showed an increase in size of the bilateral posterior thalamic lesions, as well as a new area of prolonged T2 signal in the left cerebral peduncle, globus pallidus, and left forceps major (Fig 1B). On day 32, the patient was abruptly obtunded with lethargy, spastic paraparesis, diplopia, and right facial weakness. MR imaging showed further progression of the thalamic lesions to involve the right geniculate body, right posterior limb of the internal capsule, and complete involvement of the left putamen and globus pallidus tracking down to the left cerebral peduncle (Fig 1C). T2 prolongation also could be demonstrated bilaterally in hemispheric white matter, and in the left frontoparietal cortex. These signs and symptoms also resolved quickly (in 4 days) without the use of corticosteroids or other attempts at specific therapy.
Three weeks later (8 weeks after the first headache), the patient had a second relapse with a similar distribution of impairments involving left hemiparesis and right facial weakness. Findings from a CSF examination were normal (Table 1), however, and the neurologic signs again resolved fully in 3 days without specific therapy. In contrast to the similar distribution of neurologic deficits, the MR imaging scan showed striking changes in the distribution of signal abnormalities. Prolongation of T2 signal was detected in the left caudatum, putamen, and globus pallidus, and in the right globus pallidus, anterior thalamus, posterior limb of the internal capsule, and cerebral peduncle (Fig 1D). T2 hyperintensity also was seen in the subcortical white matter of the right temporal lobe. The first of two quantitative multisection MRSI studies (four sections, 15 mm thick, at 2300/280 [TR/TE]) was performed (see below) (3, 4).
fig 1.

D–F. D, At 8 weeks, pattern of involvement dramatically changed, with resolution of lesions in thalami and left cerebral peduncle, and with new lesions in left caudatum, putamen, and globus pallidus, and in right globus pallidus, anterior thalamus, cerebral peduncle, and posterior limb of internal capsule. (Hyperintensity of subcortical white matter of right temporal lobe not shown.) E, At 17 weeks, nearly all lesions resolved, with only minimal hyperintensity of left caudate nucleus and frontal periventricular white matter (not shown). F, At 25 weeks, all T2 hyperintense lesions completely resolved
Four months after the onset of symptoms, no motor abnormalities could be detected, although there was concern about mild hyperactivity and difficulty with sustained attention. An MR imaging scan depicted the complete resolution of signal abnormalities in thalami, basal ganglia, and cerebral peduncle; minimal T2 prolongation persisted only within the left caudate nucleus and the left frontal periventricular white matter (Fig 1E). At final follow-up, 6 months after the onset of symptoms, findings from a neurologic examination were normal, as were those from MR imaging (Fig 1F). The second MRSI scan was also obtained. No contrast enhancement was seen on any scan throughout the course of the illness.
Examination of the multisection MRSI study performed at 8 weeks showed marked decrease of NAA in the left caudatum, left lenticular nucleus, and right midbrain (Fig 2A, Table 2). There also was a moderate decrease of NAA in the posterior limb of the right internal capsule and right mesial temporal lobe. All these anatomic regions were associated with a hyperintense signal on T2-weighted MR images (Figure 1D). Choline and creatine were within normal values in these regions and throughout the brain. Levels of NAA were normal in all regions of the brain having a normal T2-weighted MR imaging appearance.
fig 2.

Proton MRSI at 8 (top) and 25 (bottom) weeks after initial symptom onset. Localizer T1-weighted MR images at 300/13/1 (TR/TE/excitation) and metabolic images at 2300/280/1 (TR/TE/excitation) of choline and NAA from the second of four sections shown. Selected spectrum from left caudatum shown at both time points (voxel location indicated on T1-weighted images). At 8 weeks, NAA image shows decreased levels in left caudatum, lenticular nuclei, and right internal capsule, corresponding to lesions seen in T2-weighted MR images (fig 1D). Choline signals within normal limits; note high choline signal in thalamic region is normal for these regions (Table 2). By 25 weeks, NAA recovered to normal levels in all these regions, whereas creatine and choline levels remain stable (Table 2)
TABLE 2:
Metabolite concentrations (mM) in selected brain structures at 8 and 25 weeks after first onset of symptoms, and ratios of metabolite levels at 25 and 8 weeks (% increase or decrease)
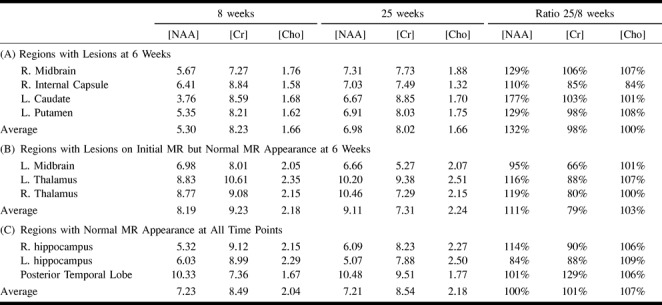
A second MRSI study performed 4 months later showed recovery of the NAA deficit in the left caudatum, left lenticular nucleus, and right midbrain (Fig 2). Choline and creatine levels were normal and unchanged from the previous scan. The left caudate nucleus and striatum (regions that had the largest lesion and the greatest NAA deficit at the time of the first MRSI study) showed a 77% increase in NAA concentration in the follow-up study (Table 2). The concentrations of NAA in the right midbrain and the right internal capsule increased approximately 30% and 10%, respectively (Table 2). A mild increase in NAA (16%–19%) was measured in the thalami; the T2 signal abnormality in these regions had already disappeared at the time of the first MRSI study, presumably implying that some NAA recovery had already occurred in these areas.
No lactate was detected in either the first or second MRSI scans in any brain region or CSF, and no significant differences in creatine and choline were detected between lesions and normal-appearing brain tissue. Creatine and choline levels were stable between 8- and 25-week MRSI scans; the average variation between the two scans was 7%, except for a 21% decrease in creatine in the thalami and left midbrain regions, which had lesions shown on earlier MR imaging scans but had normal appearance at 8 weeks (Table 2).
Discussion
Diagnosis of ADEM is made largely on the basis of clinical semiology, with an absence of well-established criteria. Our case suggests that MRSI might have a role in the differential diagnosis of ADEM, and that early abnormalities in MRSI might aid in the understanding of the underlying pathogenesis of ADEM. This case also demonstrates a broader and more basic point, limiting the predictive value of diminished levels of NAA in this or other disorders.
Our patient's proton MRSI contrasts sharply with those seen with the demyelinating diseases that figure prominently in the differential diagnosis of ADEM. During the acute phase of demyelination of MS and various leukodystrophies, choline levels are usually elevated (5, 6). The increased “choline” signal is believed to result from increased levels of the myelin breakdown products glycerophosphocholine and phosphocholine. In our case, and in another case of ADEM studied with single-voxel MRSI (7), the choline signal was normal, and the tissue associated with hyperintense T2-weighted MR imaging signal subsequently fully recovered. Findings from other tests suggestive of MS (oligoclonal bands) were also negative in this patient. Abnormal hyperintense T2-weighted MR imaging signal with normal levels of choline might indicate that the underlying pathologic process is related more to local edema than to demyelination. In this setting, a normal choline level might have prognostic implications for recovery, a hypothesis that is potentially of great value but that will require testing in a larger cohort of patients.
Another important disorder in the differential diagnosis of ADEM is mitochondrial encephalomyopathy. It has been reported that those with many mitochondrial diseases (8) have elevated cerebral and CSF lactate levels shown on proton spectra. Our not observing lactate in the lesions, normal-appearing brain tissue, or CSF in our patient was helpful in making the diagnosis of mitochondrial encephalopathy less likely, and subsequently all mitochondrial DNA tests and blood and CSF lactate/pyruvate measures in this patient gave negative results. Elevated lactate levels have been reported in mitochondrial encephalopathies such as MELAS MERFF, Kearns-Sayre syndrome, and Leigh disease (8). However, the sensitivity and specificity of the spectroscopic detection of lactate as a diagnostic test for these and other mitochondrial diseases remains to be determined. Small elevations of lactate have also been reported in fulminant demyelinating lesions (6) but were not observed in our case.
NAA is believed to be located predominantly in neurons and axons in the CNS (9), although there also have been suggestions that oligodendrocytes (10) and mast cells (11) might contain some NAA. Because NAA levels are consistently decreased in lesions known to involve neuronal/axonal loss (12) (eg, infarcts, brain tumors, seizure foci, MS plaques), it has been suggested that the NAA signal may be used as a marker of permanent neuronal/axonal loss (12). However, it is now becoming apparent that, as for other amino acids, NAA levels depend on not only neuronal density but also fluxes of synthetic and degradation pathways. NAA is primarily synthesized from aspartate and acetyl coenzyme A in neuronal mitochondria (13), with a secondary synthetic pathway from N-acetyl aspartyl glutamate. Degradation pathways proceed to acetate and aspartate via the enzyme aspartoacylase. Deficiency of aspartoacylase leads to excessive elevation of brain NAA levels in patients with Canavan disease (14). Conversely, a recent report of a 2-year-old child with mental retardation and normal brain MR imaging findings describes a complete absence of cerebral NAA (15), presumably resulting from a defect in the synthetic pathway of NAA. Therefore, in the absence of a clear understanding of biochemical etiology, decreased levels of NAA should not automatically be interpreted as resulting from neuronal-axonal loss or viability.
Although NAA recovery has been reported previously (5, 16, 17), our report is the first to use quantitation methodology (as opposed to ratios) to confirm that signal changes result from increased NAA levels, as opposed to decreased creatinine or choline levels (eg, NAA/creatine and NAA/choline are commonly used as ratios). The use of high resolution, multisection MRSI with careful section positioning also minimizes possible partial volume errors in serial NAA measurements. Reversible NAA decreases have been demonstrated in four patients with single transient acute demyelinating MS lesions and in two patients with mitochondrial encephalopathy (16). In patients with a single large demyelinating lesion, De Stefano et al (16) found a 34%–45% NAA deficit during the acute phase of the disease, followed by almost complete NAA recovery (70%–80% of the normal contralateral NAA levels). Recovery of NAA in patients with HIV encephalitis treated with antiretroviral drugs (18), in a child with HIV encephalitis, in the contralateral hemisphere of patients with epilepsy, and in mesial temporal sclerosis after temporal lobectomy (18) also has been reported. All of these reports indicate that the reduction of NAA in these diseases (and presumably in our case also) represents some degree of neuronal-axonal dysfunction, as opposed to irreversible neuronal-axonal loss. Although reports of transient NAA deficits continue to be relatively scarce, this might be as much the result of the small number of follow-up proton spectroscopy studies in patients with acute brain injury, as that of the rarity of the phenomenon itself.
In summary, we report a case of ADEM with multiple transient brain lesions on MR imaging, which showed low levels of NAA on initial MRSI. At final follow-up, neurologic examination and brain MR imaging findings and NAA levels had all recovered to normal. Unlike in other demyelinating diseases such as MS or leukodystrophy, choline levels were normal. Proton MRSI might, therefore, be helpful in establishing an early diagnosis of ADEM at the onset of neurologic symptoms.
Acknowledgments
This work was done during the tenure of an established investigatorship from the American Heart Association (P.B.B.).
Footnotes
Address reprint requests to Peter B. Barker, Department of Radiology, MR imaging 143C, Johns Hopkins University School of Medicine, 600 N Wolfe Street, Baltimore, MD 21287.
References
- 1.Nasr JT, Andriola MR, Coyle PK. ADEM: literature review and case report of acute psychosis presentation. Pediatr Neurol 2000;22:8-18 [DOI] [PubMed] [Google Scholar]
- 2.Kesselring J, Miller DH, Robb SA. et al. Acute disseminated encephalomyelitis: MRI findings and the distinction from multiple sclerosis. Brain 1990;113:291-302 [DOI] [PubMed] [Google Scholar]
- 3.Duyn J, Gillen J, Sobering G, van Zijl P, Moonen C. Multislic proton MR spectroscopic imaging of the brain. Radiology 1993;188:277-282 [DOI] [PubMed] [Google Scholar]
- 4.Soher BJ, van Zijl PCM, Duyn JH, Barker PB. Quantitative proton spectroscopic imaging of the human brain. Magn. Reson. Med 1996;35:356-363 [DOI] [PubMed] [Google Scholar]
- 5.Davie CA, Hawkins CP, Barker GJ. et al. Serial proton magnetic resonance spectroscopy in acute multiple sclerosis lesions. Brain 1994;117:49-58 [DOI] [PubMed] [Google Scholar]
- 6.Kruse B, Barker PB, van Zijl PCM, Duyn JH, Moonen CTW, Moser HW. Multislice proton MR spectroscopic imaging in x-linked adrenoleukodystrophy. Ann Neurol 1994;36:595-608 [DOI] [PubMed] [Google Scholar]
- 7.Harada M, Hisaoka S, Mori K, Yoneda K, Noda S, Nishitani H. Differences in water diffusion and lactate production in two different types of postinfectious encephalopathy. J Magn Reson Imaging 2000;11:559-563 [DOI] [PubMed] [Google Scholar]
- 8.Barkovich AJ, Good WV, Koch TK, Berg BO. Mitochondrial disorders: analysis of their clinical and imaging characteristics. AJNR Am J Neuroradiol 1993;14:1119-1137 [PMC free article] [PubMed] [Google Scholar]
- 9.Birken DL, Oldendorf WH. N-acetyl-L-aspartic acid: a literature review of a compound prominent in H-NMR spectroscopic studies of brain. Neurosci Biobehav Rev 1989;13:23-31 [DOI] [PubMed] [Google Scholar]
- 10.Bhakoo KK, Pearce D. In vitro expression of N-acetyl aspartate by oligodendrocytes: implications for proton magnetic resonance spectroscopy signal in vivo. J Neurochem 2000;74:254-262 [DOI] [PubMed] [Google Scholar]
- 11.Burlina AP, Ferrari V, Facci L, Skaper SD, Burlina AB. Mast cells contain large quantities of secretagogue sensitive N-acetylaspartate. J Neurochem 1997;69:1314-1317 [DOI] [PubMed] [Google Scholar]
- 12.Guimaraes AR, Schwartz P, Prakash MR. et al. Quantitative in vivo 1H NMR spectroscopic imaging of neuronal loss in rat brain. Neuroscience 1995;69:1095-1101 [DOI] [PubMed] [Google Scholar]
- 13.Bates TE, Strangward M, Keelan J, Davey GP, Munro PM, Clark JB. Inhibition of N-acetylaspartate production: implications for 1H MRS studies in vivo. Neuroreport 1996;7:1397-1400 [PubMed] [Google Scholar]
- 14.Barker PB, Bryan RN, Kumar AJ, Naidu S. Proton NMR spectroscopy of Canavan's disease. Neuropediatrics 1992;23:263-267 [DOI] [PubMed] [Google Scholar]
- 15.Thiel T, Capone A, Schneider JF, Hennig J, Martin E. N-acetyl-aspartate: a market for viable neurons? [abstract]. In: Book of International Society for Magnetic Resonance in Medicine's (ISMRM's) 8th Scientific Meeting and Exhibition. Denver, CO: ISMRM: 2000; 1909
- 16.De Stefano N, Matthews PM, Arnold DL. Reversible decreases in N-acetylaspartate after acute brain injury. Magn Reson Med 1995;34:721-727 [DOI] [PubMed] [Google Scholar]
- 17.Hugg JW, Kuzniecky RI, Gilliam FG, Morawetz RB, Faught RE, Hetherington HP. Normalization of contralateral metabolic function following temporal lobectomy demonstrated by H-1 magnetic resonance spectroscopic imaging. Ann Neuro 1996;40:236-239 [DOI] [PubMed] [Google Scholar]
- 18.Vion-Dury J, Nicoli F, Salvan AM, Confort-Gouny S, Dhiver C, Cozzone PJ. Reversal of brain metabolic alterations with zidovudine detected by proton localised magnetic resonance spectroscopy [letter]. Lancet 1995;345:60-61 [DOI] [PubMed] [Google Scholar]
- 19.Takanashi J, Sugita K, Ishii M, Aoyagi M, Niimi H. Longitudinal MR imaging and proton MR spectroscopy in herpes simplex encephalitis. J Neurol Sci 1997;149:99-102 [DOI] [PubMed] [Google Scholar]
- 20.Barker PB, Szopinski K, Horska A. Metabolic heterogeneity at the level of the anterior and posterior commissures. Magn Reson Med 2000;43:348-354 [DOI] [PubMed] [Google Scholar]