

Abstract
BACKGROUND AND PURPOSE: Abnormal apparent diffusion coefficient (ADC) values in injured spinal cord white matter and fibroblast transplants have been shown to correspond with qualitative histologic findings of axonal loss or regeneration. We proposed that ADC values would correlate with quantitative axonal tracing in the transected rubrospinal tract (RST).
METHODS: Eleven rats received right-sided lateral funiculus lesions at C3–4 (disrupting the RST) and transplantation of fibroblasts that were unmodified or modified to secrete brain-derived neurotrophic factor (BDNF). Behavioral tests measured hindlimb function at 1, 2, 4, 6, 8, 10, and 12 weeks after injury. At 12 weeks after injury, the antegrade axon tracer biotinylated dextran amine was stereotactically injected into the red nucleus to label the injured RST axons. Animals were sacrificed 2 weeks later. Diffusion-weighted MR imaging of the excised, fixed spinal cord specimens was then performed at 9.4 T.
RESULTS: In white matter surrounding transplants, ADC values transverse to axons were elevated and ADC values longitudinal to axons were decreased. These ADC values were more abnormal closer to the transplant, and this correlated with decreases in numbers of labeled RST axons. ADC values in BDNF-expressing fibroblast transplants were significantly lower than those in unmodified fibroblast transplants, and these lower values correlated with decreased axonal dieback. Behaviorally, all animals showed partial recovery, but animals with BDNF-expressing fibroblast transplants had slightly improved hindlimb function compared to those with unmodified fibroblast transplants.
CONCLUSION: ADC values may be able to evaluate graft function after spinal cord injury by demonstrating the degree of axonal dieback and preservation.
Treatments for spinal cord injuries are particularly challenging because of the limited ability of central nervous system axons to regenerate. In addition, the severed ends of axons retract, or dieback, from the site of injury, potentially limiting the efficacy of local treatment administration intended to induce axonal regrowth. Based on experience with animal models, however, clinical trials for spinal cord injury are under way, many of which use the therapeutic strategy of cell transplantation (1). Recovery of function in humans is variable, however, and unlike in animal models, may take years to manifest (2). Owing to long recovery times and the lack of histologic data in the clinical setting, it is important to develop a noninvasive imaging technique for evaluating transplant function, including axonal regeneration and the sparing of axons from degeneration and dieback.
Studies of fixed specimens after experimental spinal cord injury have indeed shown that diffusion-weighted (DW) MR imaging can depict disruption and injury to white matter tracts in areas that appear normal with conventional MR imaging techniques (3). These alterations in water diffusion appear to be functionally important, with closer-to-normal apparent diffusion coefficient (ADC) values indicating a better behavioral outcome (4, 5). Although this behavioral correlation is important, the histologic correlation has been only qualitative. To determine the histologic changes underlying ADC alterations, we quantitatively assessed the effect of treatment on spinal cord injury and correlated these findings with ADC values. We placed grafts of fibroblasts, either unmodified or modified to secrete brain-derived neurotrophic factor (BDNF), within a surgical lesion of the spinal cord white matter that disrupted the rubrospinal tract (RST). Modified fibroblast grafts result in neuroprotection and axonal regrowth within the RST, as well as improved behavioral function, compared with unmodified fibroblast grafts (6–10). By subsequently tracing and counting the axons in the RST, we intended to evaluate axon dieback and its relation to ADC values in white matter and transplants. We hypothesized that closer-to-normal ADC values in white matter would correlate with increased numbers of labeled RST axons.
Methods
Subjects
A total of 14 female Sprague-Dawley rats (250–300 g; Taconic, Germantown, NY) were divided into three groups. One group (n = 5) received a dorsal lateral funiculus (DLF) lesion on the right side of the spinal cord and a transplant of fibroblasts that had been genetically modified to secrete BDNF. A control group (n = 6) received the same surgery and a transplant of unmodified fibroblasts, which did not secrete BDNF. All surgical animals received preoperative behavioral testing for 2 weeks and postoperative assessment for 12 weeks. At 12 weeks, animals received stereotactic injections of the antegrade axon tracer biotinylated dextran amine (BDA) into the left red nucleus to label the right RST in the spinal cord. Animals were sacrificed 2 weeks after stereotactic injection. Normal control animals (n = 3) received the same behavior testing before stereotactic injections and sacrifice. After ex vivo MR imaging evaluation of the spinal cord, the spinal cords of all animals were analyzed histologically.
All protocols followed National Institutes of Health guidelines and were approved by the Institutional Animal Care and Use Committee at both Drexel University College of Medicine and the University of Pennsylvania School of Medicine.
Transplant Preparation
The isolation and culturing of primary unmodified fibroblasts and BDNF-expressing fibroblasts have been previously described in detail (8, 11). Briefly, the cells were grown on 100-mm uncoated tissue culture dishes (Becton Dickinson Labware, Franklin Lakes, NJ) and split weekly at a 1:10 ratio into fresh medium. On the day of surgery, confluent cultures of cells were washed, trypsinized, gently triturated, counted, washed, pelleted (900 rpm for 5 minutes), and resuspended in growth medium at a concentration of 10 5 cells/μL. The cells were maintained on ice during surgery.
Surgical Procedures
Rats were anesthetized with an intraperitoneal injection of acepromazine maleate (0.7 mg/kg; Fermenta Animal Health Co., Kansas City, MO), ketamine (95 mg/kg; Fort Dodge Animal Health, Fort Dodge, IA), and xylazine (10 mg/kg; Bayer Co., Shawnee Mission, KS). A laminectomy was performed at the C3–4 level to expose one spinal cord segment. After hemostasis was achieved, the spinal cord midline and the dorsal root entry zone were identified. The dura and pia mater were opened with a microscalpel, and a fine-tipped glass-pulled microaspiration device was used to create a lesion cavity in the right dorsal lateral spinal cord. This lesion disrupted the dorsal lateral funiculus (DLF), which contains the RST and dorsal spinocerebellar tract (Fig 1) (12, 13), and included small amounts of ipsilateral gray matter and ventral white matter. The craniocaudal extent of the lesion cavity was approximately 2–3 mm. A piece of gelatin sponge (Gelfoam; Upjohn, Kalamazoo, MI) soaked with BDNF-expressing fibroblasts or unmodified fibroblasts was implanted into the cavity, and then another 10 μL of cells suspended in growth medium were slowly injected onto the gelatin sponge with a 10-μL Hamilton syringe. The surgeon was unaware of the transplant type at the time of surgery. Each transplant consisted of approximately 10 6 fibroblasts in gelatin sponge. The dura was closed with 9–0 silk suture, and the muscle and skin were subsequently closed in layers. All rats received a bolus intravenous injection of methylprednisolone (30 mg/kg; Pharmacia and Upjohn Company, Kalamazoo, MI) through the tail vein immediately after surgery. After the surgery, animals were kept on heating pads, closely observed until awake, and then returned to their home cages.
Fig 1.

Schematic of rat cervical spinal cord. The labeled tracts in the white matter are RST (1), dorsal corticospinal tract (2), fasciculus gracilis (3), fasciculus cuneatus (4), reticulospinal tract (5), vestibulospinal tract (6), spinothalamic tract (7), dorsal spinocerebellar tract (8). GM indicates gray matter.
Pre- and Postoperative Immunosuppression
All animals received subcutaneous cyclosporine (Sandoz Pharmaceuticals, East Hanover, NJ) at a dose of 1 mg/100 g body weight to prevent rejection of the graft. Daily cyclosporine injections started 3–5 days before the transplantation procedures and continued for 2 weeks after surgery. After 2 weeks, cyclosporine was administered orally by the drinking water solution (50 μg/mL) and continued throughout the survival period.
Behavioral Procedures
Two trained observers scored all tests, with interreliability greater than 95%. All tests were conducted and scored by observers who were unaware of the treatment. Performance was videotaped where appropriate for later scoring.
Hindlimb function was assessed in an open field (5 × 2 feet) by using a modification of the Basso Beattie Bresnahan (BBB) locomotor rating scale, a widely used measure of the loss and recovery of hindlimb locomotor function after spinal cord injury (8, 14). Because these rats had received unilateral (right-sided) lesions, only the BBB score of the affected side (right) is reported. Rats were observed for 2 minutes by two trained observers and scored from 0 to 21 according to the rating scale. Baseline measurements were obtained, and then animals were assessed at 1, 2, 4, 6, 8, 10, and 12 weeks.
Antegrade Tracing of RST Axons
At 12 weeks, animals were anesthetized (see Surgical Procedures section) and placed in a sterotaxic apparatus. Labeling of the right RST axons was achieved by injecting 0.5 μL of 10% BDA (Molecular Probes, Eugene, OR) into the left red nucleus. The following coordinates were used to drill a burrhole and localize the red nucleus, by using Bregma as the zero point: anteroposterior 5.9 mm, mediolateral 0.7 mm, and dorsoventral (from dural surface) 7.0 mm. Animals were sacrificed 2 weeks later to allow sufficient time for axonal transport of BDA.
Tissue Preparation
All animals were euthanized with an intraperitoneal injection of sodium pentobarbital (100 mg/kg; Abbott Laboratories, North Chicago, IL) and perfused through the heart with 200 mL normal saline followed by 500 mL of ice-cold 2.5% glutaraldehyde/4% paraformaldehyde in 0.1 mol/L phosphate buffer, pH 7.4. The spinal cord was dissected out (Fig 2) and postfixed for 2 weeks in cold 2.5% glutaraldehyde/4% paraformaldehyde in 0.1 mol/L phosphate buffer, pH 7.4, after which DW imaging was performed.
Fig 2.

Picture of cervical spinal cord after partial right-sided hemisection and transplantation with unmodified fibroblasts (arrow, transplant outlined in red).
DW Imaging Technique
Spinal cord specimens were placed in a 5-mm coil (Bruker Medical, Ettlingen, Germany) and immersed in 0.1 mol/L phosphate buffer. Coils were then placed in a 9.4-T magnet (Bruker Medical). A standard spin-echo diffusion sequence (15) was then applied with five separate b-values in the section select (longitudinal) and read (transverse) axes. The following parameters were used: 20 sections, 0.5-mm section thickness, total coverage of 10 mm, 5-mm FOV, 128 × 128 matrix, 39-μm pixel size, 2000/23/ 4 (TR/TE/excitations), transverse b values of 0, 115, 463, 1042, and 1854 s/mm 2 and longitudinal b values of 0, 140, 516, 1124, and 1963 s/mm 2.
Transverse ADC (tADC) and longitudinal ADC (lADC) maps were created by using custom-designed software on Integrated Data Language (IDL, Research Systems, Inc., Boulder, CO) and were based on the following monoexponential equation:
 |
where S = signal intensity from a DW image, So = signal intensity without diffusion sensitizing gradients (b = 0), and D = measured diffusion coefficient.
By using the b = 0 (T2-weighted) image as a guide, a region of interest (ROI) was drawn on the ADC maps within the right DLF rostral and caudal to the transplant (Fig 3). Similar ROIs were drawn in the right DLF for the normal controls. The DLF contains the RST, and our ROIs were based on prior axon tracing studies in the RST (8). The animal’s transplant type was unknown when ROIs were drawn.
Fig 3.

Spinal cord images obtained 2 mm rostral to a right-sided partial hemisection and transplant of unmodified fibroblasts.
A, T2-weighted (b = 0) MR image used as a guide to draw an ROI in the right DLF. An ROI in the surrounding buffer was also created to account for slight differences in temperatures.
B and C, Corresponding tADC (B) and lADC (C) maps show atrophy in the right DLF (arrow) compared with the contralateral side (arrowhead). Spinal cord injury is expected to increase transverse water diffusion and decrease longitudinal water diffusion in injured white matter; these findings are reflected by a subtle increase in signal intensity in the right DLF on the tADC map (B) and a decrease in signal intensity in the right DLF on the lADC map (C) compared with the signal intensity of the undamaged left DLF.
Our ROIs in the DLF were intentionally made large to ensure that the entire RST was included. This resulted in a small, but variable, inclusion of surrounding buffer. To remove these pixels, we used a custom program in IDL that eliminated pixels with ADC values within 2 standard deviations of the mean ADC of buffer. In addition, all pixels with ADC values less than zero were excluded as noise. Other researchers have used a similar technique to remove pixels that were considered surrounding buffer (5).
The tADC and lADC measurements, by using the same methods of calculation, were also made within the center of the transplant tissue (Fig 4). The measurements were either taken from the center section if an odd number of sections constituted the graft, or averaged from the center two sections if an even number of sections constituted the graft. With use of these section numbers as a guide, ROIs were also drawn in the left DLF and bilateral dorsal corticospinal tracts at the level of the graft. The borders of the corticospinal tracts were based on published diagrams of rat spinal cytoarchitecture (12, 13) (Fig 1).
Fig 4.

Spinal cord images obtained at the level of right-sided partial hemisection and transplant of BDNF-expressing fibroblasts.
A, T2-weighted (b = 0) image used as a guide to draw ROIs in the transplant (TP), bilateral corticospinal tracts (CST), and left DLF.
B and C, Corresponding tADC (B) and lADC (C) maps. Analysis of the transplant showed diffusion to be close to isotropic.
To compensate for slight temperature differences, which may be expected to affect ADC values, we obtained an additional ROI in the surrounding buffer for each section. To normalize all measurements to 20°C, the ADC values of the DLF and corticospinal tracts for each section were then multiplied by the ratio of known ADC of water at 20°C (16) to ADC of buffer.
Anisotropy was evaluated with the anisotropy index (tADC/lADC ratio). Lower values indicate increased anisotropic water diffusion, preferentially in the longitudinal direction, which is expected in normal spinal cord white matter.
Functional status after spinal cord injury has been shown to correlate with the degree of spared spinal cord tissue (17–19). To show that improved function in one group was not due to a smaller surgical lesion, it was necessary to determine if lesion size was equivalent between the operative groups. We measured lesion extent by calculating the remaining right-sided gray and white matter area adjacent to the graft at the midpoint of the lesion, where tissue loss was the greatest. Using the b = 0 (T2-weighted) image as a reference, we drew ROIs that outlined the remaining gray and white matter (Fig 5) (OSIRIS medical imaging software, Geneva, Switzerland), and the area was calculated by multiplying the pixels in the ROIs by a known single-pixel area: single-pixel area = FOV (5 × 5 mm)/ matrix (128 × 128).
Fig 5.

MR image and corresponding histologic image of spinal cord at level of right-sided partial hemisection and unmodified fibroblast transplant.
A, T2-weighted (b = 0) image with remaining right-sided white matter (WM) and remaining gray matter (GM) outlined. TP indicates transplant.
B, Photomicrograph of corresponding histologic section (toluidine blue stain, original magnification ×16, bar = 1.0 mm), also with white matter (WM) and gray matter (GM) outlined, demonstrates close correspondence to MR image in A. TP indicates transplant
Histologic Analysis: Axon Tracing and Counting
A slit was placed in the ventral left aspect of the spinal cord specimen as a reference before sectioning. Vibratome sections of spinal cords from animals injected with BDA were cut sequentially with four 50-μm sections followed by a 300-μm section, and this pattern was repeated along the length of the cervical spinal cord, starting caudally. This repeating pattern every 500 μm corresponded to the section thickness used with our DW imaging. The 50-μm sections were placed in test tubes containing tris buffer (pH 10). The sections soaked in the tris buffer for a minimum of 2 days to wash out excess glutaraldehyde. The tissue was then put through two 15-minute washes of 0.5% Triton-X Tris Buffered Saline (TxTBS) (pH 10) and a 30-minute wash of 1% sodium borohydride to further reduce residual fixative. This was followed by two 15-minutes washes in TxTBS. The tissue was then incubated in the working solution of the Elite ABC Kit (Vector Laboratories, Burlingame, CA) overnight in test tubes. The reaction was stopped the next day by four 15-minute washes of TxTBS. The tissue was then rinsed in 50 mmol/L tris, pH 10, followed by a 50 mmol/L tris rinse of pH 7.2. DAB in tris buffer was then applied to the sections for 30 minutes to visualize the BDA staining. The sections were then rinsed with dH2O, mounted on slides, dehydrated, and coverslipped.
The stereology program Stereo Investigator (Micro Bright Field, Colchester, VT, www.microbrightfield.com) was used for axon counts. Only axons in the right DLF white matter were counted; this ROI was drawn out in Stereo Investigator before counting to ensure only these axons were counted.
Of the 14 animals stereotactically injected with BDA, 11 had successful labeling of RST axons in the spinal cord: five animals in the BDNF-expressing fibroblast group, five animals in the unmodified fibroblasts group, and one normal control animal. Beginning with the labeled axon count obtained 4 mm rostral to the transplant as a reference (an equivalent site was used for the normal control), the percentage loss of axons was calculated from measurements obtained every 500 μm approaching the transplant. This method was used because of variability in BDA labeling efficiency (mean = 65 labeled axons, standard error = 16).
The 300-μm sections that were stored in 0.1 mol/L phosphate buffer at 4°C were then processed for flat embedding in Epon. By using the slit in the ventral aspect of the cord as a marker, the processed sections were mounted caudal side up on blank Epon blocks, and 1-μm sections were taken from the face. The 1-μm sections were stained with toluidine blue and coverslipped for histologic evaluation. The goal was to examine the histologic findings of 1-μm sections that were 500 μm apart and compare this to MR images. In this manner, we could estimate how far the counted axons (obtained from the 50-μm sections) were from the image center. Digital histologic images were also obtained at 16× from the center of the transplant and evaluated with Osiris software to determine remaining white and gray matter, similar to that described for the MR images (Fig 5).
Statistical Analysis
Data were examined by using mean, median, SD, and range. For evaluation of behavioral recovery, we used repeated-measures analysis of variance (ANOVA) to compare the two groups (unmodified and BDNF-expressing fibroblasts) by using time as the repeating measure. If a significant group-time interaction was obtained, post hoc analysis with the Mann-Whitney U test was performed, as the BBB results are ordinal. We used the Student t test for independent samples to compare the two groups (unmodified and BDNF-expressing fibroblasts) in terms of their ADC values in transplants and amounts of preserved spinal cord white and gray matter. Repeated-measures ANOVA was used to compare the three groups (unmodified fibroblasts, BDNF-expressing fibroblasts, and normal controls) by using distance as the repeating measure when evaluating ADC values and anisotropy index in the right DLF. ANOVA was used to compare the three groups when evaluating the ADC values and anisotropy index of the bilateral corticospinal tracts and left DLF at the level of the transplant. For evaluation of axon counts, repeated-measures ANOVA was used with two groups (unmodified and BDNF-expressing fibroblasts), as only one normal control was labeled, by using distance as the repeating measure. If repeated-measures ANOVA or ANOVA resulted in overall statistically significant results, post hoc analysis was performed by using Bonferroni adjustment for multiple comparisons. For associations involving axon counts, only animals with transplants were used because there was only one normal control with axon labeling. Correlations between axon and ADC values were examined with Pearson correlation for all measured observations by using 10 animals that had undergone transplantation, each with seven measurements. For repeated-measures ANOVA and ANOVA, results are reported with the F value, and Pearson correlation results are reported with r value.
Results
Axon Counts in Labeled RST
The percentage loss of axons significantly increased (F8,64 = 68.5, P < .0001) with measurements taken closer to the transplant (Figs 6 and 7), consistent with expected progressive axonal dieback of the RST from the site of injury. No statistically significant difference was noted between transplant types. At 500 μm rostral to the transplant, however, we noted that the animals with BDNF-expressing fibroblast transplants had a greater percentage of remaining labeled axons, suggesting that BDNF may decrease axonal dieback. Growth of axons into the most rostral aspect of the transplants was minimal, and evaluation of white matter caudal to the transplant in cross section showed no labeled axons, suggesting no regeneration of RST axons through, or around, the transplant.
Fig 6.
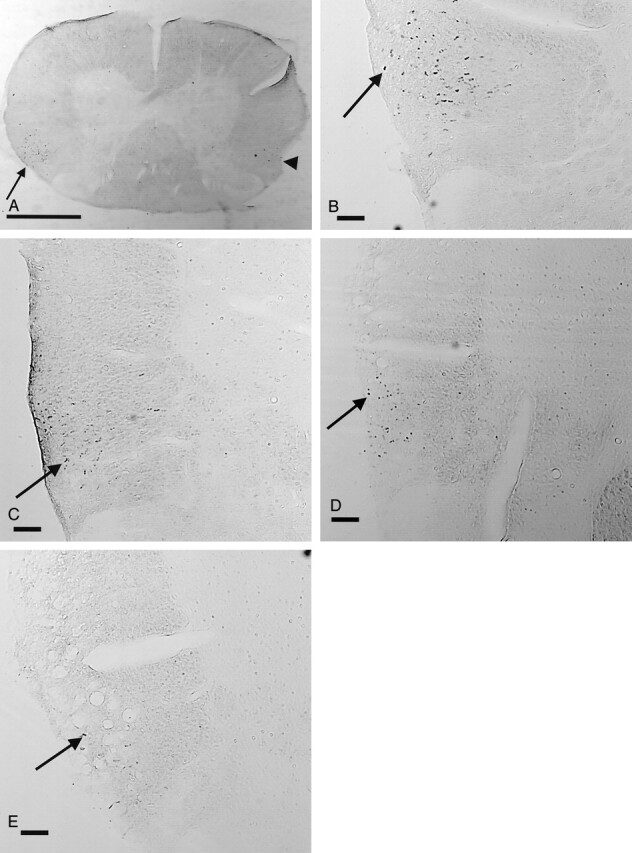
Histologic images of BDA anterograde of labeled axons in the right RST.
A and B, Normal images at magnification X16 (A, bar = 1.0 mm) and at magnification X50 (B, bar = 0.1 mm) show numerous labeled axons in the right RST (arrow). There are a few labeled axons on the contralateral side (arrowhead in A), as approximately 10% of RST axons do not cross the midline. For orientation, a slit was made in the ventral left white matter before sectioning.
C–E, Histologic images of the right RST in an animal with an unmodified fibroblast graft at magnification X50 (bar = 0.1 mm) obtained at 3.5 mm rostral (C), 1.5 mm rostral (D), and 1.0 mm rostral (E) to the transplant. Note that the number of labeled axons (arrow) decreases as images are obtained closer to the transplant.
Fig 7.

RST axonal dieback. Graph indicates increasing percentage loss of axons as counts are obtained closer to the grafts. Axon count at 4.0 mm rostral to graft is reference value (0% loss). Note that the normal animal (▴) has a small loss of axons due to the normal exiting of RST axons in the cervical spinal cord.
ADC Values in Injured DLF
ADC values and anisotropy index within the injured DLF were significantly different from that of the normal controls, both rostral and caudal to the injury (Fig 8). These alterations were greatest closer to the injury site, which was expected, as the white matter adjacent to the surgical cavity would be most severely injured.
Fig 8.

A–C, Graphs of ADC values and anisotropy index (AI) in the right DLF both rostral and caudal to the transplants. * indicates both animals with unmodified fibroblasts and those with BDNF-expressing fibroblasts were significantly different from normal controls; #, unmodified fibroblasts significantly different from normal controls; ∼, BDNF-expressing fibroblasts significantly different from normal controls; +, unmodified fibroblasts significantly different from BDNF-expressing fibroblasts.
A, The tADC values in the right DLF become significantly elevated in white matter adjacent to the grafts, both rostral and caudal. These values become closer to normal as measurements are obtained further from injury site.
B, The lADC values in the right DLF become significantly decreased in white matter adjacent to the grafts compared with those of normal controls, both rostral and caudal. These values become closer to normal as measurements are obtained further from injury site.
C, Anisotropy index (AI) values become significantly elevated (decreased anisotropy) in white matter adjacent to the grafts compared with those in normal controls, both rostral and caudal. These values become closer to normal as measurements are obtained further from injury site.
The tADC values in injured DLF, both rostral and caudal to the grafts, significantly increased as measurements were taken closer to the transplant (Fig 8A) (rostral F6,66 = 61.2, P < .0001; caudal F6,66 = 64.7, P < .0001). There was also a group-distance interaction (rostral F12,66 = 13.0, P < .0001; caudal F12,66 = 13.2, P < .0001), and post hoc testing showed significant elevation of the tADC values in animals with transplants, up to 3.5 mm rostal and caudal to the transplant. There was a single point (2 mm caudal to transplant) in which the tADC values in animals with unmodified fibroblasts were significantly lower than those values in animals with BDNF-expressing fibroblasts. This single point, which was not adjacent to the transplant and which was the only ADC measurement that was significantly different between transplant types, may be spurious.
The lADC values in injured DLF were decreased as measurements were taken closer to the rostral aspect of the transplant (rostral F6,66 = 8.8, P < .0001) (Fig 8B). Although animals with transplants had caudal lADC values lower than those of normal controls, there was no interaction for distance. There was, however, a group-distance interaction both rostral and caudal to the transplant (rostral F12,66 = 2.8, P < .0001; caudal F12,66 = 2.4, P = .011), with post hoc testing showing that animals with transplants had significantly lower lADC values than those of normal controls, up to 2.5 mm rostral and 3.5 mm caudal to the grafts. No differences were seen between transplant types.
Anisotropy index values significantly increased as measurements were taken closer to the transplant (rostral F6,66 = 97.4, P < .0001; caudal F6,66 = 42.1, P < .0001) (Fig 8C). There was group-distance interaction both rostral and caudal to the transplant (rostral F12,66 = 20.3, P < .0001; caudal F12,66 = 10.1, P < .0001), with post hoc testing showing that animals with transplants had significantly elevated anisotropy index values up to 3.5 mm rostral and 3.5 mm caudal. As with tADC values, there was a single point (2.0 mm caudal to transplant) in which the anisotropy index values in animals with unmodified fibroblasts were significantly lower than those values in animals with BDNF-expressing fibroblasts.
These alterations in tADC, lADC, and anisotropy index correlated with the degree of axonal loss and dieback rostral to the injury. Increases in tADC, decreases in lADC, and increases in anisotropy index all strongly correlated with increasing percentage loss of axons (tADC, r = 0.72, P < .0001; lADC, r = −0.69, P < .0001; anisotropy index, r = 0.77, P < .0001) (Fig 9). This correlation suggests that ADC values may be able to evaluate the degree of axonal dieback and preservation.
Fig 9.

Scatterplots of ADC values and anisotropy index versus axonal dieback
A and B, Scatterplots of tADC and lADC versus percentage axonal dieback show that as axonal loss increases closer to the injury site, tADC increases and lADC decreases.
C, Scatterplot of anisotropy index (tADC/lADC ratio) versus percentage axonal dieback shows that the changes in ADC values seen with increasing axonal loss produce an increasing anisotropy index, indicating decreasing anisotropic water diffusion.
ADC Values in Fibroblast Transplants
Animals with BDNF-expressing fibroblast grafts had significantly lower tADC ( P = .025) and lADC ( P = .003) values compared with those with unmodified fibroblast grafts (Table 1). The anisotropy index within the graft suggested water diffusivity was close to isotropic, and no significant difference was noted between transplant types. Although there was almost 100% loss of labeled axons in the transplant, increased numbers of remaining labeled axons at 500 μm rostral to the transplant significantly correlated with lower ADC values in the transplant (tADC, r = 0.76, P = .011; lADC, r = 0.81, P = .005); no significant correlation with anisotropy index was noted. This finding suggests that lower ADC values in the transplant may correspond to transplant function as it relates to axonal dieback and preservation.
TABLE 1:
Measurement of ADC values in the BDNF-expressing fibroblast transplants and the unmodified fibroblast transplants
| ADC Measure | BDNF-Expressing (n = 5) | Unmodified (n = 6) |
|---|---|---|
| tADC (10 −4 mm 2/s)* | 5.13 ± 0.1 | 5.64 ± 0.1 |
| lADC (10 −4 mm 2/s)* | 6.14 ± 0.1 | 6.95 ± 0.1 |
| AI (tADC/lADC ratio) | 0.84 ± 0.1 | 0.81 ± 0.1 |
Note.—AI indicates anisotropy index. All scores are mean ± standard error.
Indicates significant difference ( P < .05) between transplant types.
ADC Measurements in Intact Left DLF and Bilateral Corticospinal Tracts
Evaluation of MR images demonstrated that the left DLF was not surgically transected. The tADC, lADC, and anisotropy index of the left DLF at the level of the lesion were evaluated in all animals with transplants, as were values from normal controls, and ANOVA showed no significant group differences. This finding suggests that the left DLF was not significantly injured during the surgery or secondary to surgical complications such as ischemia.
Evaluation of MR images also showed that the corticospinal tracts were preserved bilaterally in all animals. No significant differences were noted among the groups (unmodified fibrolasts, BDNF-expressing fibroblasts, and normal controls) when evaluating the tADC and anisotropy index values bilaterally. No significant differences were noted among the groups when evaluating the lADC of the right corticospinal tract. ANOVA showed overall group differences within lADC values of the left corticospinal tract (F2,11 = 4.1, P = .046); however, post hoc analysis showed no significant differences among the groups. As measurements in the transplant groups do not differ from those of normal controls, these findings suggest that the corticospinal tract was preserved and that injury to white matter was localized to the DLF. This finding is important, as damage to the corticospinal tracts would be expected to affect behavioral testing.
Analysis of Lesion Size
No statistically significant difference was noted between the amounts of preserved right-sided gray and white matter at lesion center between transplant types, measured with either MR imaging or histologic examination (Table 2). In addition, no difference was noted in left-sided spinal cord area between operative animals and normal controls, again confirming that surgical injury to the spinal cord was restricted to the right side.
TABLE 2:
MR imaging and histologic measurements of preserved right-sided tissue
| Preserved Right-Sided Tissue | MR Imaging Measurements |
Histologic Measurements |
||||
|---|---|---|---|---|---|---|
| BDNF-Expressing Fibroblasts (n = 5) | Unmodified Fibroblasts (n = 6) | Normal Control (n = 3) | BDNF-Expressing Fibroblasts (n = 5) | Unmodified Fibroblasts (n = 6) | Normal Control (n = 3) | |
| White matter (mm 2) | 0.73 ± 0.09 | 0.86 ± 0.09 | 3.00 ± 0.12 | 0.70 ± 0.09 | 0.87 ± 0.08 | 2.56 ± 0.11 |
| Gray matter (mm 2) | 0.10 ± 0.04 | 0.14 ± 0.04 | 1.06 ± 0.5 | 0.20 ± 0.08 | 0.40 ± 0.07 | 0.96 ± 0.10 |
Note.—All scores are mean ± standard error.
Comparison between histologic and MR imaging measurements of remaining right-sided white matter showed no statistically significant difference (Table 2), and the histologic and MR imaging measurements strongly correlated (r = 0.76, P = .008). This finding suggests that MR imaging can accurately measure and differentiate white matter from transplant or gray matter. Histologic and MR imaging measurements between the amounts of remaining right-sided gray matter also correlated (r = 0.62, P = .042); however, the MR imaging measurements were significantly lower than the histologic measurements ( P = .001). The MR imaging measurements appeared to be proportionally underestimating spared gray matter and therefore may still be useful in comparing lesion size. Correlations between MR imaging and histologic measurements have also been shown previously (4).
Behavioral Measures
Hindlimb function, as evaluated by using a modified BBB score, showed significant recovery (F6,54 = 154.3, P < .0001), with improved scores seen from week 1 to week 12, indicating behavioral recovery for all animals with only modest deficits (Fig 10). At week 12, we did see a statistically significant improvement in those animals with BDNF-expressing transplants compared with those animals with unmodified transplants ( P = .026); however, all operative animals, regardless of transplant type, recovered weight-supported stepping, and the measured difference was small enough to be likely not functionally significant. Unlike our previous study, no correlation was seen between closer-to-normal ADC values and improved behavioral recovery, which may be a reflection of a smaller lesion size used in this study (4). The lesions in this study may be too small and discreet for behavioral differences to be distinguished with current behavioral tests, and we are currently developing behavioral tests that are more sensitive and specific to RST injury.
Fig 10.

Recovery of function in the affected right hindlimb occurred in all animals over time as measured with a modified BBB scale. At 12 weeks, the animals with BDNF-expressing fibroblast grafts had significantly better scores than those of animals with unmodified fibroblast grafts (+ indicates P < .05). The difference at 12 weeks is small, however, and likely not functionally significant.
Discussion
Epidemiology of Spinal Cord Injury and Need for Noninvasive Monitoring
There are an estimated 11,000 new victims of spinal cord injury every year, with a current prevalence of close to 200,000 (20, 21). Only the early administration of methylprednisolone has been associated with improvement in functional outcome in large clinical trials (22, 23), although even the efficacy of this treatment is controversial (24, 25). Other interventions have been identified that are neuroprotective, prevent axonal dieback, stimulate axonal growth, and subsequently improve function after experimental spinal cord injury (26, 27). Based on these experimental results, some transplantation regimens have been, or are currently, under clinical investigation (28–30). As histologic confirmation of treatment and transplant efficacy is not feasible in a clinical setting, and as behavioral recovery may proceed more slowly in humans than animal models, it is important to develop a noninvasive technique that can monitor response to treatment. A 2003 National Institute of Neurologic Disorders and Stroke (NINDS) workshop entitled “Translating Promising Strategies for Spinal Cord Injury Therapy” emphasized the importance of improving outcome measures that are sensitive to regeneration and plasticity (http://www.ninds.nih.gov/news_and_events/sci_translation_workshop.htm).
MR imaging is currently the best technique for evaluation of spinal cord parenchyma after injury. Conventional MR images, however, are limited to providing anatomic information, including the degree of spinal cord compression, amount of hemorrhage, and center of the injury. These initial results with conventional MR imaging correlate with clinical outcome (31–35); however, follow-up imaging of chronic spinal cord injury has been limited to assessment of spinal cord morphology and the development of posttraumatic syringomyelia and myelomalacia (36–41). MR imaging in clinical studies of human fetal spinal cord grafts placed in posttraumatic spinal cord cysts was also confined to postoperative follow-up of cyst obliteration by the grafts (29, 42). Conventional MR imaging, therefore, appears limited to assessing macroscopic changes in the injured spinal cord and not the integrity of the white matter. This limitation likely explains the limited success of MR imaging as a prognostic tool, because it is the degree and location of injured and spared white matter that primarily determine subsequent function. Another technique is needed to evaluate functionally significant microscopic effects of potential treatments that may not alter overall spinal cord morphology, and DW imaging is a promising technique. DW imaging has been shown to be more sensitive than conventional MR imaging in evaluating spinal cord axonal integrity, degree of injury, and neuroprotection after treatment (3–5, 43). We have also shown that DW imaging can depict the effects of axonal regrowth into BDNF-expressing fibroblast transplants (4). However, to our knowledge, the present study is the first to show quantitatively that ADC values correlate with histologic parameters that would help meet the defined goals of NINDS.
Perturbations in ADC Values Reflect Degree of Axonal Loss in White Matter
Our findings show that the degree of progressive axonal dieback in spinal white matter strongly correlates with the degree of abnormality in measured ADC values. Therefore, it appears that ADC measurements reflect changes in axonal numbers, a microscopic histologic parameter that has been shown to be important in determining function, and therefore may be used as a measure of treatment efficacy. The changes of ADC values in response to axonal loss are likely a consequence of the structural properties of spinal cord white matter.
In the spinal cord, where most axons are oriented in the same direction, anisotropic water diffusion has been demonstrated and thought to be due to diffusion barriers, such as cell membranes and myelin sheaths, being encountered as water diffuses perpendicular (transverse) to the white matter tracts, rather than parallel (longitudinal) (44–47). After spinal cord injury, the initial transection of axons, as well as secondary axonal and myelin sheath degeneration, would be expected to decrease barriers to water diffusion in the transverse direction, as the cell membrane and myelin sheath are no longer intact. The tADC is thus seen to increase to levels greater than normal, and the greatest increase is closest to the center of the injury (3, 4), where axonal loss is greatest. Increased diffusivity transverse to white matter tracts has also been shown with diffusion tensor imaging after traumatic brain injury (48).
The lADC in and surrounding a chronic spinal cord injury decreases. The histologic basis for this decrease has not yet been elucidated. Although the loss of axons may be expected to increase water diffusion, as it does in chronic cerebral infarcts (49, 50), the lADC in traumatically injured spinal cord and brain is not elevated, and instead stays below that of normal tissue (4, 48). Vorisek et al (51) provide a possible explanation when they noted that there was both astrocyte proliferation and increased expression of chondroitin sulfate proteoglycan in the extracellular matrix after experimental traumatic brain injury, both of which may contribute to consistently decreased water diffusion. These changes may be maximal at sites of greatest axonal loss, explaining our correlation between decreasing lADC values and decreasing numbers of labeled axons.
With an increase in tADC and a decrease in lADC, there is a subsequent decrease in anisotropy. Our anisotropy index measure shows the greatest loss of anisotropy to occur closest to injury center, which correlated with the greatest loss of axons. In a study of ex vivo spinal cord specimens after contusion injury and a neuroprotective treatment, Nevo et al (5, 52) defined an anisotropy ratio as AI = (lADC − tADC)/(lADC + tADC) and showed that spinal cords in rats who received treatment had a greater degree of anisotropy on average (measured as mean anisotropy index values as well as the sum of anisotropy index values over all pixels in a section), than did control rats who received no treatment following injury. As there has not been a quantitative evaluation of what factors are responsible for ADC values and their subsequent changes after injury, it is unclear whether it is more advantageous to evaluate individual ADC values or a calculated measure of anisotropy.
ADC Values in Spinal Cord Transplants Appear to Reflect Degree of Axonal Regrowth
The finding of lower tADC and lADC values in the BDNF-expressing fibroblast transplants may be due to the increased numbers of ingrown axons seen in these transplants (4), which results in greater numbers of cell membranes that act as diffusion barriers. As these axons do not appear to orient in a particular direction, we see the decrease in water diffusion both in the transverse and longitudinal directions. In this study, decreased axonal dieback at 0.5 mm rostral to the transplant correlated with lower ADC values in the transplant, again suggesting that functioning grafts that stimulate axonal sprouting or regrowth can be identified by their lower ADC values. Intrinsic differences between transplant types, such as fibroblast density, which could potentially result in the measured ADC differences, have not been observed.
Methodological Considerations
We have shown a progressive decrease in labeled axons within the RST over distance after transection of this descending spinal cord tract, similar to that shown in another descending spinal cord tract, the corticospinal tract, after surgical transection (53, 54) or contusion (55). The current results differ from those of Houle and Jin (56), however, who found mean axonal dieback of chronically injured RST axons to be 0.5 mm, with terminal axon bulbs rarely being seen greater than 1 mm from the injury site. Houle and Jin, however, only evaluated up to 1 mm rostral to an injury and did not use normal controls to evaluate overall axonal loss. To preserve tissue for future evaluation with axonal morphometry, we used a paraformaldehyde-glutaraldehyde fixative, rather than paraformaldehyde alone. Although the use of glutaraldehyde will allow future evaluation of axonal morphometry with 1-μm-thick sectioning, the 50-μm-thick sections for axon labeling required special washing with borohydride to perform immunohistochemistry. This technical limitation may decrease labeling efficiency, especially in smaller regenerating and sprouting axons, possibly explaining our lack of labeled small caliber RST axons regenerating and sprouting into and through BDNF-expressing fibroblast transplants, which have been seen in prior studies (8).
In vivo DW imaging of the rat spinal cord has been shown to be feasible; however, the use of fixed tissue in this study was necessary to obtain the resolution required to accurately identify specific axonal tracts. A recent diffusion tensor imaging study comparing in vivo mouse brain with fixed mouse brain showed that while overall trace diffusion decreases in fixed tissue, the directional ADC values decrease proportionally, resulting in identical diffusional anisotropy data (57). These findings suggest that diffusional data obtained from fixed tissue, as in our study, can be extrapolated to living tissue. In our study, we did not need to obtain the full diffusion tensor because the longitudinal arrangement of the axons in the white matter results in cylindrical symmetry, and we can carefully align the spinal cord specimen within the magnet (58).
Future Directions
Correlation of MR diffusion measurements with precise axonal morphometric analysis is the next logical step in determining the histologic basis of DW MR imaging. To do this type of extensive analysis in vertebrate animals, we are developing a semiautomated method of evaluating histologic images from 1-μm-thick sections (59). Ultimately, a model may be generated that will allow DW imaging to predict histologic factors, such as axon density, that are important in delineating the initial spinal cord injury, as well as response to treatment.
Conclusion
DW imaging with the measurement of ADC values has been shown to be more sensitive than conventional MR imaging in evaluating the degree of spinal cord injury, and this study further supports the use of DW imaging by demonstrating quantitatively that alterations in ADC values in injured white matter correlate with axonal loss. In addition, it appears that ADC values in the transplants may reflect graft function by corresponding to the degree of adjacent axonal dieback and preservation.
Acknowledgments
The authors thank Theresa Connors for her advice and help.
Footnotes
Funding provided by National Institutes of Health grants NS02230, NS24707, NS41380 and the Research Services of the Department of Veteran Affairs.
Presented in part at the annual meeting of the American Society of Neuroradiology, Washington D.C., April 27–May 2, 2003.
References
- 1.Selzer ME. Promotion of axonal regeneration in the injured CNS. Lancet Neurol 2003;2:157–166 [DOI] [PubMed] [Google Scholar]
- 2.Raineteau O, Schwab ME. Plasticity of motor systems after incomplete spinal cord injury. Nat Rev Neurosci 2001;2:263–273 [DOI] [PubMed] [Google Scholar]
- 3.Ford JC, Hackney DB, Alsop DC, et al. MRI characterization of diffusion coefficients in a rat spinal cord injury model. Magn Reson Med 1994;31:488–494 [DOI] [PubMed] [Google Scholar]
- 4.Schwartz ED, Shumsky JS, Wehrli S, Tessler A, Murray M, Hackney DB. Ex vivo MR determined apparent diffusion coefficients correlate with motor recovery mediated by intraspinal transplants of fibroblasts genetically modified to express BDNF. Exp Neurol 2003;182:49–63 [DOI] [PubMed] [Google Scholar]
- 5.Nevo U, Hauben E, Yoles E, et al. Diffusion anisotropy MRI for quantitative assessment of recovery in injured rat spinal cord. Magn Reson Med 2001;45:1–9 [DOI] [PubMed] [Google Scholar]
- 6.Kim D, Liu Y, Browarek T, et al. Transplants of fibroblasts genetically modified to express BDNF promote recovery of forelimb and hindlimb funtions in the adult rat [abstr]. Abstr Soc Neurosci 1999;25:492. [DOI] [PMC free article] [PubMed] [Google Scholar]
- 7.Kim D, Schallert T, Liu Y, et al. Transplantation of genetically modified fibroblasts expressing BDNF in adult rats with a subtotal hemisection improves specific motor and sensory functions. Neurorehabil Neural Repair 2001;15:141–150 [DOI] [PubMed] [Google Scholar]
- 8.Liu Y, Kim D, Himes BT, et al. Transplants of fibroblasts genetically modified to express BDNF promote regeneration of adult rat rubrospinal axons and recovery of forelimb function. J Neurosci 1999;19:4370–4387 [DOI] [PMC free article] [PubMed] [Google Scholar]
- 9.Himes BT, Tessler A. Neuroprotection from cell death following axotomy. In: Ingoglia NA, Murray M, eds. Axonal Regeneration in the Central Nervous System. New York: Marcel Dekker,2001;477–503
- 10.Jin Y, Fischer I, Tessler A, Houle JD. Transplants of fibroblasts genetically modified to express BDNF promote axonal regeneration from supraspinal neurons following chronic spinal cord injury. Exp Neurol 2002;177:265–275 [DOI] [PubMed] [Google Scholar]
- 11.Liu Y, Himes BT, Tryon B, et al. Intraspinal grafting of fibroblasts genetically modified by recombinant adenoviruses. Neuroreport 1998;9:1075–1079 [DOI] [PubMed] [Google Scholar]
- 12.Molander C, Gunnar G. Spinal cord cytoarchitecture. In: Paxinos G, ed. The Rat Nervous System. San Diego: Academic Press, Inc.,1995;39–45
- 13.Tracey DJ. Ascending and descending pathways in the spinal cord. In: Paxinos G, ed. The Rat Nervous System. San Diego: Academic Press, Inc.,1995. :67–80
- 14.Basso DM, Beattie MS, Bresnahan JC. A sensitive and reliable locomotor rating scale for open field testing in rats. J Neurotrauma 1995;12:1–21 [DOI] [PubMed] [Google Scholar]
- 15.Stejskal EO, Tanner JE. Spin diffusion measurements: spin echoes in the presence of a time-dependent field gradient. J Chem Phys 1965;42:288–292 [Google Scholar]
- 16.Mills R. Self-diffusion in normal and heavy water in the range 1–45 degrees. J Phys Chem 1973;77:685–688 [Google Scholar]
- 17.Basso DM, Beattie MS, Bresnahan JC. Graded histological and locomotor outcomes after spinal cord contusion using the NYU weight-drop device versus transection. Exp Neurol 1996;139:244–256 [DOI] [PubMed] [Google Scholar]
- 18.Merkler D, Metz GA, Raineteau O, Dietz V, Schwab ME, Fouad K. Locomotor recovery in spinal cord-injured rats treated with an antibody neutralizing the myelin-associated neurite growth inhibitor Nogo-A. J Neurosci 2001;21:3665–3673 [DOI] [PMC free article] [PubMed] [Google Scholar]
- 19.Schucht P, Raineteau O, Schwab ME, Fouad K. Anatomical correlates of locomotor recovery following dorsal and ventral lesions of the rat spinal cord. Exp Neurol 2002;176:143–153 [DOI] [PubMed] [Google Scholar]
- 20.Croul DE, Flanders AE. Neuropathology of human spinal cord injury. In: Seil FJ, ed. Advances in Neurology, Vol 72; Neuronal Regeneration, Reorganization, and Repair. Philadelphia: Lippincott-Raven,1997 [PubMed]
- 21.DeVivo MJ. Epidemiology of traumatic spinal cord injury. In: Kirshblum S, Campagnolo DI, Delisa JA, eds. Spinal Cord Medicine. Philadelphia: Lippincott Williams and Wilkins,2002. :69–81
- 22.Bracken MB, Shepard MJ, Collins WFJ, et al. Methylprednisolone or naloxone treatment after acute spinal cord injury: 1-year follow-up data. Results of the second national acute spinal cord injury study. J Neurosurg 1992;76:23–31 [DOI] [PubMed] [Google Scholar]
- 23.Schwab ME. Bridging the gap in spinal cord regeneration. Nat Med 1996;2:976–977 [DOI] [PubMed] [Google Scholar]
- 24.Bracken MB. Methylprednisolone and acute spinal cord injury: an update of the randomized evidence [Suppl]. Spine 2001;26:S47–54 [DOI] [PubMed] [Google Scholar]
- 25.Hurlbert RJ. The role of steroids in acute spinal cord injury: an evidence-based analysis. Spine 2001;26:S39–46 [DOI] [PubMed] [Google Scholar]
- 26.Murray M. Therapies to promote CNS repair. In: Ingoglia NA, Murray M, eds. Axonal Regeneration in the Central Nervous System. New York: Marcel Dekker, Inc.,2001
- 27.Lu K, Waite P. Spine update: advances in spinal cord regeneration. Spine 1999;24:926–930 [DOI] [PubMed] [Google Scholar]
- 28.Thompson FJ, Reier PJ, Uthman B, et al. Neurophysiological assessment of the feasibility and safety of neural tissue transplantation in patients with syringomyelia. J Neurotrauma 2001;18:931–945 [DOI] [PubMed] [Google Scholar]
- 29.Wirth ED 3rd, Reier PJ, Fessler RG, et al. Feasibility and safety of neural tissue transplantation in patients with syringomyelia. J Neurotrauma 2001;18:911–929 [DOI] [PubMed] [Google Scholar]
- 30.McDonald JW, Becker D. Spinal cord injury: promising interventions and realistic goals. Am J Phys Med Rehabil 2003;82:S38–49 [DOI] [PubMed] [Google Scholar]
- 31.Ramon S, Dominguez R, Ramirez L, et al. Clinical and magnetic resonance imaging correlation in acute spinal cord injury. Spinal Cord 1997;35:664–673 [DOI] [PubMed] [Google Scholar]
- 32.Takhtani D, Melhem ER. MR imaging in cervical spine trauma. Magn Reson Imaging Clin N Am 2000;8:615–634 [PubMed] [Google Scholar]
- 33.Ditunno JF, Flanders AE, Kirshblum S, Graziani V, Tessler A. Predicing outcome in traumatic spinal cord injury. In: Kirshblum S, Campagnolo DI, Delisa JA, eds. Spinal Cord Medicine. Philadelphia, PA: Lippincott Williams & Wilkins,2002;108–122
- 34.Flanders AE, Spettell CM, Friedman DP, Marino RJ, Herbison GJ. The relationship between the functional abilities of patients with cervical spinal cord injury and the severity of damage revealed by MR imaging. Am J Neuroradiol 1999;20:926–934 [PMC free article] [PubMed] [Google Scholar]
- 35.Kulkarni MV, McArdle CB, Kopanicky D, et al. Acute spinal cord injury: MR imaging at 1.5 T. Radiology 1987;164:837–843 [DOI] [PubMed] [Google Scholar]
- 36.Milhorat TH, Johnson RW, Milhorat RH, Capocelli AL, Pevsner PH. Clinicopathologic correlations in syringomyelia using axial magnetic resonance imaging. Neurosurgery 1995;37:206–213 [DOI] [PubMed] [Google Scholar]
- 37.Jinkins JR, Reddy S, Leite CC, Bazan C, Xiong L. MR of parenchymal spinal cord signal change as a sign of active advancement in clinically progressive posttraumatic syringomyelia. AJNR Am J Neuroradiol 1998;19:177–182 [PMC free article] [PubMed] [Google Scholar]
- 38.Quencer RM, Sheldon JJ, Post MJ, et al. MRI of the chronically injured cervical spinal cord. AJR Am J Roentgenol 1986;147:125–132 [DOI] [PubMed] [Google Scholar]
- 39.Schurch B, Wichmann W, Rossier AB. Post-traumatic syringomyelia (cystic myelopathy): a prospective study of 449 patients with spinal cord injury. J Neurol Neurosurg Psychiatry 1996;60:61–67 [DOI] [PMC free article] [PubMed] [Google Scholar]
- 40.Schwartz ED, Falcone SF, Quencer RM, Green BA. Posttraumatic syringomyelia: pathogenesis, imaging, and treatment. AJR Am J Roentgenol 1999;173:487–492 [DOI] [PubMed] [Google Scholar]
- 41.Bodley R. Imaging in chronic spinal cord injury: indications and benefits. Eur J Radiol 2002;42:135–153 [DOI] [PubMed] [Google Scholar]
- 42.Falci S, Holtz A, Akesson E, et al. Obliteration of a postraumatic spinal cord cyst with solid human embryonic spinal cord grafts: first clinical attempt. J Neurotrauma 1997;14:875–884 [DOI] [PubMed] [Google Scholar]
- 43.Schwartz ED, Yezierski RP, Pattany PM, Quencer RM, Weaver RG. Diffusion-weighted MR imaging in a rat model of syringomyelia after excitotoxic spinal cord injury. AJNR Am J Neuroradiol 1999;20:1422–1428 [PMC free article] [PubMed] [Google Scholar]
- 44.Schwartz ED, Hackney DB. Diffusion weighted MRI and the evaluation of spinal cord axonal integrity following injury and treatment. Exp Neurol 2003;184:570–589 [DOI] [PubMed] [Google Scholar]
- 45.Schwartz ED, Chin CL, Takahashi M, Hwang SN, Hackney DB. Diffusion-weighted imaging of the spinal cord. Neuroimaging Clin N Am 2002;12:125–146 [DOI] [PubMed] [Google Scholar]
- 46.Clark CA, Werring DJ. Diffusion tensor imaging in spinal cord: methods and applications—a review. NMR Biomed 2002;15:578–586 [DOI] [PubMed] [Google Scholar]
- 47.Beaulieu C. The basis of anisotropic water diffusion in the nervous system: a technical review. NMR Biomed 2002;15:435–455 [DOI] [PubMed] [Google Scholar]
- 48.Arfanakis K, Haughton VM, Carew JD, Rogers BP, Dempsey RJ, Meyerand ME. Diffusion tensor MR imaging in diffuse axonal injury. AJNR Am J Neuroradiol 2002;23:794–802 [PMC free article] [PubMed] [Google Scholar]
- 49.Sotak CH. The role of diffusion tensor imaging in the evaluation of ischemic brain injury: a review. NMR Biomed 2002;15:561–569 [DOI] [PubMed] [Google Scholar]
- 50.Takahashi M, Fritz-Zieroth B, Chikugo T, Ogawa H. Differentiation of chronic lesions after stroke in stroke-prone spontaneously hypertensive rats using diffusion weighted MRI. Magn Reson Med 1993;30:485–488 [DOI] [PubMed] [Google Scholar]
- 51.Vorisek I, Hajek M, Tintera J, Nicolay K, Sykova E. Water ADC, extracellular space volume, and tortuosity in the rat cortex after traumatic injury. Magn Reson Med 2002;48:994–1003 [DOI] [PubMed] [Google Scholar]
- 52.Hauben E, Butovsky O, Nevo U, et al. Passive or active immunization with myelin basic protein promotes recovery from spinal cord contusion. J Neurosci 2000;20:6421–6430 [DOI] [PMC free article] [PubMed] [Google Scholar]
- 53.Oudega M, Vargas CG, Weber AB, Kleitman N, Bunge MB. Long-term effects of methylprednisolone following transection of adult rat spinal cord. Eur J Neurosci 1999;11:2453–2464 [DOI] [PubMed] [Google Scholar]
- 54.Pallini R, Fernandez E, Sbriccoli A. Retrograde degeneration of corticospinal axons following transection of the spinal cord in rats. J Neurosurg 1988;68:124–128 [DOI] [PubMed] [Google Scholar]
- 55.Hill CE, Beattie MS, Bresnahan JC. Degeneration and sprouting of identified descending supraspinal axons after contusive spinal cord injury in the rat. Exp Neurol 2001;171:153–169 [DOI] [PubMed] [Google Scholar]
- 56.Houle JD, Jin Y. Chronically injured supraspinal neurons exhibit only modest axonal dieback in response to a cervical hemisection lesion. Exp Neurol 2001;169:208–217 [DOI] [PubMed] [Google Scholar]
- 57.Sun SW, Neil JJ, Song SK. Relative indices of water diffusion anisotropy are equivalent in live and formalin-fixed mouse brains. Magn Reson Med 2003;50:743–748 [DOI] [PubMed] [Google Scholar]
- 58.Gulani V, Iwamoto GA, Jiang H, Shimony JS, Webb AG, Lauterbur PC. A multiple echo pulse sequence for diffusion tensor imaging and its application in excised rat spinal cords. Magn Reson Med 1997;38:868–873 [DOI] [PubMed] [Google Scholar]
- 59.Fan Y, Bertrand L, Hackney DB, Schwartz ED, Nissanov J. An automated active contour method for segmentation of white matter histologic images [abstr]. Presented at the 41st annual meeting of the American Society of Neuroradiology, Washington, DC, April 27–May 2,2003