

Abstract
BACKGROUND AND PURPOSE: Optimizing high-grade glioma treatment requires the delineation of edematous and normal brain from tumor, perhaps by using potential differences in the absolute diffusion parameters of water. Our purpose was to determine whether mean diffusivity 〈D〉 and diffusion anisotropic MR imaging data help in this differentiation.
METHODS: Nine patients with high-grade cerebral glioblastoma underwent contrast-enhanced structural and diffusion tensor MR imaging before therapy. Tumor, edematous brain, and apparently normal white matter regions were determined on T2-weighted and contrast-enhanced T1-weighted structural images. Fractional anisotropy (FA) and 〈D〉 were measured in each tissue type. Differences in these values among the tissue types were assessed with a standard analysis of variance.
RESULTS: 〈D〉 was highest in the necrotic tumor core (1825.38 ±404.06) × 10−6 mm2/s, followed by edematous brain (1411.23 ± 322.31) × 10−6 mm2/s, enhancing tumor core (1308.67 ± 292.50) × 10−6 mm2/s, enhancing tumor margin (1229.80 ± 206.80) × 10−6 mm2/s, and normal brain (731.53 ± 35.21) × 10−6 mm2/s. FA was highest in normal brain (0.47 ± 0.08) and lowest in the necrotic core (0.09 ± 0.03). 〈D〉 was significantly different in enhancing tumor margins and edematous brain in all patients; FA was significantly different in only seven. These values were significantly different from those of normal brain in all cases in which they were measurable.
CONCLUSION: 〈D〉 values can be used to differentiate normal white matter, edematous brain, and enhancing tumor margins. Diffusion anisotropic data added no benefit to tissue differentiation. Further studies are required to determine if a 〈D〉 value that corresponds to the limit of tumor invasion can be identified.
Despite recent advances in surgery, radiation therapy, and chemotherapy, the prognosis for patients with high-grade glioma remains poor (1). Therapies are aimed at maximizing the patient’s quality of life and prolonging their life expectancy. To accomplish these goals, surgical resection or biopsy with adjuvant therapy is performed to remove as much tumor as possible while minimizing damage to healthy brain. Conventional imaging tends to cause underestimation of the extent of tumor involvement, which can potentially lead to suboptimal treatment (2). The ability to accurately delineate edematous and normal brain from tumor could help in optimizing treatment in these patients.
Intracranial tumors cause neurologic symptoms by disturbing the architecture and water content of brain tissue. Such alterations in cell structure and integrity may be expected to cause changes in the magnitude and directionality of water diffusion, which can be measured by using diffusion tensor (DT) MR imaging. This is a relatively new imaging modality that allows the apparent diffusion tensor of water D to be measured in each voxel of an image (3). Diagonalizing D produces eigenvalues and eigenvectors, the effective principal diffusivities along the orthotropic axes of the tissue, which can be used to measure the mean diffusivity 〈D〉 and diffusion anisotropy (4) and track white matter fibre trajectories in vivo (5, 6). The measurement of these water diffusion parameters is important not only because they may permit the differentiation of edematous and normal brain from tumor but also because few groups have reported such data in human cerebral tumors. Therefore, the purpose of the present study was to provide fully quantitative measurements of 〈D〉 and the diffusion anisotropy of water molecules in tumor, edematous brain, and normal tissue in treatment-naive patients with high-grade cerebral gliomas by using DT-MR imaging. This baseline information is essential in any attempt to attribute specific imaging parameters to a tissue type and in evaluating the mode of action of different treatments.
Methods
Participants
Nine consecutive patients (six male, three female; age range, 42–74 years, mean age, 57.4 years) with glioblastoma multiforme were included in this prospective study. Their radiologic data did not suggest any neurologic disorders other than the primary neoplasm. The presence of the high-grade glioma was histologically verified by means of either stereotactic biopsy or surgical resection after MR imaging. None of the patients in this group had begun corticosteroid treatment, radiation therapy, or chemotherapy at the time of MR imaging. The local ethics committee approved the study, and written informed consent was obtained from each patient. This study was undertaken at the Scottish Higher Education Funding Council (SHEFC) Brain Imaging Research Centre for Scotland.
MR Imaging Acquisition Parameters
All MR imaging data were obtained by using a Signa LX 1.5-T clinical imager (GE Medical Systems, Milwaukee, WI). The machine was equipped with a self-shielding gradient set (23 mT/m maximum gradient strength, 120 T/m/s slew rate, and a horizontal bore with a 60-cm inner diameter) and manufacturer-supplied birdcage quadrature head coil. Each patient underwent an MR imaging examination that consisted of a fast spin-echoT2-weighted sequence, the DT-MR imaging protocol described next, and a contrast material–enhanced T1-weighted volume sequence. After the DT-MR imaging protocol was completed, 20 mL of gadopentetate dimeglumine (Magnevist, Berlex Laboratories, Wayne, NJ) was administered intravenously. Parameters for the contrast-enhanced T1-weighted volume sequence were a TR/TE/TI/NEX of 7.3/3.2/400/1, a field of view of 240 × 240 mm, an acquisition matrix of 256 × 256, and 110 contiguous axial sections of 1.5 mm thickness. The acquisition times were approximately 2 minutes for the fast spin-echo T2-weighted sequence, 15 minutes for the DT-MR imaging protocol, and 7 minutes for the T1-weighted volume sequence. Thus, the duration of the entire examination was approximately 30 minutes for each patient.
The component images of each DT-MR imaging data set were acquired by using a single-shot diffusion-weighted (DW) spin-echo echo-planar (EP) imaging sequence in which two symmetric trapezoidal gradient pulses of duration δ = 32.2 ms, separation Δ = 39.1 ms, and rise time η = 1.2 ms were inserted around the 180° refocusing pulse in the required gradient channel. Sets of axial DW-EP images (b = 0 and 1000 s/mm2) were collected with diffusion gradients applied sequentially along six non-collinear directions (7). Values for the elements of the b matrix were calculated numerically (8). Five acquisitions that consisted of a baseline T2-weighted EP image (G0) and six DW-EP images (G1 to G6), or a total of 35 images, were collected per section position. Parameters for the DW-EP imaging sequence were a TR/TE of 660/98.8, a field of view of 240 × 240 mm, an acquisition matrix of 128 × 128 (zero filled to 256 × 256), and 15 axial sections of 5-mm thickness with a 1.0-mm section gap.
Image Analysis
All of the magnitude DW-EP images, in Digital Imaging and Communications in Medicine format, that were collected in each examination were transferred from the imager to a Sun UltraSparc Station 10 (Sun Microsystems, Mountain View, CA) and converted into Analyze format (Mayo Foundation, Rochester, MN) by using in-house software written in C computer language. Computations were then performed on the Sun UltraSparc Station 10 by using the Matlab programming environment (Mathworks, Natick, MA).
Physiologic motion artifacts were reduced on the component DW-EP images by separately realigning the five images acquired for each gradient direction within every section using SPM95 software (available at www.fil.ion.ucl.ac.uk/spm). Each set of five images was then averaged to provide seven (G0 to G6) images with a high signal-to-noise ratio for each section (9, 10). Geometric image distortions arising from the strong eddy currents created by the diffusion gradients were then corrected in the six averaged DW-EP images by using a modified version of the iterative cross-correlation algorithm suggested by Haselgrove and Moore (11, 12).
Within each voxel, the six elements of the apparent diffusion tensor D and the baseline T2-weighted signal intensity were estimated from the signal intensities measured in the DW-EP images by means of multivariate linear regression (3). After the diagonalization of D to yield the magnitude-sorted eigenvalues λi, maps of the T2-weighted signal intensity, 〈D〉, and the fractional anisotropy (FA) (13) were generated on a voxel-by-voxel basis and converted into Analyze format.
〈D〉 was calculated as follows (Eq 1):
 |
1) |
FA is used to measure the fraction of the total magnitude of D that is anisotropic and has a value of 0 for isotropic diffusion (λ1 = λ2 = λ3) and 1 for completely anisotropic diffusion (λ1 > 0; λ2 = λ3 = 0). FA was calculated as follows (Eq 2):
 |
2) |
Wherever possible, a neuroradiologist (J.M.W.) identified five tissue types in each patient from the imaging features on the T1-weighted volume and T2-weighted EP images. In addition to normal ipsilateral and contralateral white matter, four other tissue types were identified according to their enhancement on T1-weighted images and signal intensity on T2-weighted images, as follows: 1) enhancing tumor margin, strong enhancement and high intensity; 2) enhancing tumor core, diffuse enhancement and high intensity; 3) nonenhancing tumor core, no enhancement and high intensity; and 4) peritumoral edematous brain, no enhancement and high intensity. Because white matter has a wide range of FA values, the diffusion anisotropy of the centrum semiovale was measured, because this structure has a well-characterized FA value (14, 15). The imaging features and physical locations of these tissue types are shown graphically on representative contrast-enhanced T1-weighted volume and T2-weighted EP images in patient 4 (Fig 1C and D). To permit the accurate determination of lesion and edematous brain boundaries on the structural images acquired in the same axial section position, the contrast-enhanced T1-weighted volume images were directly registered onto the T2-weighted EP images (and hence the DT-MR imaging parametric maps) by using the image boundary and internal landmark information in the SPM95 software. The tissue boundaries were then drawn on the structural images and transferred to the 〈D〉 and FA parametric maps in the Analyze program. Overall mean 〈D〉 and FA values were then calculated from data obtained in each section to provide volume measurements for the entire lesion.
Fig 1.
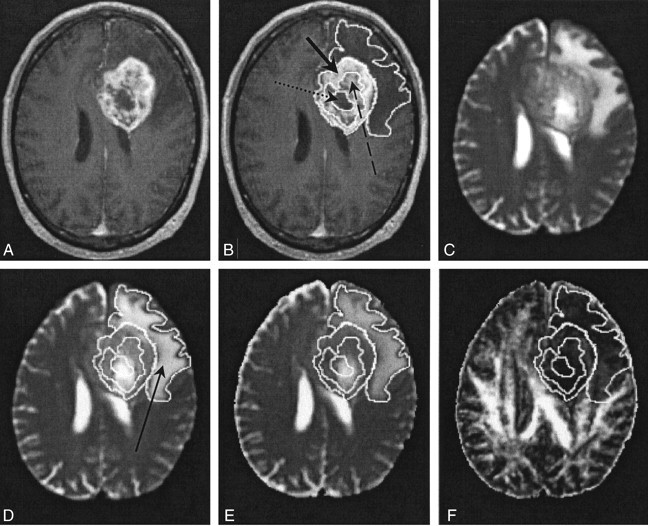
Images in patient 4.
A and B, Contrast-enhanced T1-weighted volume images. In B, the solid arrow indicates a region of an enhancing tumor margin; dashed arrow, enhancing tumor core; dotted arrow, nonenhancing tumor core.
C and D, T2-weighted EP images. Arrow in D indicates a region of edematous brain.
E, 〈D〉 parametric map.
F, FA parametric map.
Statistical Analysis
All data are reported as a mean ± 1 standard deviation. The significance of the differences between 〈D〉 and FA values in the five tissue types in each patient was assessed by using an analysis of variance and post hoc testing with the Scheffé test. In all cases, a P value of less than .05 was considered to indicate a statistically significant difference. The statistical analysis was performed by using SPSS 10.0 (SPSS, Chicago, IL).
Results
The principal results of this study are presented in Tables 1–3. Of the nine patients who participated in this study, the first three had multifocal glioma, as confirmed by the clinical, histologic, and radiologic data. In patient 2, the standard clinical MR images initially showed evidence of a low-grade glioma, and the patient was treated conservatively. He then had intractable seizures and, on presentation, standard MR images showed areas of signal enhancement that were indicative of malignant transformation. The remaining six patients had a large solitary lesion.
TABLE 1:
TABLE 1: 〈D〉 values in the neoplasm, surrounding edematous brain, and normal white matter in nine patients with high-grade glioma
| Patient/Age (y)/Sex | Mean 〈D〉 Value (× 10−6 mm2/s) |
|||||
|---|---|---|---|---|---|---|
| Enhancing Tumor Margin | Enhancing Tumor Core | Nonenhancing Tumor Core | Edematous Brain | Normal White Matter |
||
| Ipsilateral | Contralateral | |||||
| 1/61/F* | 958.69 ± 64.28 | NA | NA | 1127.17 ± 155.62 | 725.53 ± 16.08 | 720.90 ± 37.18 |
| 2/43/M*† | 948.56 ± 52.35 | NA | NA | 923.87 ± 60.71 | 747.34 ± 1.43 | 731.76 ± 11.34 |
| 3/56/F*‡ | 928.34 ± 50.88 | NA | NA | 1221.99 ± 261.25 | NA | NA |
| 4/65/M | 1238.54 ± 158.93 | 1500.83 ± 275.19 | 1861.26 ± 292.52 | 1494.35 ± 210.91 | 717.50 ± 23.28 | 704.44 ± 19.58 |
| 5/71/M | 1195.37 ± 206.51 | 1181.63 ± 294.64 | 1890.93 ± 275.34 | 1477.25 ± 279.53 | 753.10 ± 50.43 | 774.64 ± 63.37 |
| 6/50/M | 1289.65 ± 227.58 | 1571.22 ± 108.36 | 1784.93 ± 301.46 | 1575.23 ± 215.07 | 745.16 ± 25.87 | 735.33 ± 29.34 |
| 7/42/M | 1208.40 ± 170.22 | 1256.69 ± 213.05 | 1264.92 ± 395.20 | 1143.00 ± 326.96 | 739.16 ± 21.58 | 720.83 ± 18.43 |
| 8/55/F | 1185.35 ± 262.88 | 1031.14 ± 326.10 | NA | 1674.29 ± 253.11 | 725.90 ± 27.08 | 715.58 ± 34.79 |
| 9/74/M§ | 1309.58 ± 142.09 | 1356.45 ± 225.76 | 1957.34 ± 424.16 | 1565.69 ± 219.01 | NA | 768.67 ± 9.05 |
| Mean | 1229.80 ± 206.80 | 1308.67 ± 292.50 | 1825.38 ± 404.06 | 1411.23 ± 322.31 | 733.51 ± 31.59 | 730.00 ± 37.69 |
Note.—All values are reported as the mean ± the standard deviation. Normal white matter was the centrum semiovale. NA indicates not applicable.
This patient had a multifocal glioma.
This patient had a low-grade glioma with a malignant core.
T2-weighted EP images depicted abnormal signal intensity throughout the ipsilateral and contralateral centrum semiovale.
T2-weighted EP images depicted abnormal signal intensity throughout the ipsilateral centrum semiovale.
TABLE 3:
TABLE 3: Statistical analysis of differences in 〈D〉 and FA values in nine patients with high-grade glioma
| Comparison | Patients with a Statistically Significant Difference* |
|
|---|---|---|
| 〈D〉 Value | FA | |
| Edematous brain versus enhancing tumor margin | 1–9 | 1, 4–9 |
| Ipsilateral white matter versus enhancing tumor margin | 1, 2, 4–9 | 1, 2, 4–9 |
| Ipsilateral white matter versus edematous brain | 1, 2, 4–9 | 1, 2, 4–9 |
Note.—In patient 3, T2-weighted EP images depicted abnormal signal intensity throughout the ipsilateral and contralateral centrum semiovale. In patient 9, T2-weighted EP images depicted abnormal signal intensity throughout ipsilateral centrum semiovale. Data in the contralateral centrum semiovale were used in this analysis.
P < .05, post hoc Scheffé test.
Figures 2 and 3 show representative contrast-enhanced T1-weighted volume and T2-weighted EP images and 〈D〉 and FA parametric maps in patients 5 and 3, respectively. In Figure 2, the regions corresponding to enhancing tumor rim, enhancing tumor core, nonenhancing tumor core, and edematous brain are clearly visible on the contrast-enhanced T1-weighted volume and the T2-weighted EP images. The enhancing tumor rim and enhancing core are almost isointense compared with the normal-appearing brain parenchyma on the 〈D〉 map. Conversely, the 〈D〉 of edematous brain, and especially the nonenhancing tumor core, was significantly higher than that of normal appearing brain tissue; the FA was significantly lower. These differences in 〈D〉 and FA among the various tissue structures were also seen on the parametric maps obtained in patient 4 (Fig 1). Figure 3 shows that the multifocal glioma had a smaller enhancing lesion, with no visible core on the contrast-enhanced T1-weighted volume image. The edematous brain had a correspondingly lower 〈D〉 value than of patients 4 and 5; however, a marked reduction in diffusion anisotropy in this region was still observed.
Fig 2.
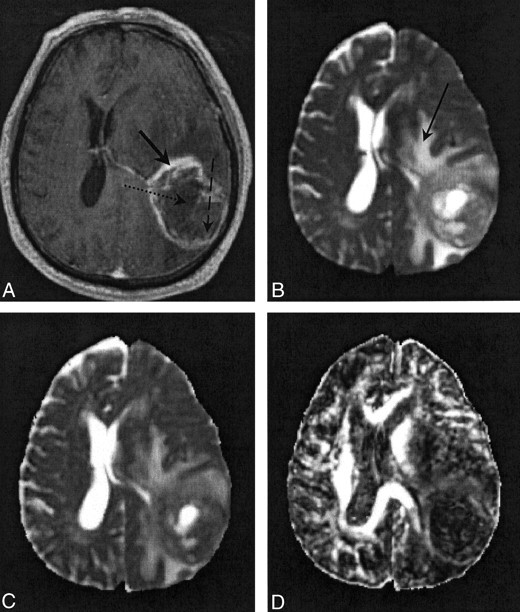
Images in patient 5.
A, Contrast-enhanced T1-weighted volume image. The solid arrow indicates a region of enhancing tumor margin; dashed arrow, enhancing tumor core; dotted arrow, nonenhancing tumor core.
B, T2-weighted EP images. Arrow indicates a region of edematous brain.
C and D, Note the high 〈D〉 and low FA values in the nonenhancing tumor core and edematous brain on the 〈D〉 parametric map (C) and FA parametric map (D).
Fig 3.
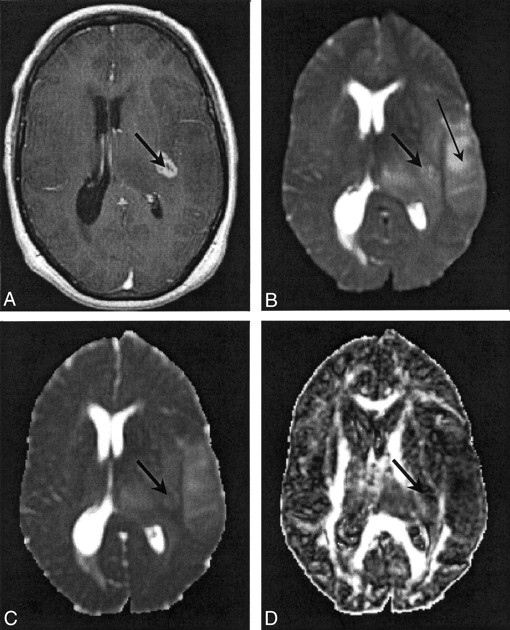
Images in patient 3. The thick arrow indicates a region of enhancing tumor margin; the thin arrow in B indicates edematous brain.
A, Contrast-enhanced T1-weighted volume image.
B, T2-weighted EP images.
C, 〈D〉 parametric map. Note the diffuse nature of the edema.
D, FA parametric map.
Tables 1 and 2 show 〈D〉 and FA values in the five tissue types identified on the contrast-enhanced T1-weighted volume and T2-weighted EP images in each patient. The general trend in Table 1 was that normal white matter tended to have the lowest 〈D〉 values, and the nonenhancing tumor core tended to have the highest values. Edematous brain had a higher 〈D〉 value than that of the enhancing tumor margin in all patients except patients 2 and 7. Table 2 shows that normal white matter had the highest FA values, and nonenhancing tumor core, the lowest. Such a clear-cut trend was not observed in the FA values in edematous brain and enhancing tumor margin. In patient 2, the relatively low value of 〈D〉 and high value of FA in regions of abnormal signal intensity on the T2-weighted EP images were probably due to the presence of low-grade tumor in the region of edematous brain.
TABLE 2:
TABLE 2: FA values in the neoplasm, surrounding edematous brain, and normal white matter in nine patients with high-grade glioma
| Patient | FA Value |
|||||
|---|---|---|---|---|---|---|
| Enhancing Tumor Margin | Enhancing Tumor Core | Nonenhancing Tumor Core | Edematous Brain | Normal White Matter |
||
| Ipsilateral | Contralateral | |||||
| 1* | 0.20 ± 0.06 | NA | NA | 0.21 ± 0.07 | 0.51 ± 0.02 | 0.42 ± 0.07 |
| 2*† | 0.22 ± 0.04 | NA | NA | 0.23 ± 0.08 | 0.50 ± 0.04 | 0.47 ± 0.11 |
| 3*‡ | 0.18 ± 0.06 | NA | NA | 0.17 ± 0.07 | NA | NA |
| 4 | 0.16 ± 0.07 | 0.10 ± 0.03 | 0.07 ± 0.01 | 0.14 ± 0.05 | 0.43 ± 0.10 | 0.48 ± 0.06 |
| 5 | 0.15 ± 0.05 | 0.14 ± 0.06 | 0.08 ± 0.02 | 0.18 ± 0.09 | 0.47 ± 0.07 | 0.52 ± 0.07 |
| 6 | 0.13 ± 0.03 | 0.08 ± 0.03 | 0.07 ± 0.01 | 0.15 ± 0.05 | 0.45 ± 0.09 | 0.51 ± 0.05 |
| 7 | 0.18 ± 0.05 | 0.15 ± 0.07 | 0.10 ± 0.03 | 0.25 ± 0.10 | 0.44 ± 0.10 | 0.46 ± 0.09 |
| 8 | 0.20 ± 0.05 | 0.14 ± 0.04 | NA | 0.15 ± 0.06 | 0.48 ± 0.08 | 0.48 ± 0.08 |
| 9§ | 0.18 ± 0.06 | 0.13 ± 0.05 | 0.10 ± 0.03 | 0.17 ± 0.06 | NA | 0.46 ± 0.02 |
| Mean | 0.16 ± 0.06 | 0.13 ± 0.06 | 0.09 ± 0.03 | 0.17 ± 0.08 | 0.46 ± 0.08 | 0.48 ± 0.08 |
Note.—All values are reported as the mean ± the standard deviation. Normal white matter was the centrum semiovale. NA indicates not applicable.
This patient had a multifocal glioma.
This patient had a low-grade glioma with a malignant core.
T2-weighted EP images depicted abnormal signal intensity throughout the ipsilateral and contralateral centrum semiovale.
T2-weighted EP images depicted abnormal signal intensity throughout the ipsilateral centrum semiovale.
Table 3 shows the results of an analysis of the differences in 〈D〉 and FA values in enhancing tumor margin, edematous brain, and ipsilateral white matter. The difference between the 〈D〉 values in the enhancing tumor margin and edematous brain was statistically significant in all nine patients. However, the difference between the equivalent FA values was statistically significant in only seven patients. In the seven patients in whom the ipsilateral centrum semiovale appeared to be normal, the difference between the 〈D〉 and FA values in the enhancing tumor margin, edematous brain, and ipsilateral white matter was statistically significant.
Discussion
The DT-MR imaging data presented indicate that normal white matter has lower 〈D〉 and higher FA values than those in tumor and edematous brain. Such a trend is consistent with an increase in the free water fraction (high 〈D〉 value) and loss of structural organization (reduced FA value) in the neoplasm and surrounding edematous brain. Furthermore, if these 〈D〉 and FA values predominantly reflect the properties of the interstitium (16, 17), then it might be expected that the decreased mobility of the extracellular water molecules in regions with a high cellularity would reduce 〈D〉 values and increase FA values, compared the values in with regions with a lower cell density. Such a trend was also seen in our presented data, in which the enhancing tumor rim had 〈D〉 values that were lower and FA values that were higher than those in the necrotic tumor core. In comparison, the heterogeneous middle region, which is likely to have a mixture of proliferating cells and areas of necrosis, had intermediate values.
Further analysis of the results showed that 〈D〉 values in the enhancing tumor rim in patients with multifocal glioma were significantly less than those in the solitary lesions, that is, 〈D〉 = (952.45 ± 62.45) × 10−6 mm2/s versus (1244.11 ± 201.49) × 10−6 mm2/s. Conversely, FA values in the enhancing tumor rim in patients with multifocal glioma were higher than in the other patients, that is, FA = 0.20 ± 0.06 versus 0.16 ± 0.06. Several reasons for this difference are possible. First, because the contrast-enhancing lesions in the three patients with multifocal gliomas were small, the inclusion of a few normal tissue voxels would have had a larger effect on the final measured diffusion parameters than it would have had in larger lesions. Second, the former disease process may have produced widespread pockets of tumor in which concentrations of proliferating cells are increased. Interestingly, the diffusion parameters in the associated edematous brain were also different. Edematous brain associated with the multifocal disease, excluding that in patient 2, had 〈D〉 and FA values that were lower and slightly higher, respectively, than those in edematous brain associated with a solitary lesion; that is, 〈D〉 values were (1187.78 ± 233.32) × 10−6 mm2/s versus (1508.84 ± 281.56) × 10−6 mm2/s, and FA values were 0.18 ± 0.07 versus 0.17 ± 0.08. These differences may be due to early multifocal disease that producing pockets of tumor in which no evidence of contrast enhancement is not yet present. In patient 3, T2-weighted images showed abnormal signal intensity throughout both hemispheres, but only a small localized area in the left hemisphere showed contrast enhancement. In the right hemisphere, deposits of tumor were likely present; these could have resulted in the edematous brain formation. Also, in other patients, regions of nonenhancing tumor may have been present in areas of edematous brain.
In the previous studies of the diffusion parameters of cerebral gliomas, the apparent diffusion coefficient (ADC) of water in edematous brain and tumor was significantly higher than that of normal brain (18–23). However, the differentiation of high-grade glioma from edema was not generally possible. Unfortunately, a number of these studies have notable methodologic limitations. First, Tien et al (18), Krabbe et al (20), and Stadnik et al (21) characterized water diffusivity by using diffusion gradients applied along just one gradient axis, typically that in the cephalocaudal direction. The rotationally invariant measure of water diffusion, 〈D〉, requires the collection of DW images for which diffusion gradients have been applied either simultaneously or sequentially along three orthogonal directions (24). Second, several of these groups investigate the diffusion properties of various different tumor types, instead of concentrating on properties in a single disease (20, 21, 23). This design has the undesirable effect of clouding potential differences between healthy tissue and diseased tissue. Third, in several of these studies (18–21), whether any intervention was performed prior to MR imaging is unclear; Castillo et al (22) and Kono et al (23) present data in patients with recurrent and/or residual tumors. Because the effect of previous surgical or adjuvant therapy on 〈D〉 values is not known, the interpretation of the diffusion parameters in patients who have received therapy is difficult. Finally, none of these investigators mention the use of steroids. Dexamethasone, the most frequently used steroid, is often part of the first-line treatment in patients with newly diagnosed brain tumors and peritumoral edema. However, dexamethasone can substantially reduce the 〈D〉 values in both tumor and edematous brain (25).
Therefore, highlighting why the differentiation of abnormal tissue from apparently normal tissue was possible in the current study is important. In our study, all of the patients examined had newly diagnosed high-grade gliomas, and they had not undergone any prior therapeutic intervention or steroid treatment. Therefore, the present results are not complicated by the presence of different tumor types or the effect of therapies that may alter the 〈D〉 and FA values. Furthermore, globally averaged diffusion parameters were obtained from the whole tumor and peritumorous brain, rather than from only single regions of interest or a range of regions from a single section (18–23). This approach helped to remove any subjective bias that may occur with sampling single regions.
Although our results indicated that the differentiation between high-grade glioma, peritumoral edematous, and normal brain may be possible, the current study does have three drawbacks. First, the number of patients examined was small. Second, although the tumor type was confirmed with histologic findings, samples were not obtained from the peritumoral region to confirm edematous brain. Third, only values in remote white matter (ie, centrum semiovale) were used to compare normal brain with abnormal brain. Although this approach did provide 〈D〉 and FA measurements that could be compared with values in the literature, in clinical practice, this method would be more useful in determining if local white matter can be differentiated from abnormal tissue. (The mean 〈D〉 and FA values in the contralateral centrum semiovale in Tables 1 and 2 are similar to those measured by O’Sullivan et al (14), ie, 〈D〉 = 750 ± 36 × 10−6 mm2/s, and Zelaya et al (15), ie, FA = 0.48 ± 0.06, in DT-MR imaging studies involving healthy volunteers.) Such an analysis might then allow the detection of tumor cell infiltration into peritumoral regions. Of all the previous investigators, only Tien et al (18) suggested that the differentiation between areas of peritumoral tumor cell infiltration from predominantly peritumoral edematous brain is possible. However, their methods were based on signal intensity changes on T2-weighted images, and subsequent analysis of their data reveals that ADC values cannot be used to differentiate between these tissues (23).
Finally, to determine whether the diffusion anisotropy information from the DT-MR imaging experiment aids tissue differentiation, differences between the 〈D〉 and FA values of enhancing tumor margins, peritumoral edematous brain, and normal brain were explored. Although 〈D〉 values differed significantly between the enhancing tumor margin and edematous brain in all cases, the FA values were significantly different in only seven of the nine patients. The 〈D〉 and FA values in these pathologic tissues were also significantly different from those of normal white matter in all cases in which they were measurable. In terms of tissue differentiation, this result suggests that DT-MR imaging had no obvious advantage over conventional DW-MR imaging. Further data are required to confirm this finding.
Conclusion
In this study, the diffusion parameters of high-grade gliomas were measured in a small cohort of treatment-naive patients by using DT-MR imaging. Values of 〈D〉 in apparently normal white matter, edematous brain, and enhancing tumor margins were significantly different. The diffusion anisotropy data added no benefit in tissue differentiation. Further studies are required to establish whether this imaging modality can be refined for use in the evaluation of tumor cell infiltration in the peritumoral region. Also, studies are needed to validate these findings with histologic sampling.
Acknowledgments
Thanks are due to Dr Paul Armitage for his careful reading of the manuscript.
Footnotes
This study was funded by the Cunningham Trust.
References
- 1.Legler JM, Ries LA, Smith MA, et al. Cancer surveillance series corrected: brain and other central nervous system cancers: recent trends in incidence and mortality. J Natl Cancer Inst 1999;91:1382–1390 [DOI] [PubMed] [Google Scholar]
- 2.Tovi M. MR imaging in cerebral gliomas analysis of tumour tissue components. Acta Radiol Suppl 1993;384:1–24 [PubMed] [Google Scholar]
- 3.Basser PJ, Mattiello J, LeBihan D. Estimation of the effective self-diffusion tensor from the NMR spin echo. J Magn Reson B 1994;103:247–254 [DOI] [PubMed] [Google Scholar]
- 4.Pierpaoli C, Basser PJ. Toward a quantitative assessment of diffusion anisotropy. Magn Reson Med 1996;36:893–906 [DOI] [PubMed] [Google Scholar]
- 5.Basser PJ, Pajevic S, Pierpaoli C, Duda J, Aldroubi A. In vivo fiber tractography using DT-MRI data. Magn Reson Med 2000;44:625–632 [DOI] [PubMed] [Google Scholar]
- 6.Wieshmann UC, Symms MR, Parker GJ, et al. Diffusion tensor imaging demonstrates deviation of fibres in normal appearing white matter adjacent to a brain tumour. J Neurol Neurosurg Psychiatry 2000;68:501–503 [DOI] [PMC free article] [PubMed] [Google Scholar]
- 7.Basser PJ, Pierpaoli C. A simplified method to measure the diffusion tensor from seven MR images. Magn Reson Med 1998;39:928–934 [DOI] [PubMed] [Google Scholar]
- 8.Mattiello J, Basser PJ, LeBihan D. The b matrix in diffusion tensor echo-planar imaging. Magn Reson Med 1997;37:292–300 [DOI] [PubMed] [Google Scholar]
- 9.Pierpaoli C, Basser PJ. Toward a quantitative assessment of diffusion anisotropy. Magn Reson Med 1996;36:893–906 [DOI] [PubMed] [Google Scholar]
- 10.Bastin ME, Armitage PA, Marshall I. A theoretical study of the effect of experimental noise on the measurement of anisotropy in diffusion imaging. Magn Reson Imag 1998;16:773–785 [DOI] [PubMed] [Google Scholar]
- 11.Haselgrove JC, Moore JR. Correction for distortion of echo-planar images used to calculate the apparent diffusion coefficient. Magn Reson Med 1996;36:960–964 [DOI] [PubMed] [Google Scholar]
- 12.Bastin ME, Armitage PA. On the use of water phantom images to calibrate and correct eddy current induced artefacts in MR diffusion tensor imaging. Magn Reson Imag 2000;18:681–687 [DOI] [PubMed] [Google Scholar]
- 13.Basser PJ, Pierpaoli C. Microstructural and physiological features of tissues elucidated by quantitative-diffusion-tensor MRI. J Magn Reson B 1996;111:209–219 [DOI] [PubMed] [Google Scholar]
- 14.O’Sullivan M, Summers PE, Jones DK, Jarosz JM, Williams SC, Markus HS. Normal-appearing white matter in ischemic leukoaraiosis: A diffusion tensor MRI study. Neurology 2001;57:2307–2310 [DOI] [PubMed] [Google Scholar]
- 15.Zelaya F, Flood N, Chalk JB, et al. An evaluation of the time dependence of the anisotropy of the water diffusion tensor in acute human ischemia. Magn Reson Imag 1999;17:331–348 [DOI] [PubMed] [Google Scholar]
- 16.Inglis BA, Bossart EL, Buckley DL, Wirth ED III, Mareci TH. Visualization of neural tissue water compartments using biexponential diffusion tensor MRI. Magn Reson Med 2001;45:580–587 [DOI] [PubMed] [Google Scholar]
- 17.Sugahara T, Korogi Y, Kochi M, et al. Usefulness of diffusion-weighted MRI with echo-planar technique in the evaluation of cellularity in gliomas. J Magn Reson Imag 1999;9:53–60 [DOI] [PubMed] [Google Scholar]
- 18.Tien RD, Felsberg GJ, Friedman H, Brown M, MacFall J. MR imaging of high-grade cerebral gliomas: value of diffusion-weighted echoplanar pulse sequences. AJR Am J Roentgenol 1994;162:671–677 [DOI] [PubMed] [Google Scholar]
- 19.Brunberg JA, Chenevert TL, McKeever PE, et al. In vivo MR determination of water diffusion coefficients and diffusion anisotropy: correlation with structural alteration in gliomas of the cerebral hemispheres. Am J Neuroradiol 1995;16:361–371 [PMC free article] [PubMed] [Google Scholar]
- 20.Krabbe K, Gideon P, Wagn P, Hansen U, Thomsen C, Madsen F. MR diffusion imaging of human intracranial tumours. Neuroradiology 1997;39:483–489 [DOI] [PubMed] [Google Scholar]
- 21.Stadnik TW, Chaskis C, Michotte A, et al. Diffusion-weighted MR imaging of intracerebral masses: comparison with conventional MR imaging and histologic findings. AJNR Am J Neuroradiol 2001;22:969–976 [PMC free article] [PubMed] [Google Scholar]
- 22.Castillo M, Smith JK, Kwock L, Wilber K. Apparent diffusion coefficients in the evaluation of high-grade cerebral gliomas. AJNR Am J Neuroradiol 2001;22:60–64 [PMC free article] [PubMed] [Google Scholar]
- 23.Kono K, Inoue Y, Nakayama K, et al. The role of diffusion-weighted imaging in patients with brain tumors. AJNR Am J Neuroradiol 2001;22:1081–1088 [PMC free article] [PubMed] [Google Scholar]
- 24.Ulug AM, Beauchamp N Jr, Bryan RN, van Zijl PC. Absolute quantitation of diffusion constants in human stroke. Stroke 1997;28:483–490 [DOI] [PubMed] [Google Scholar]
- 25.Bastin ME, Delgado M, Whittle IR, Cannon J, Wardlaw JM. The use of diffusion tensor imaging in quantifying the effect of dexamethasone on brain tumours. Neuroreport 1999. 14;10:1385–1391 [DOI] [PubMed] [Google Scholar]