

Abstract
BACKGROUND AND PURPOSE: Three-dimensional time-of-flight (TOF) MR angiography is used routinely in stroke workup to detect arterial occlusions, but a major drawback is its inadequate depiction of vessels with slow or in-plane flow. We hypothesized that the use of contrast-enhanced MR angiography improves delineation of vessels with diminished or absent flow on precontrast MR angiograms.
METHODS: Pre- and postcontrast 3D TOF MR angiograms were acquired in 55 consecutive patients with acute stroke. Patency of 480 intracranial vessels was assessed on both the pre- and postcontrast angiograms. Diffusion-weighted (DW) and perfusion-weighted (PW) imaging data were also obtained and results correlated with those of pre- and postcontrast MR angiography.
RESULTS: For 50 abnormal vessel segments seen on precontrast MR angiograms, postcontrast MR angiograms resulted in change in the vascular signal intensity in 70% (35 vessel segments); 94% of these changes showed a greater extent of vessel patency. Venous and soft-tissue contrast enhancement had no effect on assessment in 95% of all 480 vessels examined. Interobserver reliability was moderate, with postcontrast interpretation (κ = 0.48) showing a slight improvement over precontrast interpretation (κ = 0.41). Good agreement was found between the TOF results and the pooled DW and PW imaging results.
CONCLUSIONS: Compared with precontrast 3D TOF MR angiograms, postcontrast 3D TOF angiograms improve assessment of intracranial vessel patency in acutely ischemic vascular territories. In some patients, an improved understanding of acute ischemic stroke was obtained by viewing the pre- and postcontrast images. Postcontrast MR angiography should be included in the MR evaluation of acute stroke.
Three-dimensional time-of-flight (TOF) MR angiography can often help identify the causative arterial occlusion in acute ischemic stroke (<12 hours from onset). However, the major drawback of this method is inadequate depiction of vessels with slow or in-plane flow because of saturation of the MR signal (1) as seen in the distal intracranial branch vessels. The length and degree of intracranial vascular stenoses can also be overestimated due to complex flow patterns around stenoses (2). The use of paramagnetic extracellular contrast agents, such as gadopentetate dimeglumine, shortens the T1 relaxation time of blood and thereby increases the steady-state signal intensity of the blood above that of most stationary tissues (4). This achieves an improved contrast-to-noise ratio between blood and the surrounding tissue, thereby giving a clearer depiction of slow-moving blood in distal vessels, which are often difficult to identify on precontrast MR angiograms.
Several groups have explored the use of contrast material–enhanced MR angiography to help visualize and assess intracranial vascular disease (7–8). Jung et al (3) investigated the optimal dose of gadopentetate dimeglumine for visualizing intracranial vascular disease and showed that small vessels were better visualized on contrast-enhanced MR angiograms than on nonenhanced MR angiograms. In 17% of patients, the nonenhanced MR angiograms showed artifactual narrowing of internal carotid arteries (ICAs) or middle cerebral arteries (MCAs) that were normal on the contrast-enhanced MR angiograms. In a clinical study of patients with intracranial vascular lesions, such as vascular malformations and large aneurysms, Yano et al (4) found that postcontrast visualization of distal MCA branches improved in 69.7% of cases and 30.3% of the branches became visible only after administration of contrast material. Parker et al (5) demonstrated a significant increase in the number of visible vessels and an improved appearance of vascular anatomy and lesions on contrast-enhanced images of intracranial aneurysms. Mathews et al (6) examined the effect of contrast enhancement and magnetization transfer on intracranial MR angiograms and found a synergistic improvement in visualization. Isoda et al (7) recently evaluated a triggered contrast-enhanced MR angiographic technique in which images are acquired immediately after the arrival of the contrast bolus to avoid venous overlap.
To date, to our knowledge, no study has been performed to specifically investigate the efficacy of using postcontrast 3D TOF MR angiography in the assessment of vascular occlusions in acute ischemic stroke. In this clinical role, it is important to distinguish between vessels that are occluded and those that have only slow flow, because the prognosis and potential therapies are different for these two scenarios. The purpose of this study, therefore, was to examine the role of postcontrast MR angiography in the assessment of intracranial branch vessel occlusions in patients with acute stroke. Specifically, we were interested in vessels that appeared to be abnormal on precontrast 3D TOF MR angiograms. It was our hypothesis that postcontrast 3D TOF MR angiography improves visualization of these vessels and their distal branches.
Methods
A prospective two-arm cross-sectional study was performed to obtain 3D TOF MR angiograms in patients with acute stroke who were undergoing MR imaging. Fifty-five consecutive patients with acute stroke were entered into the study. All patients were imaged within 14 hours of stroke onset. Written informed consent was provided by all patients or their surrogate before imaging. National Institutes of Health Stroke Scale (NIHSS) (9) scores were obtained from each patient at entry (baseline NIHSS score) and 24 hours after symptom onset (24-hour NIHSS score). Selected patients received intravenous thrombolysis (tissue-type plasminogen activator [tPA]) as per standard protocol (9, 10). In all cases, tPA treatment was begun before MR imaging.
MR Imaging
MR studies were performed with a 3-T MR imager (Signa; GE Medical Systems, Waukesha, WI) equipped with high-speed gradients (40-mT/m peak strength, 184-μ rise time). All imaging was performed with use of a standard quadrature head coil. Our typical acute stroke imaging protocol includes standard anatomic imaging, diffusion-weighted (DW) imaging, 3D TOF MR angiography, and bolus-tracking perfusion-weighted (PW) imaging (11).
DW imaging was performed with a single-shot spin-echo echo-planar imaging technique with a diffusion sensitivity of b = 1000 s/mm2, 7000/96 (TR/TE), 19 5-mm sections with 2-mm gap, 32 × 19-cm field-of-view (FOV), and a 192 × 192 acquisition matrix reconstructed to a 256 × 256 matrix. PW imaging used a single-shot gradient-echo echo-planar sequence with 2200/25, 10 6-mm sections with a 3-mm gap, 32 × 19-cm FOV, and a 192 × 192 acquisition matrix reconstructed to a 256 × 256 matrix. Five hundred ten images were collected over 112 seconds during the intravenous administration of a 20-mL bolus of gadopentetate dimeglumine (Magnevist; Berlex, Wayne, NJ) injected at 5 mL/s.
The imaging parameters for the conventional two-slab 3D TOF sequence were 24/3.3/15° (TR/TE/flip angle), acquisition bandwidth of 12.5 kHz, and a 240 × 144 × 46-mm acquired volume with a 256 × 192 × 42 matrix, which was then reconstructed to a 512 × 512 × 84 matrix. Total acquisition time was 2 minutes 48 seconds. Axial slabs were prescribed from approximately the level of the skull base to the circle of Willis (Fig 1A). Postcontrast MR angiography focused on visualizing the intracranial circulation and therefore the 2precontrast technique was modified. First, an inclined slab (Fig 1B) was used to image the intracranial vasculature including the distal ICA and the proximal vessels of the circle of Willis. Second, to maximize vessel signal intensity on postcontrast images, the TR and flip angle were increased (5). Postcontrast MR angiographic parameters were as follows: 32/3.4/35°, acquisition bandwidth of 12.5 kHz, and a 240 × 144 × 36-mm acquired volume with a 256 × 192 × 40 matrix, which was then reconstructed to a 512 × 512 × 80 matrix. Total acquisition time was 4 minutes 9 seconds.
Fig 1.

Acquisition geometry for precontrast (A) and postcontrast (B, C) 3D TOF MR angiography.
A, Two-slab acquisition used to cover the distal extracranial vessels as well as the intracranial circulation (dashed line indicates slab boundary).
B and C, Oblique-axial slabs used to image the intracranial circulation. Slab placement in C was optimal as it excludes the cavernous sinus and thus avoids venous enhancement (dotted line indicates slab position). Effective placement in C can be obtained by projection through only a subset of the sections acquired in B.
Blinded Review
For both the pre- and postcontrast examinations, the collapsed maximum intensity projection and source images were filmed. The MR angiograms were then separated into precontrast and postcontrast groups, and the order of each patient within each group was randomized. Five blinded observers (two neuroradiologists [M.E.H., W.F.M.] and three stroke neurologists [P.A.B., A.M.D., M.D.H.]) graded the images. Each observer was first presented with the precontrast images. The postcontrast images were presented a minimum of 1 week later. Each observer graded the vascular signal intensity in the following extra- and intracranial vessels: left and right ICA, basilar artery (BA), both anterior cerebral arteries (ACAs), left and right M1 segments and the M2 regions of the MCA, and left and right P1-P2 segments and P3 regions from the posterior cerebral artery (PCA) (Fig 2). The vascular signal rating scale for flow in a segment or region was 0 for normal, 1 for diminished, or 2 for absent flow. Observers could also grade a segment or region as not readable (NR). On the postcontrast images, the observers were asked to grade the impact of contrast enhancement on the arterial segments from accumulated contrast material in the venous and soft-tissue structures. The impact of contrast enhancement rating scale was 0 for no effect, 1 for adverse effect but tolerable, and 2 for nondiagnostic.
Fig 2.

Schematic illustrates labeling of vessel segments and regions report on in this study. ACA indicates anterior cerebral artery region; BA, basilar artery; ICA, internal carotid artery; M1, M1 segment of the MCA; M2, M2 segment of the MCA; P1, P1 segment of the PCA; P2, P2 segment of the PCA; P3, P3 segment of the PCA. For grading purposes, ACA, M2, and P3 were segment regions, and the P1 and P2 segments were scored together and denoted by P1-P2.
Data and Statistical Analysis
Left and right vessels were pooled. The interobserver reliability over five observers was assessed by using the κ statistic. Intraobserver reliability was not assessed. Grade changes between pre- and postcontrast images were calculated with use of the median score of the five observers; thus, the reported grade changes are the difference of medians. Where groups were compared, continuous variables were assessed with the Student t test, with adjustment for unequal variances where indicated. Proportions were compared with the Fisher exact test. The level of statistical confidence was P < .05. All mean values are reported plus or minus one standard deviation.
Results
Patient Demographics
Fifty-five consecutive patients (40 men, 15 women; mean age, 66.4 ± 16.1 years; age range, 26–91 years) underwent acute stroke imaging over the 8-month duration of the study. In this group, the mean stroke onset to MR image delay was 4.2 hours ± 2.1. Twenty-two patients were imaged within 3 hours of onset; 23 patients, between 3 and 6 hours of onset; and the remaining 10, between 6 and 14 hours of onset. Median baseline and 24-hour NIHSS scores were 9 and 4, respectively. Table 1 summarizes other relevant information in this patient group.
TABLE 1:
Patient demographics for all patients and for the tPA-treated subgroup
| Variable | All Patients(n = 55) | Treated Patients Only(n = 22) |
|---|---|---|
| Age (y) | ||
| Mean ± SD | 66.4 ± 16.1 | 67.9 ± 17.9 |
| Range | 26–91 | 31–91 |
| Sex (M:F) | 41:15 | 14:8 |
| No. treated with tPA | 22 | 22 |
| Onset-to-imaging time (h) | ||
| Mean ± SD | 4.2 ±2.1 | 3.7 ±1.3 |
| Range | 1.5–13.5 | 1.5–6.8 |
| Pre- to postcontrast imaging interval (min) | ||
| Mean ± SD | 26.3 ±7.1 | 27.1 ±6.6 |
| Range | 8–53 | 18–44 |
| NIHSS score at baseline | ||
| Median (50% range) | 9(4–15) | 12.5(9–16) |
| Range | 0–28 | 2–28 |
| NIHSS score at 24 hours | ||
| Median (50% range) | 4(2–9) | 8(4.5–10.75) |
| Range | 0–28 | 0–26 |
Twenty-two patients received tPA therapy. The demographics in the treated subgroup were not significantly different (14 men, eight women; mean age, 67.9 ± 17.9 years; age range, 31–91 years; P > .05) than that of the overall group. Symptom onset to MR imaging time was shorter (3.7 hours ± 1.3) than that of the overall group as would be expected owing to the 3-hour postonset time window for intravenous tPA administration (9, 10); however, this difference was not statistically significant (P > .05). Median NIHSS scores in the treated group at baseline and 24 hours were 12.5 and 8, respectively.
In all 55 patients, postcontrast MR angiograms were obtained 26.3 minutes ± 7.1 after the precontrast angiogram. It was necessary to exclude data from 15 of the 55 examinations because of poor image quality resulting from technical failure of the imager (three cases), severe patient motion (12 cases), and/or improper slab placement in either the pre- or postcontrast images (four cases). MR angiograms obtained from the remaining 40 patients were assessed. A total of 480 segments or regions were graded by each of the five observers. All 40 patients had satisfactory DW images. Among the 40 evaluated MR angiograms, the PW images were uninterpretable in six cases.
Comparison with DW and PW Imaging
Comparison of the DW and PW imaging results with the MR anagiographic results for each patient is shown in Table 2, and agreement of DW and PW imaging with MR angiography is summarized in Table 3. Left hemisphere infarcts represented 52% (21 of 40) of strokes, with 50% (20 of 40) occurring in the left anterior circulation. Right anterior circulation strokes accounted for 28% (11 of 40). Four patients had posterior circulation strokes (10%), and two patients had whole hemisphere involvement (5%). Five patients (12%) had no DW or PW imaging indications for stroke and no abnormal vessels on TOF MR angiograms. In 30 (75%) of the 40 patients, the DW and PW imaging findings were consistent with the vascular abnormalities seen on the TOF images (Table 2, with examples in Figs 3 and 4). Of the patients with inconsistent findings, nine patients had DW and PW imaging changes without apparent vascular occlusions on either the pre- or postcontrast TOF images. One patient had an occlusive lesion without any associated DW or PW imaging changes.
TABLE 2:
Comparison of DW imaging, PW imaging, and MR angiographic results*
| Patient No. | DW Changes | PW Changes | Precontrast TOF Changes | Postcontrast TOF Changes |
|---|---|---|---|---|
| 1 | L ACA, R MCA | R MCA | R ICA, R M1, R M2 | R ICA, R M1, R M2 |
| 2 | BA | L MCA | L M1, L M2, L P3 | L M1, L M2, L P1–P2 |
| 3 | R MCA | R MCA | R M2 | – |
| 4 | L MCA | L MCA | – | – |
| 5 | L MCA | NA | L M2 | L M1, L M2, L P1–P2 |
| 6 | L VA | – | – | – |
| 7 | L ICA | L ICA | L ICA | L ICA, L M2 |
| 8 | L MCA | L MCA | – | – |
| 9 | L MCA | L MCA | ACA, L M1, L M2, R M2 | L M1, L P1–P2 |
| 10 | R MCA | R MCA | R M1, R M2, R P1–P2, R P3 | – |
| 11 | R MCA | R MCA | R M1, R M2 | R M1, R M2 |
| 12 | L MCA | L MCA | – | L M2, L P1–P2 |
| 13 | R PCA, L MCA | – | RP3 | – |
| 14 | R ACA | – | – | – |
| 15 | R MCA | – | – | R M2 |
| 16 | L MCA | L MCA | L M2 | L M2, L P1–P2 |
| 17 | – | – | L M2 | – |
| 18 | – | R MCA | R ICA, R M1, R M2 | – |
| 19 | – | – | – | – |
| 20 | L MCA | – | – | – |
| 21 | L MCA | L MCA | L ICA, L M1, L M2 | L ICA, L M1, L M2, L P1–P2 |
| 22 | L MCA | L MCA | L ICA, L M1, L M2 | L M1, L M2, L P1-P2 |
| 23 | L MCA | NA | L ICA, L M1, L M2 | L M2 |
| 24 | L MCA | L MCA | – | – |
| 25 | L MCA | L MCA | – | – |
| 26 | L MCA | NA | – | – |
| 27 | R MCA | R MCA | R ICA, R M1, R M2 | R ICA, R M1, R M2 |
| 28 | – | – | – | – |
| 29 | R PCA | NA | R P1–P2, R P3 | – |
| 30 | R MCA | R MCA | R M2 | R M1, R M2 |
| 31 | L MCA | – | – | – |
| 32 | L MCA | L MCA | L M1, L M2 | – |
| 33 | – | – | – | – |
| 34 | R MCA | R MCA | R M1, R M2 | R M1, R M2 |
| 35 | R PCA | R PCA | – | – |
| 36 | R PCA, R MCA | NA | R ICA, R M1, R M2, R P3 | R M1, R M2 |
| 37 | – | – | – | – |
| 38 | – | – | – | – |
| 39 | L MCA | L MCA | – | – |
| 40 | L MCA | NA | L M1, L M2 | L M1, L M2, L P1–LP2 |
Note.—L indicates left; NA, not available; R, right; VA, vertebral artery; -, no visible changes.
Abnormalities related to acute ischemic stroke are listed by the vascular territories they affect (see Fig 2 for labeling convention).
TABLE 3:
Agreement between combined DW and PW imaging and combined pre- and postcontrast 3D TOF MR angiography in identifying vascular territories with infarction
| Agreement | Left |
Right |
|||||
|---|---|---|---|---|---|---|---|
| Both | Anterior | Posterior | Both | Anterior | Posterior | None | |
| Overall | 1 | 19 | 1 | 1 | 10 | 3 | 5 |
| DWI-PWI and TOF agree | 1 | 10 | 1 | 1 | 10 | 2 | 5 |
| DWI-PWI and TOF disagree | 9 | 1 | |||||
| DWI-PWI changes but no TOF changes | 8 | 1 | |||||
| No DWI-PWI changes but TOF changes | 1 | ||||||
Note.—Anterior circulation infarcts include ICA, ACA, and MCA vessels; posterior circulation infarcts include vertebral artery, BA, and PCA vessels.
Fig 3.
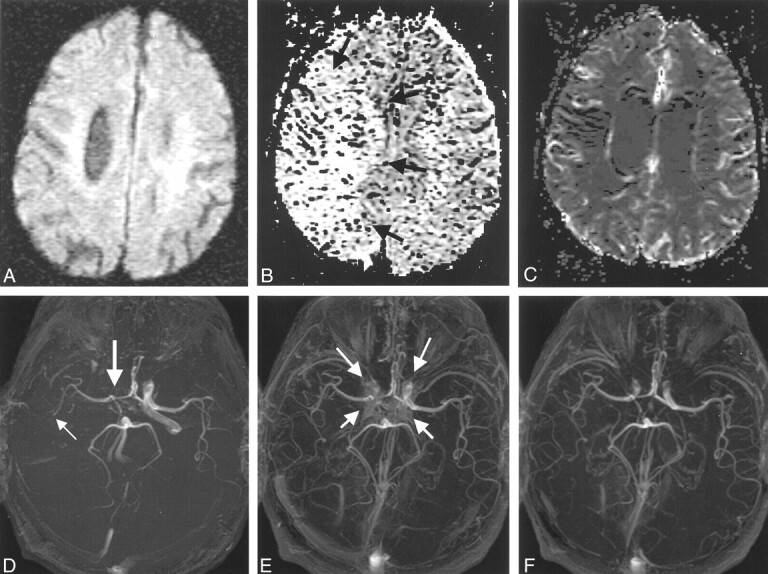
Images in a 78-year-old man with changes in the right anterior circulation.
A, Normal DW image.
B, Relative mean transit time map shows a region of delayed flow in the right hemisphere (arrows), which was consistent with the findings on the pre- and postconrast MR angiograms (D–F).
C, Normal relative cerebral blood volume map.
D, Precontrast 3D TOF MR angiogram suggests a diminished right ICA (thick arrow) and M1 and an occluded right M2 branch (thin arrow).
E and F, Postcontrast 3D TOF MR angiograms show improved depiction of the right ICA and the M1 and M2 MCA. Some contrast enhancement from the cavernous sinus is evident (arrows in E); however, this problem can be removed by changing the position of the slab. Slab positions for images D–F correspond to Fig 1B and C.
Fig 4.

Images in a 75-year-old woman treated with intravenous tPA 2.7 hours after stroke onset. MR imaging commenced 4.1 hours after onset.
A–C, DW image (A) shows diffusion changes (arrow in A) and PW images (B and C) show relative mean-transit time defects (arrow in B) and relative cerebral blood volume defects (arrow in C).
D, Precontrast TOF MR angiogram suggests a diminished left MCA, which is consistent with the DW and PW imaging findings. Also, the right M1 and M2 appear diminished.
E, Postcontrast TOF MR angiogram confirms the left MCA changes, but the right M1 and M2 appear occluded (arrow). Postcontrast findings suggest that the right MCA territory is also at risk.
Interobserver Reliability
Interobserver agreement for vascular signal grade over all arterial segments was in the moderate to good agreement range (Table 4) (15). Agreement between individual pairs of observers varied from κ scores of 0.33 to 0.61 and 0.30 to 0.54 for the pre- and postcontrast assessments, respectively. Mean agreement over all five observers was slightly improved for the postcontrast images (κ = 0.48) versus the precontrast images (κ = 0.41). Interobserver agreement for impact of contrast enhancement grade was very poor (overall κ = 0.08, pair-wise observer κ ranging from 0.00 to 0.34).
TABLE 4:
κ Scores for all pair-wise combinations of observers for all vessels combined
| Pair-Wise κ Scores |
|||||
|---|---|---|---|---|---|
| Observer 1 | Observer 2 | Observer 3 | Observer 4 | Observer 5 | |
| Vascular Signal: Precontrast Assessment |
|||||
| Observer 1 | 1.00 | 0.44 | 0.36 | 0.46 | 0.33 |
| Observer 2 | 1.00 | 0.42 | 0.61 | 0.49 | |
| Observer 3 | 1.00 | 0.54 | 0.44 | ||
| Observer 4 | 1.00 | 0.57 | |||
| Observer 5 | 1.00 | ||||
|
Vascular Signal: Postcontrast Assessment |
|||||
| Observer 1 | 1.00 | 0.39 | 0.44 | 0.48 | 0.44 |
| Observer 2 | 1.00 | 0.30 | 0.35 | 0.41 | |
| Observer 3 | 1.00 | 0.41 | 0.39 | ||
| Observer 4 | 1.00 | 0.54 | |||
| Observer 5 | 1.00 | ||||
|
Impact of Contrast Enhancement |
|||||
| Observer 1 | 1.00 | 0.03 | 0.04 | 0.34 | 0.05 |
| Observer 2 | 1.00 | 0.03 | 0.00 | 0.21 | |
| Observer 3 | 1.00 | 0.00 | 0.01 | ||
| Observer 4 | 1.00 | 0.14 | |||
| Observer 5 | 1.00 | ||||
Note.—Overall agreement for vascular signal grade at precontrast assessment was 0.41, for vascular signal grade at postcontrast assessment was 0.48, and for impact of contrast enhancement grades was 0.08.
Vascular Signal Grade
Median grades assigned by the five reviewers are summarized in Table 5. In over 89% of cases, the median vascular signal grades reflected a normal-appearing vessel segment or region. Slightly more vessels were graded as normal on the postcontrast (90.8%) than on the precontrast (89.6%) MR angiograms. Of the remaining vessels, 4.8% (precontrast) and 6.7% (postcontrast) showed diminished flow, and 5.4% (precontrast) and 2.5% (postcontrast) were found to be occluded.
TABLE 5:
Grading summary for all vessels examined
| Grade | Vascular Signal* |
Impact of Contrast Enhancement† |
||||
|---|---|---|---|---|---|---|
| Precontrast Images |
Postcontrast Images |
Postcontrast Images |
||||
| Frequency | Percentage | Frequency | Percentage | Frequency | Percentage | |
| 0 | 430 | 89.6 | 436 | 90.8 | 455 | 94.8 |
| 1 | 23 | 4.8 | 32 | 6.7 | 16 | 3.3 |
| 2 | 26 | 5.4 | 12 | 2.5 | 9 | 1.9 |
| NR | 1 | 0.2 | 0 | 0.0 | — | — |
| Total | 480 | 100 | 480 | 100 | 480 | 100 |
Note.—Data are for median grades across all five observers.
Vascular signal grade 0 indicates normal segment or region; 1, diminished flow; 2, absent flow; and NR, not readable.
Impact of contrast enhancement grade 0 indicates no effect; 1, adverse effect but tolerable; 2, nondiagnostic.
The change in the median vascular signal grades before and after contrast administration (Table 6) showed that in most vessel segments or regions the pre- and postcontrast assessments were the same (429 [89.4%] of 480 vessels). The pre- and postcontrast median assessments differed by one or two grades in 8.5% (41 of 480) and 1.8% (nine of 480) of the vessels, respectively. A total of 51 segments had different assessments on the pre- and postcontrast angiograms. One M2 segment was judged to be not readable on the precontrast study. The M1 (nine of 51) and M2 (17 of 51) segments of the MCA accounted for 51% (26 of 51) of the discrepancies between pre- and postcontrast assessments. The P1-P2 segment and the ICA accounted for 22% (11 of 51) and 16% (eight of 51) of the change in assessments, respectively.
TABLE 6:
Change between postcontrast and precontrast vascular signal grades in all segments and regions
| Vascular Signal Grade Change | Frequency |
|||||||
|---|---|---|---|---|---|---|---|---|
| BA | ACA | ICA | M1 | M2 | P1–P2 | P3 | Total | |
| All Vessels |
||||||||
| NR to readable | 0 | 0 | 0 | 0 | 1 | 0 | 0 | 1 |
| Two-grade increase | 0 | 1 | 2 | 0 | 2 | 0 | 2 | 7 |
| One-grade increase | 0 | 0 | 6 | 4 | 10 | 2 | 3 | 25 |
| No change | 40 | 39 | 72 | 71 | 63 | 69 | 75 | 429 |
| One-grade decrease | 0 | 0 | 0 | 4 | 4 | 8 | 0 | 16 |
| Two-grade decrease | 0 | 0 | 0 | 1 | 0 | 1 | 0 | 2 |
| Total | 40 | 40 | 80 | 80 | 80 | 80 | 80 | 480 |
|
Only Abnormal Vessels on the Precontrast Angiograms |
||||||||
| NR to readable | 0 | 0 | 0 | 0 | 1 | 0 | 0 | 1 |
| Two-grade increase | 0 | 1 | 2 | 0 | 2 | 0 | 2 | 7 |
| One-grade increase | 0 | 0 | 6 | 4 | 10 | 2 | 3 | 25 |
| No change | 0 | 0 | 0 | 8 | 7 | 0 | 0 | 15 |
| One-grade decrease | 0 | 0 | 0 | 2 | 0 | 0 | 0 | 2 |
| Two-grade decrease | 0 | 0 | 0 | 0 | 0 | 0 | 0 | 0 |
| Total | 0 | 1 | 8 | 14 | 20 | 2 | 5 | 50 |
The change in median vascular signal grade was recalculated for only those vessels or territories considered abnormal on the precontrast MR angiograms (Table 6). Fifty vessels in 22 patients were judged to be abnormal on precontrast angiograms. Of these vessels, 15 (30%) did not change grades between the pre- and postcontrast angiograms. However, 35 (70%) of the grades did change, and in 33 (94%) of these cases the changes indicated increased patency (32 cases) or improved readability (one case) on the postcontrast angiogram. Figures 3 and 5 show two examples in which the precontrast MR angiogram indicated an occluded vessel segment that on the postcontrast MR angiogram was shown to be patent. In two (6%) of these 35 cases, patency of the segment on the postcontrast MR angiogram was judged to be diminished. Figure 4 shows one example in which the right MCA on the postcontrast MR angiogram was graded as occluded but was scored as dimminshed on the precontrast MR angiogram.
Fig 5.

Images in a 91-year-old man treated with intravenous tPA at 2.9 hours after stroke onset. MR imaging commenced 5.5 hours after onset.
A, DW image shows an infarct (arrow).
B, Precontrast TOF MR angiogram appears to indicate a diminished left M1 and an occluded left M2 MCA (thick arrow). The ACA (thin arrow) appears occluded.
C, Postcontrast TOF MR angiogram shows the ACA segment is normal (thin arrow), the left M1 is occluded (thick arrow), and the left M2 is diminished.
In terms of the distribution of the abnormal vessels on precontrast MR angiograms, the majority of these vessels (41 of 50) were in the MCA and PCA territories, with the more distal and smaller caliber vessels in the M2 regions producing 20 (40%) of the 50 abnormal vessels. Nineteen (38%) MCA vessels underwent change in their score with the addition of contrast material (six in the M1 and 13 in the M2 segments). In the MCA territory, 32 (94%) of 34 vessels remained the same or showed greater patency on the postcontrast MR angiograms. Only two (both M1 segments [4%]) of the 50 abnormal vessels had a decreased vascular signal grade. The next most prevalent abnormal vessels were the ICA (eight of the 50 abnormal vessels) and the PCA segments (P1-P2 and P3, seven of 50). Graded vascular signal remained the same or increased in all ICA and PCA vessels found to be abnormal on the precontrast examination.
Among the 22 patients with the 50 abnormal vessels on the precontrast MR angiograms, the delay from precontrast TOF to postcontrast TOF was 27.1 minutes ± 6.2 . There was a relationship between this time and any change in vessel score (P < .05), but the magnitude of this change was small (odds ratio = 1.1 per minute delay). Between patients who were and those who were not treated with intravenous thrombolysis, no difference in the interval TOF times was observed and there was no difference between the proportions of images that showed a change in the vessel score (P > .05).
Although the focus of this study was on vessels that appeared abnormal on the precontrast MR angiogram, a small number of vessels (16 [3%] of 480) appeared normal without contrast material enhancement but were found to be either diminished (14 vessels) or occluded (two vessels) on the postcontrast images. Of these vessels, three were MCAs (including one vessel that was occluded on the postcontrast MR angiogram), four were ICAs, and nine were PCAs (including one vessel that was occluded on the postcontrast MR angiogram).
Impact of Enhancement
Tables 5 and 7 summarize the impact of contrast enhancement grades. Median impact grades indicated that in 455 (94.8%) of 480 vessels there was no detrimental effect (Table 5). In 3.3% (16 cases) and 1.9% (nine cases), the effect was judged to be adverse but tolerable and nondiagnostic, respectively. The ICA and M1 segments were most affected by accumulated contrast (18 [72%] of 25 affected vessels, Table 7). The poor interobserver agreement for impact grades (overall κ = 0.08, Table 4), however, maked a more detailed examination of the correlation versus vascular signal changes unwarranted.
TABLE 7:
Impact of contrast enhancement in all segments and regions for all vessels and for only abnormal vessels
| Impact of Contrast Enhancement Grade Change | Frequency |
|||||||
|---|---|---|---|---|---|---|---|---|
| BA | ACA | ICA | M1 | M2 | P1/P2 | P3 | Total | |
| All Vessels |
||||||||
| No effect | 40 | 39 | 71 | 71 | 76 | 79 | 79 | 455 |
| Adverse effect but tolerable | 0 | 0 | 5 | 6 | 3 | 1 | 1 | 16 |
| Nondiagnostic | 0 | 1 | 4 | 3 | 1 | 0 | 0 | 9 |
| Total | 40 | 40 | 80 | 80 | 80 | 80 | 80 | 480 |
|
Only Abnormal Vessels on Precontrast MR Angiograms |
||||||||
| No effect | 0 | 0 | 4 | 13 | 17 | 2 | 5 | 41 |
| Adverse effect but tolerable | 0 | 1 | 3 | 1 | 3 | 0 | 0 | 8 |
| Nondiagnostic | 0 | 0 | 1 | 0 | 0 | 0 | 0 | 1 |
| Total | 0 | 1 | 8 | 14 | 20 | 2 | 5 | 50 |
Discussion
We assessed the value of postcontrast MR angiography in delineating patency of distal intracranial vessels in acute stroke. In terms of vascular signal grades, most vessels were scored as being normal on both the pre- and postcontrast MR angiograms. This was expected, as acute ischemia usually involves a single vascular territory. The abnormal grades (ie, diminished flow or occluded vessel) were slightly more prevalent on the precontrast than on the postcontrast MR angiograms (10.7% versus 9.2%). This decrease in abnormality is due to reduced effects of saturation or disturbed flow on nonenhanced TOF MR angiograms (1) that is reduced by the MR contrast agent (3–7).
As expected, 89% (429 of 480 vessels) of the time there was agreement between the pre- and postcontrast vascular signal grades. Of the remaining 11% of vessels, 7% showed increased patency on the postcontrast MR angiogram, and 4% showed increased patency on the precontrast MR angiogram. This change in the proportion of normal vessels indicates that imaging after administration of contrast material makes a difference when evaluating vessel patency. Increased patency on the postcontrast MR angiogram (33 vessels or segments) is likely due to the increased vascular signal intensity due to T1 shortening compensating for slow and/or in-plane flow. The smaller number of vessels (n = 18) with reduced patency on the postcontrast MR angiograms is probably due to the improved delineation of the vessel causing a vessel judged normal on precontrast MR angiograms to be graded as diminished on the postcontrast MR angiogram. It may also be due to progressive thrombosis in the 26.3-minute precontrast-to-postcontrast time interval.
Fifty abnormal vessel segments on precontrast images (50 [10%] of 480) were identified and compared on the postcontrast images. The low number of abnormal vessels and their concentration in the anterior circulation (ICA and MCA, 42 of 50 vessels) is consistent with the epidemiology of ischemic stroke in that 80–90% of all ischemic strokes involve the anterior circulation. In 15 (30%) of these vessels, administration of contrast material did not alter the vascular signal grade. The administration of contrast material, however, did change the vascular signal grade in 35 (70%) of the 50 abnormal vessels on precontrast MR angiograms. Nineteen of the 35 vessels with a changed score were in the MCA region (six M1 and 13 M2 segments). Except for two of the M1 segments (Fig 5), all other segment grades indicated improved patency on the postcontrast MR angiograms (33 [94%] of 35), and more specifically, at least seven (20%) of 35 vessels initially graded as occluded were subsequently found to be patent (ie, an increase of 2 in vascular signal grade). These observations are important since 66% (33 of 50) of the postcontrast angiograms will indicate a more patent vessel, and this may alter treatment decisions. According to these data, it would be advantageous to include postcontrast MR angiography as part of the acute stroke workup to provide an improved anatomic picture.
The relevance of the observation that 16 (3.3%) of the 480 vessels became less patent on postcontrast MR angiograms is unclear, but may relate at least in part to anatomic variations in vessel size that become more conspicuous after enhancement. This would appear to be supported by the finding that eight of 16 such vessels occurred in the P1-P2 segments, a vascular region commonly characterized by hypoplastic or absent P1 segments.
The fact that postcontrast improvement in interobserver reliability for vascular signal grade was small, in spite of less saturation of the blood signal, may be due to a number of factors. First, the enhancement of tissue and venous structures after contrast administration is a known confounding effect (17). For example, venous enhancement in the cavernous sinus can obscure the visibility of the ICAs, making some observers reluctant to call the ICA normal even when they suspected it was, while others may have felt confident about giving a normal grade. Previous efforts at dynamic imaging of the contrast agent during its first passage have successfully imaged the arterial phase of the contrast agent; however, these techniques require implicit or explicit synchronization of imaging with contrast arrival (18, 19). Specifically, in the intracranial vessels, the large volume coverage required is not conducive to slab acquisitions, and thus these images tend to be of lower spatial resolution (7).
The second factor affecting interobserver reliability of vascular signal grade is that acquiring an MR angiogram after administration of contrast material in patients with acute stroke is a relatively recent development, and some observers may not have felt completely comfortable with the amount of vascular details, both arterial and venous, that postcontrast MR angiography is able to offer. This could have also produced a variation in the grades given. One way to minimize this variability would be to train the observers. In spite of these sources of variation, our results are in keeping with those in a study by Raaymakers et al (13) who found that the most important reason for the poor agreement is the difference in diagnostic analysis strategies employed by the individual observers.
Most vessels (94.8%) were not adversely affected by contrast material accumulation in the venous structures or tissue. An adverse but tolerable effect was observed in 3.3% of the vessels, and in only 1.9% of vessels was the angiogram nondiagnostic for a specific segment. In most cases (18 of 25 affected vessels), the problem was with venous enhancement from the cavernous sinus adversely affecting the ICA or the M1 segment. In this study, we attempted to minimize this effect by oblique placement of the slab volume, so as to exclude the cavernous sinus while not compromising visibility of the proximal ICA and MCA. In some studies, in which the oblique slab was placed too inferiorly, it would be possible to retrospectively remove the cavernous sinus and other enhancing structures by performing a projection through only some of the data (Fig 1C). This strategy, however, was not adopted in this study, although it would have improved the clarity of vascular detail in some patient examinations (Fig 3B vs 3C). The low κ value for the interobserver agreement with regards to impact of enhancement can be attributed to the lack of experience with contrast-enhanced MR angiography and the amount of details that contrast is able to offer. It may also reflect the fundamentally subjective criteria used to assess whether an image is diagnostic or not.
Because patients with acute stroke were studied, the precontrast TOF imaging protocols needed conform to our standard clinical imaging protocol, which meant that images be acquired in minimum time. In particular, the precontrast 3D TOF sequence was allocated about 3 minutes of the 15-minute acute-stroke protocol. The parameters used in the precontrast study represent the optimal technique for achieving coverage from skull base through the circle of Willis, with high resolution and high vessel contrast within this time interval. Postcontrast TOF MR angiography was performed in addition to and after completion of our clinical acute-stroke protocol. Therefore, there was more flexibility in determining the technique parameters and total acquisition time. For this reason, total acquisition time of postcontrast TOF MR angiography was increased to 4 minutes 9 seconds. Following from the results of previous studies (5), this allowed the TR to be lengthened and the flip angle increased to enhance the benefit offered by postcontrast imaging. However, the receiver bandwidth and TE were kept constant, as altering these parameters would have greatly improved the postcontrast images and thus unfavorably biased the comparison. In practice, given the longer TR, the acquisition bandwidth could have been decreased, resulting in an improvement in signal-to-noise ratio. The key geometric parameters between the two images (acquired pixel of 0.9 × 0.9 × 1.0 mm) were the same.
The application of high-field-strength (3-T) imaging to the study of acute stroke is a recent development. MR imaging at field strengths greater than 1.5 T has a number of advantages, including higher signal-to-noise ratio, large signal intensity loss from dynamic contrast-enhanced PW imaging, and improved background suppression in TOF due to increased tissue T1 relaxation times; however, these benefits come at the expense of increased susceptibility-induced distortion in single-shot echo-planar techniques used for DW and PW imaging (Fig 4A–C). In this study, the increased distortion had minimal effect on clinical interpretation and did not affect the quality of the TOF angiogams. Nevertheless, while capitalizing on the advantages offered by contrast-enhanced MR angiography at 3 T, the results of this study are also applicable to conventional 1.5-T MR imaging.
Although most of the changes associated with the administration of contrast material were in the direction of higher vessel patency, one must keep in mind that there was a substantial delay between pre- and postcontrast imaging. The pathophsyiology of acute ischemic stroke is dynamic, and some vessels may have reopened in this interval, either spontaneously or due to therapy. Other vessels may become occluded in this interval. Both the potential for recanalization and additional occlusion are limitations of this study. The spontaneous recanalization rate has been measured to be 24% in a 24-hour period occurring shortly after onset (16). Therapy is also likely to increase this recanalization rate, and in one study 75% of patients showed recanalization within 60 minutes of receiving therapy (17). The 50 vessels judged abnormal on the precontrast MR angiograms came from a total of 22 patients. Among these 22 patients, tPA was administered to 11, or equivalently, tPA could have affected 24 of the 50 abnormal vessels. Nevertheless, no statistically significant differences were observed between the treated and untreated subgroups. In addition, there is a potential for vascular occlusions to worsen in the interval between pre- and postcontrast angiography.
The absence of an accepted criterion standard, such as conventional angiography, is another limitation of this study. Although we can conclude that postcontrast MR angiography showed more open vessels, we do not know whether this indicates a higher accuracy; however, we can infer that this indicates improved performance in regions of slow and disturbed flow versus conventional (nonenhanced) TOF MR angiography. The pre- and postcontrast MR angiographic changes observed in 75% of our cases were consistent with the PW imaging findings. The lack of comparison with conventional angiography also precludes a meaningful assessment of what the changes in vascular signal grade correspond to on a pathophysiologic level (eg, visualization of leptomeningeal collateral flow past an M2 branch occlusion). Studies assessing the accuracy of pre- and postcontrast MR angiography against the results of conventional angiography are warranted.
Conclusions
Nonenhanced 3D TOF MR angiography has been incorporated into routine stroke workup; however, due to saturation of the MR signal, the major drawback of this method is inadequate depiction of vessels with slow or in-plane flow, such as those found in the distal intracranial branch vessels. Acquisition of 3D TOF data after contrast material administration improved the vascular signal overall and specifically in vessels judged to be abnormal on precontrast MR angiograms. The improved assessment of the postcontrast MR angiograms is due to decreased degrees of signal intensity loss caused by slow or disturbed flow. Acquisition after contrast administration can be adversely affected by enhancement from tissue and venous structures; however, this was not a significant problem in our study.
In the setting of acute stroke, postcontrast TOF MR angiography provides valuable and at times complementary information, since it provides a more accurate evaluation of the patency of intracranial vessels. According to these data, postcontrast MR angiography should be included as part of the routine stroke workup to provide the clinician with an improved vascular assessment. In our practice, we have found that the combination of pre- and postcontrast 3D TOF MR angiography improves our evaluation of acute ischemic stroke by more clearly segregating occluded from stenotic and normal intracranial vessels.
Acknowledgments
The authors wish to acknowledge the Calgary Stroke Program for providing access to patients with acute stroke and acquisition of relevant clinical information, the Foothills Medical Centre MR staff for imaging the patients, Ronda C. Ryder, BSc, for assisting with data collection during the blinded reviews, and Kathryn Werdal for assisting with data entry.
Footnotes
Supported by the Alberta Foundation for Health Research, Alberta Heritage Foundation for Medical Research (AHFMR),
Canada Foundation for Innovation, Canadian Health Research Institutes (CIHR), and Heart and Stroke Foundation of Canada (HSFC). A.M.D. is a CIHR Scholar and an AHFMR Clinical Investigator. R.F. is an HSFC Research Scholar and an AHFMR Medical Scholar.
Presented in part at the annual meeting of the International Society of Magnetic Resonance in Medicine, Glasgow, Scotland, 2001.
References
- 1.Axel L. Blood flow effects in magnetic resonance imaging. Magn Reson Annual 1986237–244 [PubMed]
- 2.Jager HR, Grives JP. Advances in non-invasive imaging of intracranial vascular disease. Ann R Coll Surg Engl 2000;82:1–5 [PMC free article] [PubMed] [Google Scholar]
- 3.Jung HW, Chang KH, Choi DS, Han HM, MC Han. Contrast-enhanced MR angiography for the diagnosis of intracranial vascular disease:optimal dose of gadopentate dimeglutamine. AJR Am J Roentgenol 1995;165:1251–1255 [DOI] [PubMed] [Google Scholar]
- 4.Yano T, Kodama T, Suzuki Y, Watanabe K.Gadolinium-enhanced 3D time of flight MR angiography. Acta Radiol 1997;38:47–54 [DOI] [PubMed] [Google Scholar]
- 5.Parker DL, Tsuruda JS, Goodrich KC, Alexander AL, Buswell HR. Contrast-enhanced magnetic resonance angiography of cerebral arteries. Invest Radiol 1998;33:560–572 [DOI] [PubMed] [Google Scholar]
- 6.Mathews VP, Ulmar JL, White ML, Hamilton CA, Reboussen DM, Elster AD. Depiction of intracranial vessels with MRA: utility of magnetization transfer saturation and gadolinium. J Comput Assist Tomogr 1999;23:597–602 [DOI] [PubMed] [Google Scholar]
- 7.Isoda H, Takehara Y, Isogaj S, et al. Software-triggered contrast-enhanced three-dimensional MR anigography of the intracranial arteries. AJR Am J Roentgenol 2000;174:371–375 [DOI] [PubMed] [Google Scholar]
- 8.Lyden P, Brott T, Tilley B, et al. Improved reliability of the NIH stroke scale using video training. Stroke 1994;25:220–226 [DOI] [PubMed] [Google Scholar]
- 9.Hill MD, Barber PA, Demchuk PA, et al. Building a “brain attack” team to administer thrombolytic therapy for acute ischemic stroke. CMAJ 2000;162:1589–1593 [PMC free article] [PubMed] [Google Scholar]
- 10.Norris JW, Buchan A, Cote R, et al. Canadian guidelines for intravenous thrombolytic treatment in acute stroke: a consensus statement of the Canadian Stroke Consortium. Can J Neurol Sci 1998;25:257–259 [DOI] [PubMed] [Google Scholar]
- 11.Frayne R, Sevick RJ, Demchuk AM, et al. Clinical stroke imaging at 3 T (abstr). In: Proceedings of the Eighth Meeting of the International Society for Magnetic Resonance in Medicine 2000. Berkeley, Calif: International Society for Magnetic Resonance in Medicine,2000;1253 [Google Scholar]
- 12.Landis JR, Koch GG. The measurement of observer agreement for categorical data. Biometrics 1974;33:159–174 [PubMed] [Google Scholar]
- 13.Raaymakers TW, Buys PC, Verbeeten B Jr, et al. MR angiography as a screening tool for intracranial aneurysms: feasibility, test characteristics, and interobserver agreement. AJR Am J Roentgenol 1999;173:1469–1475 [DOI] [PubMed] [Google Scholar]
- 14.Willig DS, Turski PA, Frayne R, et al. Contrast-enhanced 3D MR DSA of the carotid artery bifurcation: preliminary study of comparison with unenhanced 2D and 3D time-of-flight MR angiography. Radiology 1998;208:447–451 [DOI] [PubMed] [Google Scholar]
- 15.Huston J, Fain SB, Riederer SJ, Wilman AH, Bernstein MA, Busse R. Carotid arteries: maximizing arterial to venous contrast in fluoroscopically triggered contrast-enhanced MR angiography with elliptic centric view ordering. Radiology 1999;211:265–273 [DOI] [PubMed] [Google Scholar]
- 16.Vang C, Dunbabin D, Kilpatrick D. Effects of spontaneous recanalization on functional and electrophysiological recovery in acute ischemic stroke. Stroke 1999;30:2119–2125 [DOI] [PubMed] [Google Scholar]
- 17.Christou I, Alexandrov AV, Burgin WS, et al. Timing of recanalization after tissue plasminogen activator therapy determined by transcranial Doppler correlates with clinical recovery from ischemic stroke. Stroke 2000;31:1812–1816 [DOI] [PubMed] [Google Scholar]