Abstract
Summary: A 23-year-old man was admitted to the intensive care unit for respiratory failure, global lower and upper limb palsy, and higher cognitive function deterioration. Imaging, performed with a combination of the MR diffusion tensor imaging, fiber tracking, and MR spectroscopy, suggested the diagnosis of an acute severe unusual mitochondrial encephalopathy, lactic acidosis, and strokelike event, which was confirmed by muscle biopsy, but fiber tracking showed unexpected unaltered white matter tracts.
MELAS (mitochondrial encephalopathy, lactic acidosis, and strokelike events) is a mitochondrial disorder that can be diagnosed using both T2-weighted, diffusion-weighted, and MR spectroscopy imaging. The natural history of MELAS is strokelike events that can definitely alter both the brain and spinal cord. We describe here an unusual MELAS case involving the brain stem and spinal cord, diagnosed by using diffusion-weighted imaging, MR spectroscopy, and fiber tracking.
Case Report
A 23-year-old man, a native of West Africa, was admitted to our intensive care unit with headache, dizziness, and mild respiratory failure. He had mental retardation since childhood and a few months previously developed seizures, which were treated with carbamazepine (Tegretol, Novartis Pharmaceuticals Corporation, East Hanover, NJ). The clinical examination revealed a Glasgow Coma Scale (GCS) score of 14/15, ataxia, muscle weakness and abnormal movements, and mild myoclonic jerks affecting the arms and legs. The patient was admitted to the intensive care unit for respiratory failure and global lower and upper limb palsy and underwent other investigations, which found hypertrophic cardiopathy, moderate renal failure, hyperamylasemia, and hyperglycemia. The results of the first lumbar puncture were normal. As the patient’s condition deteriorated, with a GCS score of 4/15, a MR brain study was performed with T1-weighted (TR/TE, 430/8), T2-weighted fast spin-echo (TR/TE, 6000/102), fluid-attenuated inversion recovery (TR/TE/TI, 8740/104/2200), and axial echoplanar diffusion tensor imaging (TR/TE, 4900/85) with diffusion gradients set in 6 noncolinear directions by using two b values (b = 0 and 1000 s/mm2) (field of view, 24 × 24 cm; image matrix, 128 × 128; 30 sections with section thickness of 4 mm; nominal voxel size, 1.875 × 1.875 × 4 mm). Spinal cord MR imaging was performed by using sagittal fast spin-echo T2-weighted imaging (TR/TE, 4000/106; 13 sections of 3-mm thickness; field of view, 25 × 25 cm; matrix, 384 × 307) and sagittal echoplanar diffusion tensor imaging (TR/TE, 4600/75) with diffusion gradients set in six noncolinear directions by using two b values (b = 0 and 500 seconds/mm2) (field of view, 18 × 18 cm; image matrix, 128 × 128; 12 sections with section thickness of 3 mm; nominal voxel size, 1.4 × 1.4 × 4 mm). Diffusion-tensor imaging directions were as follows: [(1/√2, 0, 1/√2); (−1/√2, 0, 1/√2); (0, 1/√2, 1/√2); (0, 1/√2, −1/√2); (1/√2, 1/√2, 0); (−1/√2, 1/√2, 0)], providing the best precision in the tensor component when six directions are used (1). The duration of diffusion-weighted imaging was 1 minute 40 seconds (brain) and 2 minutes 10 seconds (spinal cord) per patient study. The diffusion tensor raw images were analyzed by using DPTools software (http://www.fmritools.hd.free.fr). The six elements (Dxx, Dyy, Dzz, Dxy, Dxz, and Dyz) for each voxel calculated from six images obtained by applying diffusion-sensitizing gradients in the six noncolinear directions (xx, yy, zz, xy, xz, and yz), in addition to a non–diffusion-weighted image, were diagonalized to compute the Eigenvalues (λ1, λ2, λ3) of the diffusion tensor imaging matrix. Then the apparent diffusion coefficient was computed by using apparent diffusion coefficient = (λ1 + λ2 + λ3)/3, and the fractional anisotropy was computed by using (1) fractional anisotropy
 |
Fractional anisotropy values around 1 are totally anisotropic; fractional anisotropy values around 0 are totally isotropic.
In addition to the two-dimensional parametric color maps processed by using the previously described methods, three-dimensional white matter fiber-tract maps were created, and fiber tracks were coregistered on these maps by using a special algorithm previously described (2).
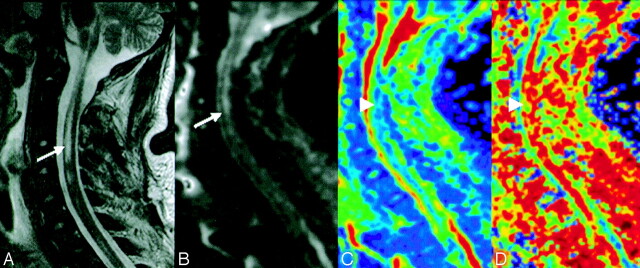
On the T2-weighted and fluid-attenuated inversion recovery images, multiple abnormal high-signal-intensity lesions were shown in the mesencephalon, medulla oblongata, cerebellum, and cervical spinal cord. Regions of interest of 81 mm2 (49 pixels) in the brain and 44 mm2 (22 pixels) in the spine were drawn on the diffusion tensor imaging b0 abnormal areas that matched those abnormal areas in fluid-attenuated inversion recovery (brain) or T2-weighted (spine) images. Regions of interest for normal controls were set on T2-weighted or fluid-attenuated inversion recovery normal areas in the mesencephalon and the cervical spinal cord. Apparent diffusion coefficient values were slightly increased in abnormal brain areas (1.287 ± 0.034 10−3 mm2/s) compared with normal ones (0.997 ± 0.02 10−3 mm2/s) and in the cervical spinal cord (apparent diffusion coefficient = 1.29 ± 0.02 10−3 mm2/s) compared with normal ones (1.02 ± 0.019 10−3 mm2/s). Fractional anisotropy values were decreased in the brain (fractional anisotropy = 0.32 ± 0.12) and the spinal cord (fractional anisotropy = 0.49 ± 0.14) abnormal areas when compared with normal ones (fractional anisotropy = 0.46 ± 0.11 in the brain and fractional anisotropy = 0.66 ± 0.12 in the cervical spinal cord) (Figs 1 and 2).
Fig 1.

Axial fluid-attenuated inversion recovery MR (A) and diffusion-weighted b0 (B) images show an abnormal area in the right mesencephalon (arrows). Apparent diffusion coefficient (C) and fractional anisotropy (D) color-scale parametric maps show an increased apparent diffusion coefficient and decreased fractional anisotropy values (green) in the same abnormal area (B) (arrowheads).
Fig 2.
Spinal cord sagittal T2-weighted MR (A) and diffusion-weighted b0 (B) images show wide intraspinal abnormal areas (arrows). Apparent diffusion coefficient (C) and fractional anisotropy (D) color-scale parametric maps show increased apparent diffusion coefficient and decreased fractional anisotropy values (green) in the same abnormal area (arrowheads).
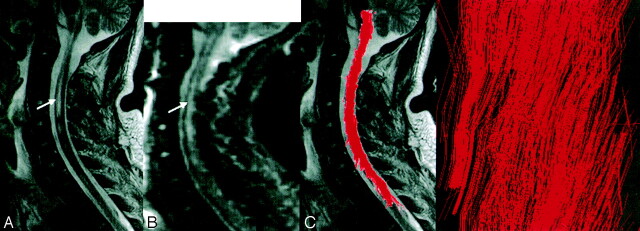
Fiber tracking of the brain and cervical spinal cord showed an unexpected normal pattern of the white matter tracts, especially the anterior corticospinal and posterior spinothalamic pathways in the mesocephalon and cervical spinal cord areas of abnormal T2-weighted signal intensity (Fig 3).
Fig 3.
Spinal cord sagittal T2-weighted MR (A) and diffusion-weighted b0 (B) images show wide intraspinal abnormal areas (arrows). Fiber tracking (C), coregistered and projected on a T2-weighted image, shows an unexpected unaltered shape of the white matter tracts, with visualization (D) of corticospinal tracts and nerve roots (arrowhead).
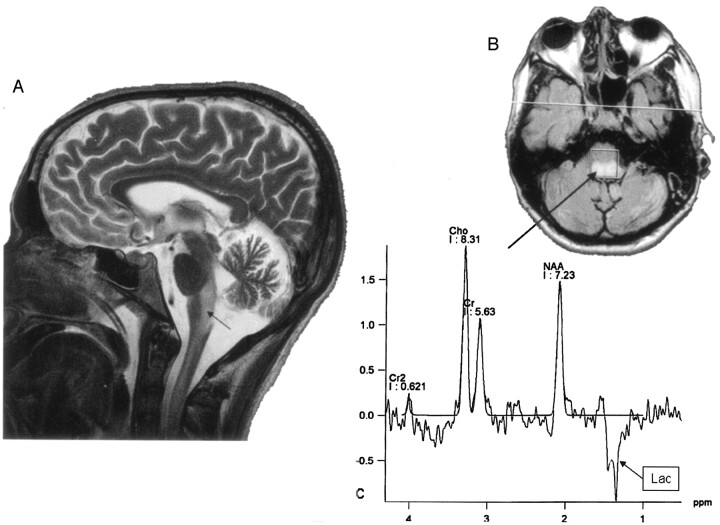
Localized proton MR spectroscopy was performed by using a single-voxel point-resolved spectroscopy sequence. A 1.5 × 1.5 × 1.5 cm voxel was placed in the medulla oblongata on the abnormal T2-weighted areas. Two acquisitions were obtained by using the same voxel location with TE = 30 and TE = 135, keeping all other parameters constant (with TR = 1500, and 128 averaged scans). The spectroscopic data were processed on an independent Siemens (Erburgen, Germany) workstation by using dedicated software. The long TE spectrum (Fig 4) showed increased choline (Cho) peak, normal creatine (CR) peak, decreased n-acetylaspartate (NAA) peak, and an inverted peak at 1.3 ppm, confirming the presence of lactic acid.
Fig 4.
Sagittal T2-weighted MR image (A) shows extensive abnormal areas involving the brain stem and the cervical spinal cord (arrow). A long TE MR spectroscopy voxel was located on fluid-attenuated inversion recovery abnormal areas in the medulla oblongata (B, arrow) and showed a spectrum with increased Cho peak, decreased NAA peak, and an inverted 1.3-ppm lactate peak (Lac, arrow box). Cr indicates creatine.
The main hypothesis suggested by diffusion tensor imaging and MR spectroscopy was an unusual MELAS (3, 4). Subsequent to MR imaging, another lumbar puncture was performed, and results revealed increased lactate in the cerebrospinal fluid. Muscle biopsy was then performed twice, the second revealing a decreased ratio of the complement factors (C1, C2, and C3), in addition to ragged-red fibers and strongly sorbitol dehydrogenase–stained vessels, both of which were compatible with the pathologic findings in MELAS (5). Two months later, the patient left the intensive care unit, his GCS score had increased to 12, and he had good improvement of his motor and respiratory functions.
Discussion
MELAS is a mitochondrial disorder characterized by nausea, vomiting, seizure, headaches, diabetes mellitus, muscle weakness, exercise intolerance, sensor neural hearing loss, and sudden neurologic deficits (6). Biologic findings are lactates in the cerebral spinal fluid and complement factor deficiency (from one to all factors) (5, 6). Clinical outcome generally improves over time, but repeated neurologic deficits occur and the patient’s condition progressively deteriorates.
Imaging findings are abnormal areas in T2-weighted and fluid-attenuated inversion recovery sequences, involving both cortical and subcortical regions, without the usual arterial stroke pattern (7). Diffusion-weighted imaging and diffusion tensor imaging provide information on the mobility of water molecules in tissue. Use of these techniques is widely accepted and used for detecting acute ischemic brain injury (8, 9). Highly mobile extracellular water shifts into the intracellular compartment, generating cytotoxic edema during the early stage of arterial stroke (9). Movement of water is more restricted in the intracellular environment, resulting in hyperintensity on diffusion-weighted images with decreased apparent diffusion coefficient values. Indeed, decreased apparent diffusion coefficient values reflect intracellular edema, and increased apparent diffusion coefficient values correspond to an increase in the extracellular space (vasogenic edema). Thus, diffusion-weighted imaging potentially distinguishes cytotoxic and vasogenic edema (9).
Water diffusion in biologic tissue is highly dependent on the ratio of extracellular to intracellular space and is greater in the extracellular space compared with that in the intracellular space. The importance of the ratio of extracellular to intracellular space in determining water diffusivity has been noted in acute cerebral ischemia, in which decreased extracellular-to-intracellular volume ratio is thought to be the dominant mechanism underlying apparent diffusion coefficient reduction (10). In MELAS, diffusion-weighted imaging usually shows increased apparent diffusion coefficient values in the acute stage of the syndrome, but this increase generally is not specific to this disease (11). The pathophysiologic hypothesis on MELAS relies on vasogenic edema in the acute and/or subacute stage (11).
MR spectroscopy can play an important role in the differential diagnosis of brain lesions (12). Numerous studies have demonstrated that pretreatment evaluation based on MR spectroscopy is very useful for planning surgery and radiation therapy, as well as for assessing prognosis. Our MR spectroscopy findings are similar to previous observations in the literature (3, 4). MR spectroscopy performed on MELAS lesions either in the acute or subacute stage shows a decreased ratio of NAA/Cho metabolites and an inverted lactate peak at long TE. This finding is consistent with an increased phosphocholine turnover in relation to membrane lysis and biosynthesis by the swollen cells (12).
The decreased NAA is likely due to a reduction in neurons per unit volume secondary to cell lysis. The increased lactate may be the result of prevailing glycolysis, possibly in conjunction with cell hypoxia/ischemia from a possible inadequate blood supply (12). MR spectroscopy is not specific to this disease; lactates may also be found in stroke events, seizures, or headaches. What was very unusual in this case report was the conjunction of sudden respiratory failure, a very rare symptom in this disease, and abnormal areas involving the cervical spinal cord and the brain stem on MR imaging. Usually MELAS with respiratory failure is due to diaphragmatic myopathy. In this case report, there were no abnormal muscle findings suggesting a myopathy, and the main diagnosis hypothesis of MELAS involving the brain stem, suggested by conventional T2-weighted and fluid-attenuated inversion recovery imaging, was improved using the conjunction of diffusion tensor imaging, which discarded an acute stroke event (apparent diffusion coefficient values were increased in abnormal areas), and MR spectroscopy, which showed lactate peaks in lesions. A possible apparent diffusion coefficient–MR spectroscopy signature of MELAS is therefore a normal or high apparent diffusion coefficient value with a lactate peak.
Both apparent diffusion coefficient and MR spectroscopy provide information about the pathophysiology of the disease and help to assess the diagnosis. Diffusion-tensor imaging is a special MR imaging technique that evaluates the translation of extracellular water molecules among the white matter fibers (13), using a directional evaluation of the water diffusivity (diffusion anisotropy) due to its scalar properties. Fractional anisotropy, a useful parameter derived from diffusion tensor imaging computations and used for fiber-tracking purposes, has been reported to be more sensitive than the apparent diffusion coefficient in detecting abnormal brain areas in special diseases such as multiple sclerosis (14). Moreover, fractional anisotropy is used to reconstruct three-dimensional white matter fiber tracts (15) on the basis of similarities between neighboring voxels in the shape (quantitative diffusion anisotropy measures) and orientation (principal Eigenvector map) of the diffusion ellipsoid. Factors affecting the shape of the apparent diffusion tensor in the white matter include the attenuation of fibers, the degree of myelination, the average fiber diameter, and the directional similarity of the fibers in the voxel (15). Then, it is possible to access the fiber connectivity (15).
What was unexpected in this MELAS case was the discrepancy between both apparent diffusion coefficient and fractional anisotropy measurements made in abnormal areas of the spinal cord and the normal aspect of spinal white matter tracts in fiber tracking. Apparent diffusion coefficient and fractional anisotropy are both sensitive to extracellular edema, which involves the white matter tracts in MELAS. Fiber tracking links voxels of similar fractional anisotropy values, then reflects the anatomic organization of white matter tracts regardless of the extracellular water quantity. With fiber tracking, extracellular water can be indirectly assessed only by viewing the shape of the white matter tracts (ie, broken, narrowed, or warped). In our MELAS case, extracellular water did not alter the tract shape, which suggests that the quantity of extracellular edema was not large enough to warp these tracts. Indeed, neighboring voxels with decreased fractional anisotropy values may be interpreted by our fiber-tracking algorithm as continuous tracts if the difference between the voxels is below the thresholding condition of the algorithm (here 0.17).
What was unexpected in this MELAS case is that fiber tracking can visualize spinal cord white matter tracts even with abnormal fractional anisotropy values. This emerging new technique may thus help radiologist visualize normal or warped tracts and may contribute to achieving a positive diagnosis.
Conclusion
The combination of diffusion tensor imaging and MR spectroscopy provides increased specificity in the detection of MELAS using MR imaging. Fiber tracking helps to visualize the integrity of white matter tracts. This case report suggests that future work to address this issue is warranted.
References
- 1.Basser P, Pierpaoli C. A simplified method to measure the diffusion tensor from seven MR images. Magn Reson Med 1998;39:928–934 [DOI] [PubMed] [Google Scholar]
- 2.Westin CF, Maier SE, Mamata H, et al. Processing and visualization for diffusion tensor MRI. Med Image Anal 2002;6:93–108 [DOI] [PubMed] [Google Scholar]
- 3.Oppenheim C, Galanaud D, SamsonY, et al. Can diffusion-weighted magnetic resonance imaging help differentiate stroke from stroke-like events in MELAS? J Neurol Neurosurg Psychiatry 2000;69:248–250 [DOI] [PMC free article] [PubMed] [Google Scholar]
- 4.Kamada K, Takeuchi F, Houkin K, et al. Reversible brain dysfunction in MELAS: MEG and 1H MRS analysis. J Neurol Neurosurg Psychiatry 2001;70:675–678 [DOI] [PMC free article] [PubMed] [Google Scholar]
- 5.Tanji K, Kunimatsu T, Vu TH, Bonilla E. Neuropathological features of mitochondrial disorders. Semin Cell Dev Biol 2001;12:429–439 [DOI] [PubMed] [Google Scholar]
- 6.Bernier FP, Boneh A, Dennett X, et al. Diagnostic criteria for respiratory chain disorders in adults and children. Neurology 2002;59:1406–1411 [DOI] [PubMed] [Google Scholar]
- 7.Martinez-Fernandez E, Gil-Peralta A, Garcia-Lozano R, et al. Mitochondrial disease and stroke. Stroke 2001;32:2507–2510 [DOI] [PubMed] [Google Scholar]
- 8.LeBihan D. Molecular diffusion nuclear magnetic resonance imaging. Magn Reson Q 1991;7:1–30 [PubMed] [Google Scholar]
- 9.Provenzale JM, Sorensen AG. Diffusion-weighted MR imaging in acute stroke: theoretic considerations and clinical applications. AJR Am J Roentgenol 1999;173:1459–1467 [DOI] [PubMed] [Google Scholar]
- 10.Latour LL, Svoboda K, Mitra PP, Sotak CH. Time-dependent diffusion of water in a biological model system. Proc Natl Acad Sci U S A 1994;91:1229–1233 [DOI] [PMC free article] [PubMed] [Google Scholar]
- 11.Yoneda M, Maeda M, Kimura H, et al. Vasogenic edema in MELAS: a serial study with diffusion weighted MR imaging. Neurology 1999;53:2182–2184 [DOI] [PubMed] [Google Scholar]
- 12.Hsu EW, Aiken NR, Blackband SJ. Nuclear magnetic resonance microscopy of single neurons under hypotonic perturbation. Am J Physiol 1996;271:C1895–1900 [DOI] [PubMed] [Google Scholar]
- 13.Basser P, Pierpaoli C. Microstructural and physiological features of tissues elucidated by quantitative-diffusion-tensor MRI. J Magn Reson B 1996;111:209–219 [DOI] [PubMed] [Google Scholar]
- 14.Tievsky AL, Ptak T, Farkas J. Investigation of apparent diffusion coefficient and diffusion tensor anisotropy in acute and chronic multiple sclerosis lesions. AJNR Am J Neuroradiol 1999;20:1491–1499 [PMC free article] [PubMed] [Google Scholar]
- 15.Basser PJ. Fibre-tractography via diffusion tensor MRI (DTMRI). In: Congress proceedings of the International Society of Magnetic Resonance in Medicine. 6th ed. Sydney, Australia;.1998. :1226


