Abstract
Summary: We report on the brain diffusion MR imaging findings in a neonate with severe hypernatremic dehydration, which resulted in cerebral edema (osmotic edema) and in apparent diffusion coefficient decrease, despite a careful and slow rehydration. This report provides in vivo insight into nervous cell response to osmotic challenge.
We report on the brain diffusion MR imaging findings in a neonate with severe hypernatremic dehydration, which resulted in cerebral edema (osmotic edema) and in apparent diffusion coefficient decrease, despite a careful and slow rehydration. This case provides in vivo insight into nervous cell response to osmotic challenge. Moreover, it may act as an accidental human model of cytotoxic edema and may help in understanding water diffusion changes, which occur in acute brain ischemia in clinical settings.
Case Report
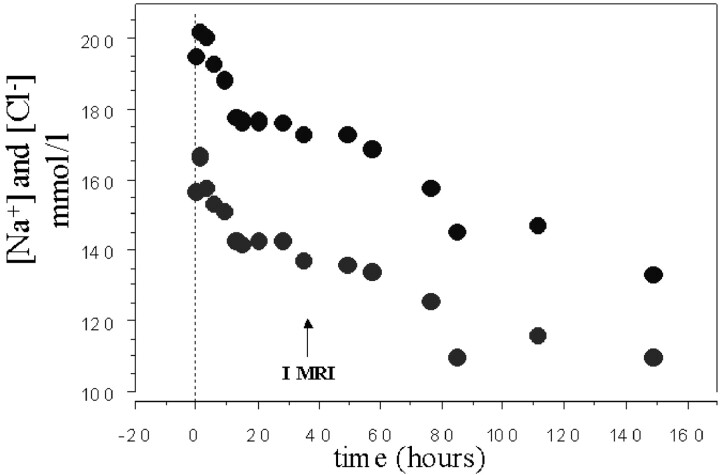
A 20-day-old male neonate presented at our institution in the hot midsummer season with marked dehydration and lethargy after prolonged starvation, because his mother had a major psychiatric disorder. His mother claimed she had given him small amounts of goat milk, but she could not prove this. At admission (time course, 0 hours), laboratory studies disclosed the following values: serum sodium, 208 mmol/L (Fig 1); potassium, 6.5 mmol/L; pH, 7.29; glycemia, 2.2 mmol/L; hematocrit, 58.5; and body weight, 2200 g. Mean arterial blood pressure was 42 mm Hg. There were no data about birth weight because the mother had delivered the baby at home. He was slowly hydrated with hyperosmolar intravenous solutions and formula milk to reduce the serum sodium level at a rate of <2 mmol/L per hour. Despite the cautious and slow rehydration procedure, at 9 hours he presented with generalized seizures, which repeated in two subsequent episodes for about 6 hours, regardless of phenobarbital therapy.
Fig 1.
Time course of sodium and chlorum serum concentrations during the neonatal intensive care unit stay. I MRI indicates the first imaging study.
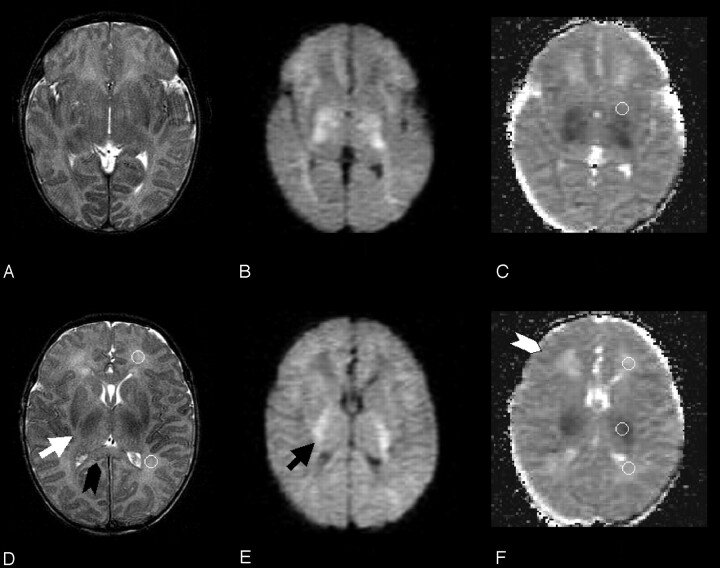
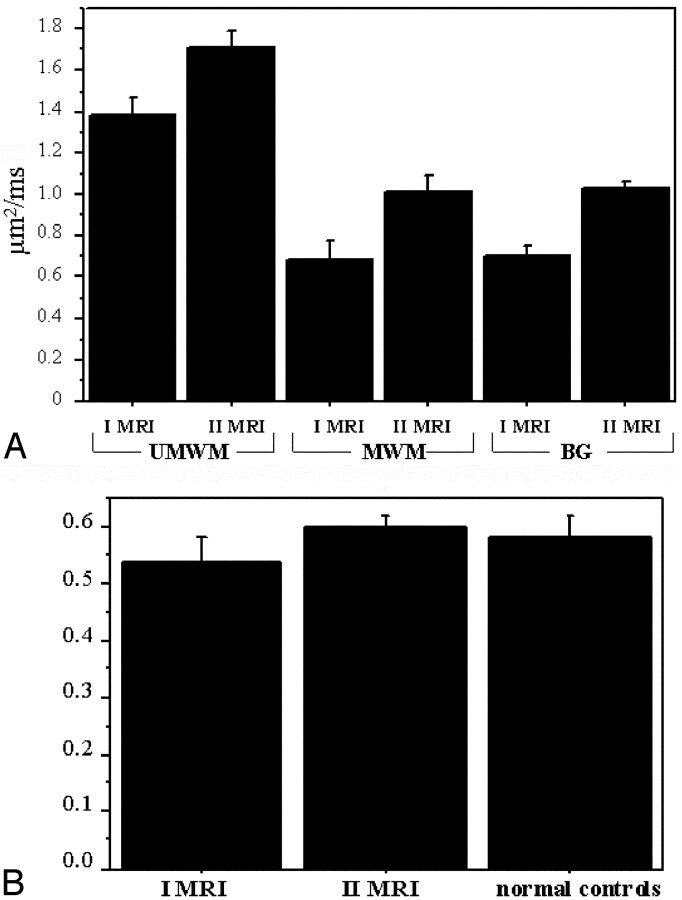
At 38 hours, an MR imaging study was performed (1.5T scanner, EchoSpeed, GE Healthcare, Milwaukee, WI), using an axial T2-weighted fast spin-echo sequence (TR/TE, 6000/200; 3-mm-thick sections; field of view, 18 cm; matrix, 320 × 320), a sagittal T1-weighted spin-echo sequence, and axial echoplanar diffusion MR imaging (section thickness, 5 mm; rectangular field of view, 24 × 12 cm; matrix, 128 × 128; 3 axes diffusion sensitization with b factor maximum, 1000 seconds/mm2). The MR imaging study demonstrated mild subdural bleeding (not shown), diffuse and remarkable brain swelling, with no apparent gray or white matter T2-weighted signal intensity increase, and generalized clear apparent diffusion coefficient reduction in gray matter and myelinated-unmyelinated white matter (Fig 2). The ratio value between T2-weighted signal intensity of frontal-occipital unmyelinated white matter and of ventricular cerebrospinal fluid was similar to the average value calculated in healthy neonates (who undergo MR imaging for head and neck anomalies) (Fig 3). The average value of regions of interest of both hemispheres was considered for both measurements: apparent diffusion coefficient value and T2-weighted signal intensity ratio. After seizures subsided, alertness and reactivity to external stimuli progressively improved.
Fig 2.
Two T2-weighted fast spin-echo (A, D), diffusion-weighted (B, E), and trace apparent diffusion coefficient–calculated (C) f-axial sections from the first (time course, 0 hours) MR imaging study are reported. Ventricular and cortical cerebrospinal fluid spaces are clearly reduced. The black arrowhead shows clear swelling of the corpus callosum (especially if compared with Fig 4). The white arrow shows the thickened posterior limb of the internal capsula, and the black arrow shows increased diffusion-weighted signal intensity within the myelinated white matter at the same location. Moderate T2-weighted signal intensity increase is visible within the posterior thalamus bilaterally. The white arrowhead indicates the swollen cortical rim. Circular regions of interest for frontal and occipital unmyelinated white matter are shown for one hemisphere on T2-weighted section (D). Regions of interest for basal ganglia, frontal and occipital unmyelinated white matter, and myelinated white matter of the internal capsula are depicted on apparent diffusion coefficient maps (C and F). These regions of interest were transferred from T2 b = 0 corresponding sections. Cortical gray matter regions of interest could not be traced because of partial volume effect.
Fig 3.
A, Graph shows plot of the average apparent diffusion coefficient value (with standard deviation of unmyelinated white matter [UMWM]), myelinated white matter (MWM), and basal ganglia (BG) regions of interest in the first (I MRI) and second (II MRI) MR imaging study. B, Graph shows plot of the average value (with standard deviation) of the ratio between T2-weighted signal intensity of frontal-occipital unmyelinated white matter and of cerebrospinal fluid in the first and second MR imaging studies and in normal controls (n = 5).
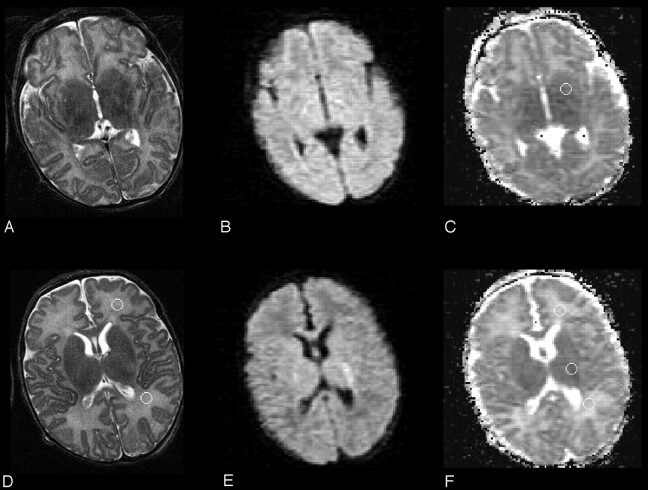
A second MR imaging study, performed at 200 hours with the same protocol, revealed normalization of apparent diffusion coefficient values (according to the description of healthy neonates by Tanner et al [1]) and no apparent brain MR signal intensity or morphologic anomalies (Fig 4). Findings of a 12-month neurologic examination, performed by a child neurologist for follow-up, were normal.
Fig 4.
Two T2-weighted (A, D), diffusion-weighted (B, E), and trace apparent diffusion coefficient–calculated (C) f-axial sections from the second (at 200 hours) MR imaging study, obtained at a location similar to that of Fig 2, are reported. Cerebrospinal fluid spaces and brain parenchyma signal intensity are normal. The cortical rim and corpus callosum are no longer swollen. The regions of interest are the same ones as depicted in Fig 2.
Discussion
The conventional MR imaging findings and the apparent diffusion coefficient measurement data of this case strongly correlate with the biophysical experimental results (2–5), the animal model data (6, 7), and the CT observations (8, 9) reported in severe osmolar perturbation of nervous tissue.
Experimental animal data (10–13) and a clinical MR proton spectroscopy study (14) demonstrated that during severe hypernatremic dehydration, brain cells actively produce the so-called idiogenic osmoles (ie, taurine, glutamine, creatine, myo-inositol) to prevent water shifting from the intracellular to the hyperosmolar extracellular environment. The intracellular accumulation of idiogenic osmoles seems to act as a very powerful protective mechanism, but it has significant implications regarding the correction rate of hypernatremia. In extreme hypernatremic dehydration, exogenous water, even when intake appears to be appropriately slow, as in our case, can nevertheless easily become excessive because of the very slow homeostatic exchange between the 3 compartments (intracellular, extracellular interstitial, and extracellular intravascular). The very slow dissipation of idiogenic osmoles may induce intracellular hyperosmolarity to persist for several days. Consequently, water molecules shift from the relatively low osmolar extracellular environment into the relatively high osmolar intracellular one. This process is associated with a net increase in tissular volume, which corresponded in our patient to the generalized brain swelling. Neuron and glial cell swelling is accompanied by extracellular space decrease. Sophisticated in vitro experiments, which used cell cultures or vital specimens of animal (2, 3) and human (15) brains, clearly demonstrated that during osmolar challenge (ie, hypotonic culture media), nervous cells swell and this change leads to a decrease in extracelluar space and a reduction in apparent diffusion coefficient value.
The subdural bleeding found in our patient very likely occurred before hospitalization, when brain volume had probably shrunk. Intracranial bleeding has already been reported on CT in cases of hypernatremic dehydration (8, 9). In these cases, before treatment is started, severe increase in extracellular sodium concentration results in intracellular water loss and considerable brain shrinkage, which causes stress tears to occur in bridging veins and dural sinuses, with consequent subdural bleeding (16).
Cytotoxic edema with cell swelling and extracellular space reduction is generally indicated as the main cause of apparent diffusion coefficient decrease during acute ischemia. There have been attempts to reproduce cytotoxic edema through osmolar perturbation in animal diffusion MR imaging studies (17). These data, based on the assumption that osmolar brain edema is a model of cytotoxic edema, seem to support the cytotoxic edema hypothesis concerning apparent diffusion coefficient reduction during ischemia; however, to our knowledge, the clinical examples supporting the cytotoxic edema hypothesis are very scarce. The case we reported has the features of a human model of cytotoxic edema, because osmolar edema, of which the pathophysiology has been extensively investigated (18, 19), can resemble cytotoxic edema, the change in the intracellular-to-extracellular compartment volume ratio being similar. The present case seems to support the cytotoxic edema hypothesis, in agreement with the animal model data (17).
The clear apparent diffusion coefficient reduction we found in myelinated white matter (ie, internal capsule) is similar to that particular kind of cytotoxic edema called “intramyelinic edema,” characteristic of heavily myelinated axons. During the development of intramyelinic edema, water molecules accumulate within the myelin layer, splitting the myelinic lamellae at the intraperiod line level, forming vacuoles, and producing an apparent diffusion coefficient reduction, as demonstrated, for example, in acute encephalopathy due to maple syrup urine disease (20). Although this mechanism could account for the apparent diffusion coefficient reduction in myelinated white matter in our case, the apparent diffusion coefficient decrease demonstrated in nonmyelinated white matter was likely caused by glial and axonal swelling.
Status epilepticus and prolonged seizures in animal models (21) and clinical settings (22) have been associated with transient apparent diffusion coefficient reduction, probably mediated by the onset of cytotoxic edema, especially with concurrent metabolic acidosis, as was present in our case. We cannot completely rule out the explanation that the repeated convulsions may have also contributed to the apparent diffusion coefficient reduction; however, diffusion MR imaging changes in prolonged seizures do not usually extend throughout the entire brain, as in our patient; they are rather confined to the cortical areas most susceptible to seizures, at least in adult patients, because to our knowledge, data on neonates are not available.
An interesting and unsolved issue in our report is the T2-weighted signal intensity behavior. Although we could not provide real quantitative relaxometry T2 measurements, the ratio between T2-weighted signal intensity of the unmyelinated white matter and cerebrospinal fluid can be considered an approximate way to determine parenchymal T2 value changes. Despite the increase in total brain water as demonstrated by the remarkable brain swelling, the mean ratio value in the first MR image did not differ from the mean value in normal controls, or from the mean value in the follow-up MR imaging study. The ratio value even tended to be lower than normal. This finding seems to contradict what has been reported in in vitro brain experimental osmotic challenge studies (2), which showed a T2 value prolongation during cell swelling.
Also in a sophisticated MR imaging study, in which a single neuron underwent in vitro osmotic challenge, the intracellular T2 value increased along with cell body enlargement (23). However, it is well known from clinical imaging of hyperacute stroke that before the onset of vasogenic edema, the T2-weighted signal intensity does not increase during the cytotoxic edema stage (24), as in our case. Therefore, there seems to be a discrepancy between what was reported in in vitro osmotic challenge studies and the current clinical experience about T2-weighted signal intensity behavior during cytotoxic edema development. On the basis of this report, we remain uncertain of the nature of this signal intensity behavior. T2 relaxometry studies in clinical stroke at a very early stage are needed to clarify the issue.
The clear apparent diffusion coefficient decrease shown in this neonate appeared to be reversible, because it reached normal values on the second MR imaging study. Although the clinical follow-up was confined to only 12 months, the neurologic development of the child was normal. To the best of our knowledge, there are no recent reports showing absence of brain parenchyma lesions following hypernatremic dehydration with natremia 190 mmol/L, because at such levels of natremia, death or extensive brain damage seems to be the usual outcome (8, 9, 25). The reasons for the favorable outcome in our case are not totally clear, although they are likely to derive from the cautious rehydration program, which aimed to reduce the serum sodium level at <2 mmol/L per hour. This approach has been effective in reducing the risk of permanent brain sequelae, but it did not prevent the development of seizures.
The baby was mildly hypotensive at admission, so it might be hypothesized that the apparent diffusion coefficient reduction occurred as a consequence of global ischemia; however, no T2-weighted or T1-weighted cortical and basal ganglia signal intensity alterations, characteristic of neonatal global hypoxic-ischemic damage, were visible at the 200-hour follow-up scanning. Moreover, although a pseudonormalization of apparent diffusion coefficient may occur several days after neonatal severe hypoxic-ischemic damage (26), the absence of T2- and T1-weighted signal intensity alterations at follow-up scanning suggests that a real normalization of the apparent diffusion coefficient value occurred in our case.
Our patient presented with mild hypoglycemia, which might have had a noxious effect on brain parenchyma; however, MR imaging features of neonatal hypoglycemic encephalopathy are quite different from the ones we reported, because in hypoglycemia, damage is characteristically located in the parietal-occipital areas (27).
Although we believe that rehydrating therapy played the pivotal role in producing the osmotic edema and the associated apparent diffusion coefficient reduction in our case because of the strong evidence rising from the reported experimental models, severe hypernatremia itself, during the days before hospital admission, may have contributed to the tissular impairment and the apparent diffusion coefficient decrease.
Repeated diffusion MR imaging studies allow an in vivo insight into brain changes during hypernatremic dehydration that may be useful in assessing whether the rehydrating therapy program is appropriate.
References
- 1.Tanner SF, Ramenghi LA, Ridgway JP, et al. Quantitative comparison of intrabrain diffusion in adults and preterm and term neonates and infants. AJR Am J Roentgenol 2000;174:1643–1649 [DOI] [PubMed] [Google Scholar]
- 2.O’Shea JM, Williams SR, van Bruggen N, Gardner-Medwin AR. Apparent diffusion coefficient and MR relaxation during osmotic manipulation in isolated turtle cerebellum. Magn Reson Med 2000;44:427–432 [DOI] [PubMed] [Google Scholar]
- 3.Krizaj D, Rice ME, Wardle RA, Nicholson C. Water compartmentalization and extracellular tortuosity after osmotic changes in cerebellum of Trachemys scripta. J Physiol 1996;492:887–896 [DOI] [PMC free article] [PubMed] [Google Scholar]
- 4.Shepherd TM, Wirth ED 3rd, Thelwall PE, et al. Water diffusion measurements in perfused human hippocampal slices undergoing tonicity changes. Magn Reson Med 2003;49:856–863 [DOI] [PubMed] [Google Scholar]
- 5.Anderson AW, Zhong J, Petroff OA, et al. Effects of osmotically driven cell volume changes on diffusion-weighted imaging of the rat optic nerve. Magn Reson Med 1996;35:162–167 [DOI] [PubMed] [Google Scholar]
- 6.Ayus JC, Armstrong DL, Arieff AI. Effects of hypernatraemia in the central nervous system and its therapy in rats and rabbits. J Physiol 1996;492(Pt 1):234–255 [DOI] [PMC free article] [PubMed] [Google Scholar]
- 7.Hogan GR, Dodge PR, Gill SR, et al. The incidence of seizures after rehydration of hypernatremic rabbits with intravenous or ad libitum oral fluids. Pediatr Res 1984;18:340–345 [DOI] [PubMed] [Google Scholar]
- 8.AlOrainy IA, O’Gorman AM, Decell MK. Cerebral bleeding, infarcts, and presumed extrapontine myelinolysis in hypernatraemic dehydration. Neuroradiology 1999;41:144–146 [DOI] [PubMed] [Google Scholar]
- 9.Mocharla R, Schexnayder SM, Glasier CM. Fatal cerebral edema and intracranial hemorrhage associated with hypernatremic dehydration. Pediatr Radiol 1997;27:785–787 [DOI] [PubMed] [Google Scholar]
- 10.Trachtman H, Yancey PH, Gullans SR. Cerebral cell volume regulation during hypernatremia in developing rats. Brain Res 1995;693:155–162 [DOI] [PubMed] [Google Scholar]
- 11.Trachtman H, Barbour R, Sturman JA, Finberg L. Taurine and osmoregulation: taurine is a cerebral osmoprotective molecule in chronic hypernatremic dehydration. Pediatr Res 1988;23:35–39 [DOI] [PubMed] [Google Scholar]
- 12.Thurston JH, Sherman WR, Hauhart RE, Kloepper RF. Myo-inositol: a newly identified nonnitrogenous osmoregulatory molecule in mammalian brain. Pediatr Res 1989;26:482–485 [DOI] [PubMed] [Google Scholar]
- 13.Trachtman H. Cell volume regulation: a review of cerebral adaptive mechanisms and implications for clinical treatment of osmolal disturbances: II. Pediatr Nephrol 1992;6:104–112 [DOI] [PubMed] [Google Scholar]
- 14.Lee JH, Arcinue E, Ross BD. Brief report: organic osmolytes in the brain of an infant with hypernatremia. N Engl J Med 1994;331:439–442 [DOI] [PubMed] [Google Scholar]
- 15.Shepherd TM, Wirth ED 3rd, Thelwall PE, et al. Water diffusion measurements in perfused human hippocampal slices undergoing tonicity changes. Magn Reson Med 2003;49:856–863 [DOI] [PubMed] [Google Scholar]
- 16.Finberg L, Luttrell C, Redd H. Pathogenesis of lesions in the nervous system in hypernatremic states. II. Experimental studies of gross anatomic changes and alterations of chemical composition of the tissues Pediatrics 1959;23:46–53 [PubMed] [Google Scholar]
- 17.Sevick RJ, Kanda F, Mintorovitch J, et al. Cytotoxic brain edema: assessment with diffusion-weighted MR imaging. Radiology 1992;185:687–690 [DOI] [PubMed] [Google Scholar]
- 18.Olson JE, Mishler L, Dimlich RV. Brain water content, brain blood volume, blood chemistry, and pathology in a model of cerebral edema. Ann Emerg Med 1990;19:1113–1121 [DOI] [PubMed] [Google Scholar]
- 19.Melton JE, Nattie EE. Brain and CSF water and ions during dilutional and isosmotic hyponatremia in the rat. Am J Physiol 1983;244:724–732 [DOI] [PubMed] [Google Scholar]
- 20.Righini A, Ramenghi LA, Parini R, et al. Water apparent diffusion coefficient and T2 changes in the acute stage of maple syrup urine disease: evidence of intramyelinic and vasogenic-interstitial edema. J Neuroimaging 2003;13:162–165 [PubMed] [Google Scholar]
- 21.Zhong J, Petroff OA, Prichard JW, Gore JC. Changes in water diffusion and relaxation properties of rat cerebrum during status epilepticus. Magn Reson Med 1993;30:241–246 [DOI] [PubMed] [Google Scholar]
- 22.Kim JA, Chung JI, Yoon PH, et al. Transient MR signal changes in patients with generalized tonicoclonic seizure or status epilepticus: periictal diffusion-weighted imaging. AJNR Am J Neuroradiol 2001;22:1149–1160 [PMC free article] [PubMed] [Google Scholar]
- 23.Hsu EW, Aiken NR, Blackband SJ. Nuclear magnetic resonance microscopy of single neurons under hypotonic perturbation. Am J Physiol 1996;27:1895–1900 [DOI] [PubMed] [Google Scholar]
- 24.Loubinoux I, Volk A, Borredon J, et al. Spreading of vasogenic edema and cytotoxic edema assessed by quantitative diffusion and T2 magnetic resonance imaging. Stroke 1997;28:419–426 [DOI] [PubMed] [Google Scholar]
- 25.Han BK, Lee M, Yoon HK. Cranial ultrasound and CT findings in infants with hypernatremic dehydration. Pediatr Radiol 1997;27:739–742 [DOI] [PubMed] [Google Scholar]
- 26.McKinstry RC, Miller JH, Snyder AZ, et al. A prospective, longitudinal diffusion tensor imaging study of brain injury in newborns. Neurology 2002;59:824–833 [DOI] [PubMed] [Google Scholar]
- 27.Barkovich AJ, Ali FA, Rowley HA, Bass N. Imaging patterns of neonatal hypoglycemia. AJNR Am J Neuroradiol 1998;19:523–528 [PMC free article] [PubMed] [Google Scholar]


