

Abstract
BACKGROUND AND PURPOSE: Postural headache most often occurs after lumbar puncture as post–lumbar puncture headache (PLPH) or, rarely, spontaneously as spontaneous intracranial hypotension headache (SIHH). In this prospective study, we used spinal MR imaging to determine the findings that would assist in the diagnosis of PLPH and SIHH and that would further our pathophysiological understanding of postural headache.
METHODS: The study group consisted of 15 healthy volunteers and 20 patients with postural headache: nine with SIHH and 11 with PLPH. The craniocervical junction and the cervical spine were studied using T2-weighted fast spin-echo and T1-weighted spin-echo sequences in the axial and sagittal planes. Follow-up studies were performed in 13 patients.
RESULTS: Dilatation of the anterior internal vertebral venous plexus was the most constant finding, present in 17 (85%) of 20 patients with postural headache. Spinal hygromas, whose location as subdural or epidural could not be exactly determined, were present in 14 patients (70%). A focal fluid collection was detected in the retrospinal region at the C1–C2 level in six patients with SIHH and in four patients with PLPH (50%). Tonsillar descent was detected in only one patient, and subtentorial hygroma in five patients. No abnormalities were found in the volunteers.
CONCLUSION: The MR signs of dilatation of the venous plexus, presence of spinal hygromas, and presence of retrospinal fluid collections can help to establish the diagnosis of intracranial hypotension. They are probably the result of decreased CSF volume, with the retrospinal fluid collections being a transudate from the venous plexus rather than frank extravasation. Resolution of these signs parallels resolution of the headache.
The International Headache Society defines a postural headache as one that occurs or worsens less than 15 minutes after assuming the upright position and that disappears or improves less than 30 minutes after resuming the recumbent position (1). Postural headache is usually associated with low intracranial pressure (1). Intracranial hypotension is most often the consequence of a lumbar puncture (2) and is rarely spontaneous (3, 4). Spontaneous intracranial hypotension headache (SIHH) (3), first described by Schaltenbrand in 1938 (5, 6), typically occurs without an obvious cause, but may follow minor trauma, such as sneezing, coughing, intercourse, or a minor fall (1). SIHH is thought to result from an occult CSF leak (7). Spontaneous spinal CSF leak has been found to be associated with the characteristic postural headache of SIHH (1, 4, 5, 7–16). Several investigators have studied patients with intracranial hypotension using MR techniques. The cranial MR imaging findings reported included diffuse pachymeningeal enhancement, subdural or epidural (extraarachnoid) fluid collections, and downward displacement of cerebral structures (1, 2, 4, 5, 7, 10–13, 15, 17–30). The spinal MR imaging findings included spinal dural enhancement, subdural/epidural (extraarachnoid) fluid collections, and dilated perineural root sleeves and meningeal diverticula (thought to be the site of the CSF leak) (1, 4, 5, 7, 10–12, 15, 20, 29–31). Using MR imaging, we conducted a prospective longitudinal study to identify the MR imaging signs associated with postural headache and to assess possible differences between the spontaneous and the post–lumbar puncture forms. If identified, these MR signs could be important in the diagnosis of postural headache and its differentiation from other diseases. Furthermore, the changes assessed by MR imaging could improve our understanding of the pathophysiological mechanisms involved in intracranial hypotension.
Methods
Patients and Volunteers
In patients and volunteers, written informed consent was obtained before the beginning of the study. Every patient was examined at least three times by two experienced neurologists. The first examination was performed in the acute phase of headache, the others during follow-up after improvement or relief of headache (Tables 1 and 2). In two patients, follow-up was performed during the headache phase, since the headaches had not resolved. Postural headache was defined according to a modification of the classification criteria established by the International Headache Society (1): pain had to develop within 60 seconds after sitting up and headache intensity had to be 70/100 or greater on a visual analogue scale (VAS) (32, 33) (Tables 1B and 2B). Patients were asked to use the VAS to subjectively rate the pain at the time of imaging and the degree of improvement in the pain since the initial scan on the VAS (32, 33).
TABLE 1A.
MR imaging findings in patients with spontaneous intracranial hypotension headache
Patients ranged in age from 23 to 59 years (mean age, 39 years). On the basis of the presumed cause of headache, patients were divided into two groups: one group with post–lumbar puncture headache (PLPH) (n = 11, nine women and two men) and the other with SIHH (n = 9, three woman and six men). In PLPH patients, the lumbar puncture had been performed to examine the CSF for suspected multiple sclerosis (n = 5), infection (n = 2), vasculitis (n = 1), borreliosis (n = 1), or lymphoma (n = 1), or to determine the cause of a painful paresis of the abducens nerve (n = 1).
Fifteen healthy volunteers (five women and 10 men) were included in the study as a control population. Volunteers ranged in age from 27 to 75 years (mean age, 41 years).
MR Imaging Sequences
Imaging was performed on a 1.5-T MR system. In all patients, the posterior fossa, craniocervical junction, and cervical spine were investigated in the standard (quadrature) neck array coil using four pulse sequences: 1) a sagittal T2-weighted fast spin-echo (FSE) sequence with parameters of 4200/112/3 (TR/TE/excitations), effective slice thickness = 3 mm, field of view (FOV) = 280 mm, matrix = 512 × 240, pixel size = 0.88 × 0.55 mm, interslice spacing = 0.1 mm, scan time = 3.51 minutes, a 90° excitation pulse, and a 180° refocusing pulse; 2) a sagittal T1-weighted spin-echo (SE) sequence with parameters of 587/12/4, effective slice thickness = 3 mm, FOV = 280 mm, matrix = 512 × 192, pixel size = 1.09 × 0.55 mm, flip angle = 180°, interslice spacing = 0.1 mm, and scan time = 4.10 minutes; 3) an axial T2-weighted FSE sequence with parameters of 5441/120/2, effective slice thickness = 4 mm, FOV = 180 mm, matrix = 256 × 240, pixel size = 0.75 × 0.70 mm, interslice spacing = 0.1 mm, scan time = 5.53 minutes, a 90° excitation pulse, and a 180° refocusing pulse; and 4) an axial T1-weighted SE sequence with parameters of 484/12/1, effective slice thickness = 4 mm, FOV = 240 mm, matrix = 512 × 307, pixel size = 0.78 × 0.47 mm, flip angle = 90°, interslice spacing = 0.1 mm, and scan time = 4.10 minutes.
Sagittal and axial contrast-enhanced T1-weighted sequences were obtained in seven patients (cases 2, 6, 7, 8, 9, 13, and 18). In two of these patients (case 8 and 9) we performed an additional flow-sensitive 2D fast low-angle shot (FLASH) sequence for venous MR angiography with parameters of 30/9, effective slice thickness = 3 mm, matrix = 224 × 256, flip angle = 50°, and FOV = 184 × 210 mm. Additionally, we performed a sagittal 3D constructive interference in the steady state (3D-CISS) sequence in four patients (cases 2, 7, 8, and 9) with parameters of 12.25/5.9/1, effective slice thickness = 0.8 mm, FOV = 300 mm, matrix = 512 × 256, pixel size = 1.06 × 0.59 mm, flip angle = 70°, and scan time = 9.24 minutes. The data set was reconstructed in an axial plane.
All 20 patients were studied during the acute phase of headache. In seven patients with SIHH and in six patients with PLPH, follow-up MR studies were obtained. In one patient (case 2), three follow-up studies were obtained (Tables 1 and 2).
Image Analysis
The images were analyzed independently by two experienced neuroradiologists who were not aware of the clinical features or of the time of the study (ie, whether it was the first study or the follow-up study). Each study was systematically analyzed for the presence of spinal subdural or epidural hygromas; a dilated spinal venous plexus (anterior internal vertebral venous plexus), its dimension, and its volume at a reference slice in the axial plane (C2 near the base of the dens); flow voids on axial T2-weighted FSE images; CSF leaks and their volume; and downward displacement of the cerebellar tonsils (≥ 5 mm) below the level of the foramen magnum (34).
The following dimensions of the venous plexus were determined: sagittal length (mean length of the craniocaudal extension of the venous plexus at its thickest part laterally on the right and left side in the sagittal plane), sagittal thickness (mean thickness of the venous plexus at its broadest diameter laterally on the right and on the left side in the sagittal plane), and axial thickness (mean thickness of the venous plexus at the level of C2 at the right and left lateral border and at the center of the vertebral body of C2 in the axial plane).
Quantitative analysis of the internal anterior vertebral venous plexus and the retrospinal fluid was performed by a neuroradiologist blinded to the subjects' data, including the time of investigation. For volume measurements, the DipsImage (xdispunc V4.5, University College London) was used. Surface and volume were assessed using a semiautomated local thresholding technique (DipsImage) described previously (35). Volume measurements were performed in 17 (85%) of the 20 patients in the acute phase and in 11 (85%) of the 13 patients in the follow-up phase. The data from five measurements (25%) were corrupted and could not be evaluated volumetrically. Distance measurements were obtained in all subjects.
Statistical Analysis
In the case of continuous variables, the Mann-Whitney U test was used to compare two samples. Differences within a sample between the acute and follow-up values of continuous data were analyzed using the Wilcoxon signed rank test for related samples. Distribution of categorical data of related and unrelated samples was compared using Fisher's exact test. All tests were performed two-tailed and were interpreted only in a descriptive manner. No confirmatory analysis was conducted. SAS software was used to calculate the P values.
Results
Group 1: Control Subjects
No abnormalities were detected in the volunteers. Specifically, we did not detect any hygromas, CSF leaks, or tonsillar descent. We did not detect any venous dilatation, but observed flow voids in six (40%) of the 15 volunteers. Dephasing CSF artifacts were detected on the axial T2-weighted FSE images, but these artifacts could always be distinguished from the venous plexus and its flow voids. The dura was always straight and was never elevated. The volume of the venous plexus at the C2 level ranged from 257 to 524 mm3 (mean, 412 mm3) on axial T2-weighted sequences. The mean length of the venous plexus in the sagittal plane was 20.9 mm in the craniocaudal direction and 2.1 mm in depth. The mean thickness in the axial plane at the level of C2 was 3.3 mm.
Group 2: Patients with SIHH
Nine (45%) of the 20 patients had SIHH. Clinical follow-up studies were performed in eight patients. MR follow-up examination was performed in seven (78%) of the nine patients 4 days to 5 months after the first study. One of these seven patients (case 8) had extensive cranial hygromas that were subsequently drained, thereby improving his headache. We therefore excluded his follow-up quantitative measurements from further analysis. The decrease in VAS values was significant. The initially severe headache resolved in three patients, became mild in one patient (case 1), and remained severe in two patients (cases 2 and 6, Table 1B).
Spinal Hygromas
In the acute study, six (67%) of the nine patients had long spinal hygromas in the cervical spine (Table 1A). We could not determine with certainty the exact location of the hygromas (ie, whether they were located in the epidural or subdural space), although it was our impression that they were located subdurally. The hygroma decreased on follow-up in two patients (cases 2 and 4) and remained unchanged in two patients (cases 6 and 8) (Table 1A).
In six patients (cases 2, 3, 6, 7, 8, and 9) an intracranial subdural fluid collection was detected at the level of the tentorium in the acute study (Figs 1A, 2A, and 3A). This finding resolved completely on the follow-up studies of two patients (cases 1 and 3, Figs 1E and 2B) and remained unchanged in another patient (case 6; for time course and details, see Table 1A).
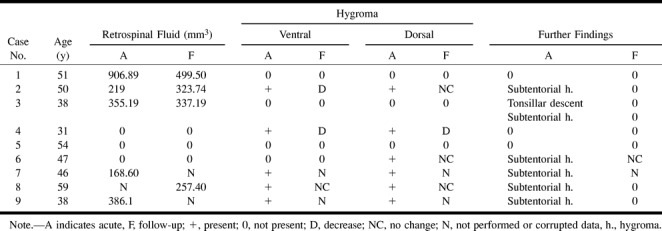
fig 1.
Case 2: 50-year-old patient with severe SIHH.
A–F, MR images obtained in the acute phase (A and B), after 6 weeks (C and D), and after 6 months (E and F).
A and B, Sagittal T2-weighted FSE (A) and T1-weighted SE (B) images reveal a retrospinal fluid collection, isointense with CSF, at the C1–C2 level (large arrowheads). The collection extends far into the suboccipital region (small arrowheads, A). A substantial hygroma is located subtentorially (arrows, A).
C and D, Sagittal (C) and axial (D) 3D-CISS images reveal a similar retrospinal fluid collection at the C1–C2 level (arrowheads) and a ventral and dorsal spinal hygroma (arrows, C). The retrospinal fluid collection also extends bilaterally (arrows, D).
E and F, Sagittal (E) and axial (F) 3D-CISS images show the retrospinal fluid collection (arrowhead, E). An additional extradural fluid collection can be seen bilaterally (arrows, F). The superior segment of the ventral spinal hygroma decreased in size (closed arrows, E), and the subtentorial hygroma resolved completely (open arrow, E).
Dilated Anterior Internal Vertebral Venous Plexus
The venous plexus was dilated in eight patients, revealed flow voids in eight patients, was convex in shape in seven patients, extended over the clivus in six patients, and always enhanced after the application of contrast material (Fig 3). One patient (case 7) had only flow voids with no other changes of the venous plexus (Table 1B). The flow voids were hypointense on T2-weighted sequences and hyperintense on flow-sensitive sequences (cases 8 and 9, Figs 3D and E). In two cases we observed a reciprocal relationship between the width of the dilated venous plexus and the width of the hygroma. While the venous plexus decreased, the hygroma increased in size from superior to inferior.
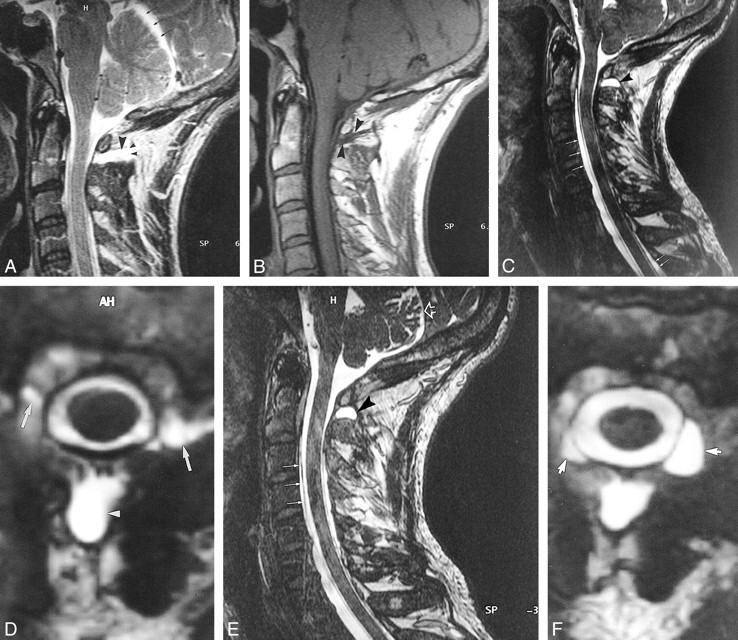
fig 3.
Case 9: 38-year old patient with SIHH. MR imaging was performed in the acute phase.
A–G, T2-weighted FSE images in the sagittal (A) and axial (D) planes reveal a retrospinal fluid collection (short thick arrow, A; arrowhead, D) and a subtentorial hygroma (thin double arrows, A). The anterior internal vertebral plexus is dilated, and large flow voids can be identified (long thick arrow, A; arrows, D). The flow voids of the dilated anterior internal vertebral plexus can be confirmed on corresponding axial slices obtained with a flow-sensitive 2D FLASH sequence (arrows, E). The dilated anterior internal vertebral plexus can also be identified on T1-weighted SE images in the sagittal (arrow, B) and axial (arrows, F) planes. The dilated anterior internal vertebral plexus is seen even better on contrast-enhanced T1-weighted SE images in the sagittal (arrow, C) and axial (arrows, G) planes.
The volume of the venous plexus at the C2 level ranged from 581 to 939 mm3 (mean, 755 mm3, Table 1B) and was significantly larger as compared with that in the control group (n = 6, P = .001). The mean length of the venous plexus in the sagittal plane was 52 mm in the craniocaudal direction and 6 mm in depth. The mean thickness in the axial plane at the C2 level was 6 mm. All these distances were significantly larger in the SIHH group than in the control group (n = 9, P < .005, Table 1B). In the follow-up studies, the three volumetric measurements and 13 of the 16 distance measurements decreased (Table 1B), although the difference was not significant.
CSF Leaks
In the acute study, six (67%) of the nine patients with SIHH (cases 1, 2, 3, 7, 8, and 9) had a circumscribed, almost rectangular fluid collection in the retrospinal region between C1 and C2. This collection was always isointense with CSF on T1- and T2-weighted sequences (Figs 1–3). The retrospinal fluid collection was always situated between the atlantooccipital membrane at the dorsal aspect of the posterior arch of the atlas and the rectus capitis posterior major and the obliquus capitis inferior. The mean volume of this fluid collection was 407 mm3 in the acute phase and 354 mm3 in the follow-up phase. In two patients (cases 1 and 3), the retrospinal fluid decreased on follow-up studies (Table 1A). The first patient (case 1) still reported a mild headache (VAS = 1–2), whereas the second patient (case 3) experienced complete relief of headache (VAS = 0). The third patient (case 2) had a chronic course of headache (VAS = 7). In this patient, the fluid collection increased in the follow-up studies (at 6 weeks and at 2 and 6 months) (Fig 1D) and extended farther laterally to both right and left sides in the third follow-up study (at 6 months) (Table 1A, Fig 1F).
Tonsillar Descent
In one patient (case 3), MR imaging of the craniocervical junction revealed downward displacement of the cerebellar tonsils 9 mm below the foramen magnum (Fig 2A). This displacement returned to normal on follow-up studies 1 month later when the patient had completely recovered from headache (Table 1A, Fig 2B).
fig 2.

Case 3: 38-year-old patient with SIHH.
A, Sagittal T2-weighted FSE MR image obtained in the acute phase shows a retrospinal fluid collection that can be identified at the C1–C2 level (short white arrows), a descent of the tonsils (curved black arrow), and subtentorial hygroma (long white arrows).
B, Sagittal T2-weighted FSE image obtained after 4 weeks reveals complete regression of the tonsillar descent (curved black arrow) and of the subtentorial hygroma (straight white arrows).
Group 3: Patients with PLPH
Eleven (69%) of the 16 patients had postpuncture headache. Clinical follow-up examination was performed in all patients and revealed complete resolution of the headache in all of them. The decrease in VAS values was significant. MR follow-up studies were performed in six (55%) of the 11 patients 4 days to 5 weeks after the initial evaluation.
Spinal Hygromas
Hygromas were identified in eight patients (73%) during the acute phase. Of the four patients in whom a follow-up investigation was performed, the hygromas regressed in three patients and remained unchanged in one (details and time course are given in Table 2A). None of these patients had a hygroma in the posterior fossa.
TABLE 2A.
MR imaging findings in patients with post–lumbar puncture headache
Dilated Anterior Internal Vertebral Venous Plexus
The plexus was dilated in nine patients, was convex in six patients, showed clear flow voids in six patients, extended over the clivus in four patients (Table 2B), and always enhanced after the application of contrast material.
The volume of the venous plexus at the C2 level ranged from 356 to 1125 mm3 (mean, 729 mm3, Table 2B) and was significantly larger as compared with that in the control group (n = 11, P = .0003). The mean length of the venous plexus in the sagittal plane was 37 mm in the craniocaudal direction and 5 mm in depth. The mean thickness in the axial plane at the level of C2 was 7 mm. All these distances were significantly larger in the PLPH group than in the control group (n = 11, P < .05). In the follow-up studies, the six volumetric measurements and 15 of the 18 distance measurements decreased (Table 2B). The decrease was significant for the volume as well as for the craniocaudal distance in the sagittal plane (P < .05).
Evaluating the follow-up studies of both groups (PLPH and SIHH) together revealed a significant decrease of all distance and volume measurements (P < .008).
CSF Leaks
During the acute phase of headache, four patients (36%) manifested a circumscribed, rectangular fluid collection in the retrospinal region between C1 and C2. In these four patients the retrospinal fluid collection was located between the atlantooccipital membrane at the dorsal aspect of the posterior arch of the atlas and the rectus capitis posterior major and the obliquus capitis inferior. The mean volume of this fluid collection was 134 mm3 in the acute phase in four patients and 12 mm3 in the follow-up phase in two patients. In these two patients, the headache resolved after 6 days (Table 2A).
Tonsillar Descent
No tonsillar displacement was detected in any of the 11 patients.
A comparison of the qualitative and quantitative data between the SIHH and PLPH groups revealed no significant differences between the two groups.
Discussion
In this prospective study we evaluated the craniocervical and spinal MR features associated with postural headache. We identified three MR findings. First, we detected a significant dilatation of the anterior internal vertebral venous plexus in 17 (85%) of the 20 patients; second, we identified hygromas in 14 patients (70%); and third, we found a circumscribed, retrospinal fluid collection between C1 and C2 in 10 patients (50%). Finally, in our series, tonsillar descent was detected in only one patient, even though it has been reported to occur in 33% to 75% of patients (20, 36). Follow-up studies revealed a significant decrease of the enlarged venous plexus and a decrease in the hygromas and the retrospinal fluid collection, which paralleled a significant decrease in the severity of the headache.
Intracranial Hypotension
Most if not all cases of intracranial hypotension are believed to result from CSF leakage or overdrainage (11, 12, 37). The leak may occur after lumbar puncture or after head trauma, with or without obvious CSF leak, such as otorrhea or rhinorrhea (2, 8, 10, 11, 29). The leak may also result from a tear in a spinal nerve root sheath, from a perineural cyst, or from a spinal arachnoid diverticulum (1, 2, 4, 10, 22, 29, 38). Leaks may also be observed in connection with overdraining ventricular shunts or spinal shunts (11, 12, 28, 29).
The syndrome of intracranial hypotension appears to result from decreased CSF volume and pressure (11). Mokri et al (11) found decreased CSF pressure only in 11 (46%) of 24 patients with intracranial hypotension, leading them to suggest that intracranial hypotension is more likely to result from a decrease in CSF volume than from a decrease in CSF pressure. He therefore introduced the term CSF hypovolemia (39).
SIHH is defined as a syndrome of reduced CSF pressure and volume, associated with postural headaches, that occurs in the absence of dural puncture, surgery, or trauma (4, 6, 7, 10, 13, 17, 40). The cause of SIHH is usually considered to be an occult CSF leak through small spinal meningeal defects in the arachnoid with a resultant decrease in CSF volume and pressure (4, 7, 10, 11, 17). The pathogenesis of spontaneous dural leakage is usually unknown. SIHH is thought to be caused by rupture of the arachnoid mater within the spine, with subsequent egress of CSF into the subdural or epidural space (5). In at least some patients, investigators have identified ruptured meningeal diverticula (4, 8, 10, 12, 38, 40), ruptured nerve root sleeves (5), or dilated nerve root sheaths that may predispose to small dural tears (4, 7, 10, 13, 16, 17, 38). In many patients, however, the CSF leak is diffuse, so the exact location of the presumed tear cannot be determined (10, 38). It has therefore been proposed that attenuated dura may allow CSF to seep into the extradural space intermittently (38).
Anterior Internal Vertebral Venous Plexus
Intense intracranial pachymeningeal enhancement is reported to occur commonly (in up to 100% of cases) in patients with intracranial hypotension (2, 7, 11, 13, 20, 22, 27, 29, 30, 41). This enhancement most likely results from dural vasodilatation and a greater concentration of contrast material in the dural microvasculature as well as in the interstitial fluid of the dura (7, 11, 13, 28). The basis for this assumption is the so-called Monro-Kellie rule, which states that the CSF volume fluctuates with the intracranial blood volume (7, 13, 20, 29, 30, 39). In the presence of an intact skull, and therefore constant intracranial volume, the Monro-Kellie hypothesis dictates that a decrease in CSF volume leads to compensatory vasodilatation in the brain and meninges (11, 42). Histologic confirmation of this meningeal dilatation has been obtained (29). The close connection between both the intracranial and the intraspinal venous systems makes it probable that dilatation of the cranial meninges will be associated with a dilatation of the intraspinal venous system; that is, the internal vertebral venous plexus (41).
We detected a dilatation of the anterior internal vertebral venous plexus in 85% of our patients (90% of those with SIHH and 82% of those with PLPH) (Fig 3). The quantitative measurements showed that the venous plexus was significantly enlarged in both patient groups as compared with a control population. This dilatation extended into the clivus in 50% of the patients (67% of those with SIHH and 36% of those with PLPH), causing an elevation of the dura at that level and confirming the close relationship between the intracranial basilar plexus and the intraspinal venous system (anterior internal vertebral venous plexus). The increase in volume of the venous plexus is paralleled by an increase in flow, reflected by the increase in flow voids from 40% in the control subjects to 70% in the patients. The prominence of the spinal venous dilatation, usually reflected by a convex shape, suggests that such a dilatation may be an important sign for establishing the diagnosis of intracranial hypotension by MR imaging.
Although the internal venous plexus is continuous throughout the spinal canal, it is noteworthy that the dilatation was always most prominent at the C1–C2 level. This increased distensibility could be related to a larger venous plexus and a reduced bony support at the C1–C2 level. The dilatation was best assessed on axial T2-weighted FSE images and on enhanced T1-weighted images. The T2-weighted sequence has the disadvantage of CSF dephasing artifacts. But these artifacts could always be differentiated from the flow voids in the venous plexus. Gradient-echo sequences have the advantage of reduced flow artifacts. Their disadvantage is an increase in susceptibility artifacts, difficulty in assessing the venous flow, and difficulty in evaluating the spinal cord. The latter was especially important in five of our PLPH patients, in whom multiple sclerosis was suspected. Flow-sensitive 2D FLASH sequences that were applied in two patients would have been ideal in determining the flow in the venous plexus, although a quantitative measurement would not have been possible. Flow is visualized as signal dropout on T2-weighted FSE sequences if the blood velocity ranges between 5 and 10 cm/s. It can be assumed that the flow velocity in this kind of vessel ranges between 5 and 10 cm/s. The sequence that we used has a TE of 120 milliseconds (112 for the sagittal plane) and a slice thickness of 4 mm (3 mm for the sagittal plane). If the blood is flowing at a velocity of 5 cm/s, the blood will flow a distance of 6 mm from the time of excitation to the echo. Thus, the blood will easily flow a distance greater than one slice thickness, resulting in a loss of signal (black blood). This is also true even for the more favorable case of a 4-mm slice thickness. For the purpose of this study, the T2-weighted sequence was therefore a compromise that enabled us to make a qualitative estimate of the venous plexus flow as well as an assessment of the spinal cord. Clearly, quantification will be necessary if an exact correlation between the venous flow and the clinical situation is warranted.
Finally, we showed that the dilated venous plexus significantly decreased in size in the follow-up examination, parallel to the decrease in the VAS values and parallel to the improvement in headache. If this is replicated in larger studies, dilatation of the venous plexus could be used as an objective parameter to monitor the evolution of headache.
Hygromas
Intracranial subdural hygromas are detected in 43% to 69% of patients with intracranial hypotension (2, 7, 20, 36). These hygromas are thought to result from decreased CSF volume and hydrostatic pressure changes (7, 11, 39). We detected similar fluid collections in the spine in 70% of our patients, most often in those with PLPH (73%; 8/11) (Fig 1C) and less often in those with SIHH (67%; 6/9). Thus, hygromas proved to be the second most common MR imaging finding in intracranial hypotension.
The exact location of the spinal hygromas has been difficult to determine. In some articles these hygromas have been reported to be epidural (5, 7, 10, 17, 39); in others, subdural (5, 11, 29, 39). Although it is possible that different compartments may be affected in different patients, the controversy as to their location might also reflect difficulty in interpreting the MR images. In our opinion, the shape and length of these hygromas favor a subdural location. Nonetheless, we chose to use the nonspecific term spinal hygroma in this study to avoid error.
The origin of the extraarachnoid fluid collection (hygroma) is uncertain. Cranial subdural fluid collections are believed to be due to hydrostatic changes in CSF (4, 7, 29, 30, 39), whereas spinal fluid collections have been attributed to CSF leakage (5, 7). Visualization of a communication between the extradural spinal collections and the thecal sac at CT myelography has been advanced to support the hypothesis of leakage (7).
The presence of a raised CSF protein concentration and a raised CSF cell count has led other groups to suggest that the extraarachnoid fluid represents a transudate caused by spinal meningeal hyperemia (1). The presence of contrast enhancement in this fluid after administration of contrast material reinforced these authors in their assumption (1). It seems plausible to us that both the intracranial and the intraspinal fluid collections could be of similar origin, related to a decreased CSF volume, with secondary dilatation of the dural, epidural, and paraspinal veins, leading to a transudate. The observation of a reciprocal relationship between the width of the dilated venous plexus and the width of the hygroma has two implications. First, it implies specific characteristics of the C1–C2 region. Apparently, the venous plexus is restricted in its propensity to dilate in most of the spinal canal, with the exception of the superior cervical segment, specifically, the C1–C2 region. Second, the observation indicates a balance between venous dilatation and hygroma formation. In accordance with the Monro-Kellie hypothesis, the intracranial volume should remain constant (11, 42). Owing to the connection between the intracranial volume and the intraspinal volume, the same rule should apply to the spinal canal. A decrease in CSF volume will therefore lead to an increase in the volume of other compartments, such as a dilatation of the venous plexus at the C1–C2 level, if possible. If this dilatation is restricted or not appropriate at other spinal levels, the increase in volume will be achieved through the development of a transudate out of the venous plexus into the adjacent subdural compartment, leading to the formation of hygromas. This assumption was confirmed by the fact that we never encountered a hygroma at the C1–C2 level, the site of the maximum dilatation of the venous plexus. Obviously, hygromas can occur at every level in which a spinal venous plexus is encountered (complete spinal canal) and in which the dilatation of the venous plexus is restricted. This assumption will have to be confirmed in further studies evaluating the brain as well as the spine in its complete length.
Retrospinal Fluid Collection at C1–C2
We detected a circumscribed fluid collection in the retrospinal region between C1 and C2 in six (67%) of nine patients with SIHH (Figs 1–3) and in four (36%) of 11 patients with PLPH. In all 10 subjects, the retrospinal fluid collection had the same shape. The fluid collection appeared isointense with CSF on T1- and T2-weighted images. In four patients, follow-up studies showed that the retrospinal fluid collection regressed as the headache resolved (Figs 2E and F), whereas it increased in one patient who continued to have a severe headache. Specific review of this region in a control population of 15 healthy volunteers studied in the same fashion showed no similar collection. The retrospinal fluid appears to correlate with symptomatic intracranial hypotension.
To the best of our knowledge, a similar finding has been reported to date in only one patient (9). A possible reason for underreporting such a finding might be related to the fact that the signal intensity of the retrospinal fluid collection is similar to that of muscle on T1-weighted sequences and similar to fat on T2-weighted FSE sequences. Therefore, the retrospinal fluid will only be detected when the two sequences are carefully compared with each other or when T2-weighted fat-suppressed sequences are used. Although we did not perform such sequences in this study, they might prove especially helpful for detecting the fluid collection we described.
Two possible theories can be advanced to explain the origin of this retrospinal fluid collection at C1–C2. First, the fluid collection might be due to CSF leakage (4, 10, 17, 22, 37–39), which could have been the case in our patients with SIHH. As such, we would have identified the occult CSF leak in 67% of our SIHH patients, suggesting that this location could represent a locus minoris resistantiae, prone to rupture and leakage. The vulnerability of the dura to shear stress could be related to the mobility of this segment, which is larger than all other segments, and to the fact that the dura lacks bony support over a distance that is longer than all other intervertebral spaces. The problem with such a straightforward explanation is that this fluid collection was also identified in 36% of patients with PLPH. In this case, we would have to postulate that these patients had SIHH (with the site of leakage located at the level of C1–C2) and that the headache started coincidentally after lumbar puncture. Alternatively, we would have to assume that the puncture changed the CSF mechanics, leading to a dural tear at the level of C1–C2 and causing extradural leakage. Both such assumptions appear untenable. Second, the retrospinal fluid collection could be a transudate resulting from hydrostatic pressure changes similar to those seen with cranial subdural fluid collections. Alteration in CSF pressure or volume would result in dilatation of the spinal veins and in production of an extraarachnoid transudate in the subdural or extradural space of the head or spine or behind the vertebral canal at the C1–C2 level.
Specific anatomic features may make the C1–C2 region especially prone to such a pathophysiological sequence. Anatomically, the retrospinal fluid collection was always located adjacent to the atlantoaxial membrane, in a circumscribed space, between C1 and C2 at, and to each side of, the midline posteriorly. This space is related to the meeting point of the superior and inferior suboccipital triangles (43–45) (Fig 4). The superior suboccipital triangle, located mainly at the occipitoatlantal interspace, extends as far as the C2 level. It is bounded by the rectus capitis posterior major muscle, the obliquus capitis superior muscle, and the obliquus capitis inferior muscle (43, 45). The floor of this triangle is formed by the posterior atlantooccipital membrane, the posterior arch of the atlas, and the atlantoaxial membrane (43–46). Immediately inferior to the superior suboccipital triangle, the inferior suboccipital triangle is delineated by the obliquus capitis inferior, the semispinalis, and the splenius cervicis muscles (45, 47) (Fig 4). These triangles contain among other structures very rich venous plexus, such as the suboccipital venous plexus, the vertebral artery venous plexus, the posterior external (superficial and deep) vertebral venous plexus, and the deep cervical vein (45) (Fig 4). The venous cushion, surrounding the atlantal part of the vertebral artery at the floor of the superior suboccipital triangle, has been termed the suboccipital cavernous sinus (45). This structure is connected to the jugular bulb and dural sinuses by mastoid and condylar emissary veins, which enable blood flow in both directions (48, 49). Moreover, anastomoses exist to both the suboccipital venous plexus and the posterior external venous plexus. The latter in turn is connected to the posterior internal venous plexus by a thick anastomotic vein through the atlantoaxial membrane (Fig 4). Consequently, a decrease in CSF volume may lead to both compensatory enlargement of the cerebral veins and enlargement of the veins mentioned. Furthermore, the suboccipital cavernous sinus is reported to contain an ampulloglomerular organ that is thought to be important in pressure regulation (50). The inferior suboccipital triangle contains the beginning of the twofold posterior external vertebral venous plexus, the vertebral venous plexus surrounding the upper cervical part of the vertebral artery, and the deep cervical vein. All components are connected to the suboccipital cavernous sinus in the superior suboccipital triangle (45) (Fig 4). They are thought to be involved in the regulation of intracranial pressure (45). The high density of venous structures, their proximity and functional connectivity with the cranial sinuses, and their presumed role in intracranial pressure regulation make it more likely that a substantial transudate could form in the suboccipital region than in other regions.
fig 4.

A, Posterior view of venous structures in suboccipital and upper cervical region. A, rectus capitis posterior major muscle; B, obliquus capitis superior muscle; C, obliquus capitis inferior muscle; D, semispinalis cervicis muscle; E, splenius cervicis muscle; F, atlantooccipital membrane; G, atlantoaxial membrane; H, dura;
SOVP, suboccipital venous plexus (note: slightly pulled up to visualize upper suboccipital triangle);
sPEVVP, superficial posterior external vertebral venous plexus;
DCV, deep cervical vein; PIVVP, posterior internal vertebral venous plexus; VA, vertebral artery; VV, vertebral veins; dPEVVP, deep posterior external vertebral venous plexus; VAVP, vertebral artery venous plexus; SOCS, suboccipital cavernous sinus; CEV, condylar emissary vein; MEV, mastoid emissary vein; I, atlas (posterior arch); II, axis (spinous process in A, body in B); asterisk, anastomotic vein.
B, Transverse section at the C1–C2 level. G, atlantoaxial membrane; H, dura; AIVVP, anterior internal vertebral venous plexus; IVV, intervertebral vein; PIVVP, posterior internal vertebral venous plexus; DCV, deep cervical vein; sPEVVP, superficial posterior external vertebral venous plexus; NL, nuchal ligament; dPEVVP, deep posterior external vertebral venous plexus; VA, vertebral artery; VAVP, vertebral artery venous plexus; LAAJ, lateral atlantoaxial joint; asterisk, anastomotic vein (between PIVVP and dPEVVP through G).
In our opinion, the occurrence of a fluid collection at the C1–C2 level in patients with PLPH makes the leakage theory less probable. Instead, a cascade of events could be assumed. Initially, venous plexus dilate wherever possible, mainly at the C1–C2 level to compensate for the decrease in CSF volume, thereby keeping the intraspinal volume constant in accordance with the Monro-Kellie assumption. If the dilatation of the venous plexus is restricted, or not sufficient, transudate collects subdurally in the corresponding segments. In this context, the specific anatomic characteristics of the C1–C2 level are unique in enabling this segment to preserve its volume just by dilating the veins. The transudate that is formed all over the venous plexus is at the C1–C2 level (in contrast to the other segments), is not necessary to maintain the volume balance, and therefore collects into the retrospinal region. These assumptions will have to be confirmed in further longitudinal studies evaluating the brain as well as the spine in its complete length. Finally, the application of different sequences, such as T2-weighted, proton-density–weighted, and fluid-attenuated inversion-recovery sequences, could help differentiate CSF exudate from transudate.
Conclusion
In patients with postural headache, MR imaging reveals dilatation of the anterior internal vertebral venous plexus (85%), subdural hygromas (70%), and extraspinal fluid collections at the C1–C2 level (50%). These three findings may assist in establishing the diagnosis of intracranial hypotension. The origin of the retrospinal fluid collection at the C1–C2 level has not yet been determined, but its detection in patients with PLPH favors the concept that the fluid within the collection represents transudate, not leakage. Taken together, all three signs could be the result of, and the response to, a decreased CSF volume. Regression of these signs parallels regression of the postural headache.
TABLE 1B.
MR imaging findings in patients with spontaneous intracranial hypotension headache
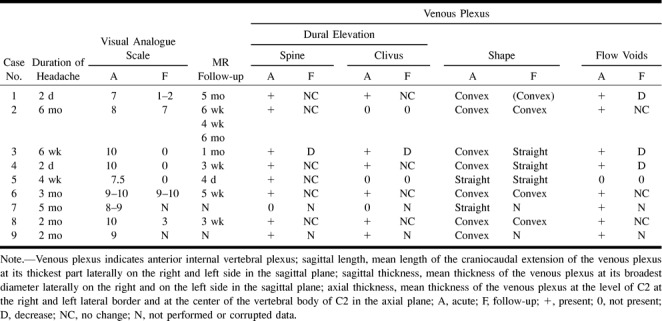
TABLE 1B:
Extended
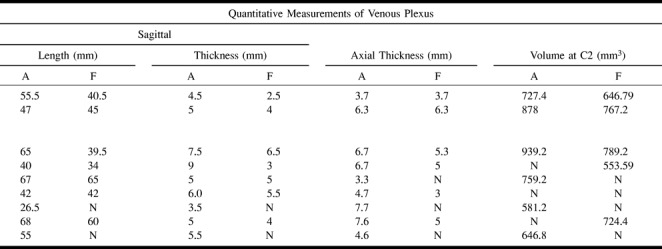
TABLE 2B:
MR imaging findings in patients with post–lumbar puncture headache
>TABLE 2B:
TABLE 2B: Extended
Acknowledgments
We thank U. D. Schmid (Neurosurgical Unit, Klinik Im Park, Zürich, Switzerland) for his assistance in performing the study and revising the manuscript, M. Emple (Department of Neurology) for recruiting and examining the patients, and H. Brückmann (Department of Neuroradiology Ludwig-Maximilians Universität) for revising the manuscript. We also thank M. Horsfield (Department of Physics, University of Leicester, UK) for his advice in sequence configuration and S. Lange and H. Niggemann (Institute of Microtherapy, University of Witten-Herdecke) for the statistical evaluation. Finally, we thank H. Rust (Department of Anatomy, Ludwig-Maximilians Universität) for the detailed anatomic drawings.
Footnotes
Address reprint requests to Tarek A. Yousry, MD, Department of Neuroradiology, Klinikum Grosshadern, Marchioninistr. 15, D-81377 Munich, Germany.
References
- 1.Renowden S, Gregory R, Hyman N, Hiton-Jones D. Spontaneous intracranial hypotension. J Neurol Neurosurg Psychiatry 1995;59:511-515 [DOI] [PMC free article] [PubMed] [Google Scholar]
- 2.Pannullo S, Reich J, Krol G, Deck M, Posner J. MRI changes in intracranial hypotension. Neurology 1993;43:919-926 [DOI] [PubMed] [Google Scholar]
- 3.Benzon HT, Nemickas R, Molloy RE, Ahmad S, Melen O, Cohen B. Lumbar und thoracic epidural blood injections to treat spontaneous intracranial hypotension. Anesthesiology 1996;85:920-922 [DOI] [PubMed] [Google Scholar]
- 4.Rando T, Fishman R. Spontaneous intracranial hypotension: report of two cases and review of the literature. Neurology 1992;42:481-487 [DOI] [PubMed] [Google Scholar]
- 5.Moayeri N, Henson J, Schaefer P, Zervas N. Spinal dural enhancement on magnetic resonance imaging associated with spontaneous intracranial hypotension. J Neurosurg 1998;88:912-918 [DOI] [PubMed] [Google Scholar]
- 6.Schaltenbrand G. Neuere Anschauungen zur Pathophysiologie der Liquorzirkulation. Zentralbl Neurochir 1938;3:290-299 [Google Scholar]
- 7.Rabin B, Roychowdhury S, Meyer J, Cohen B, LaPat K, Russell E. Spontaneous intracranial hypotension: spinal MR findings. AJNR Am J Neuroradiol 1998;19:1034-1039 [PMC free article] [PubMed] [Google Scholar]
- 8.Davenport R, Chataway S, Warlow C. Spontaneous intracranial hypotension from a CSF leak in a patient with Marfan's syndrome. J Neurol Neurosurg Psychiatry 1995;59:516-519 [DOI] [PMC free article] [PubMed] [Google Scholar]
- 9.Kasner S, Rosenfeld J, Farber R. Spontaneous intracranial hypotension: headache with reversible Arnold-Chiari malformation. Headache 1995;35:557-559 [DOI] [PubMed] [Google Scholar]
- 10.Schievink W, Meyer F, Atkinson J, Mokri B. Spontaneous spinal cerebrospinal fluid leaks and intracranial hypotension. J Neurosurg 1996;84:598-605 [DOI] [PubMed] [Google Scholar]
- 11.Mokri B, Piepgras D, Miller G. Syndrome of orthostatic headaches and diffuse pachymeningeal gadolinium enhancement. Mayo Clin Proc 1997;72:400-413 [DOI] [PubMed] [Google Scholar]
- 12.Mokri B, Hunter S, Atkinson J, Piepgras D. Orthostatic headaches caused by CSF leak but with normal CSF pressures. Neurology 1998;51:786-790 [DOI] [PubMed] [Google Scholar]
- 13.Fishman R, Dillon W. Dural enhancement and cerebral displacement secondary to intracranial hypotension. Neurology 1993;43:609-611 [DOI] [PubMed] [Google Scholar]
- 14.Weitz S, Drasner K. Spontaneous intracranial hypotension. Anesthesiology 1996;85:923-925 [DOI] [PubMed] [Google Scholar]
- 15.Samii C, Möbius E, Weber W, Heienbrok H, Berlit P. Pseudo Chiari type I malformation secondary to cerebrospinal fluid leakage. J Neurol 1999;246:162-164 [DOI] [PubMed] [Google Scholar]
- 16.Ali S, Cesani F, Zuckermann J, Nusynowitz M, Chaljub G. Spinal-cerebrospinal fluid leak demonstrated by radiopharmaceutical cisternography. Clin Nucl Med 1998;23:152-155 [DOI] [PubMed] [Google Scholar]
- 17.Fitzgerald L, Sandlin P, Carrier D, Grossman R. Spontaneous intracranial hypotension: myelographic findings (case illustration). J Neurosurg 2000;92:188. [DOI] [PubMed] [Google Scholar]
- 18.Blank S, Shakir R, Bindoff L, Bradey N. Case report: spontaneous intracranial hypotension: clinical and magnetic resonance imaging characteristics. Clin Neurol Neurosurg 1997;99:199-204 [DOI] [PubMed] [Google Scholar]
- 19.O'Carroll C, Brant-Zawadzki M. The syndrome of spontaneous intracranial hypotension. Cephalgia 1999;19:80-87 [DOI] [PubMed] [Google Scholar]
- 20.Christoforidis B, Mehta B, Landi J, Czarnecki E, Piaskowski R. Spontaneous intracranial hypotension: report of four cases and review of the literature. Neuroradiology 1998;40:636-643 [DOI] [PubMed] [Google Scholar]
- 21.Hochman M, Naidich T, Kobetz S, Fernandez-Maitin A. Spontaneous intracranial hypotension with pachymeningeal enhancement on MRI. Neurology 1992;42:1628-1630 [DOI] [PubMed] [Google Scholar]
- 22.Atkinson J, Weinschenker B, Miller G, Piepgras D, Mokri B. Acquired Chiari I malformation secondary to spontaneous spinal cerebrospinal fluid leakage and chronic intracranial hypotension syndrome in seven cases. J Neurosurg 1998;88:237-242 [DOI] [PubMed] [Google Scholar]
- 23.Sato Y, Honda Y, Maruoka H, Kunoh H, Oizumi K. Subdural hematoma following disappearance of orthostatic headache and pressure normalization in two patients with spontaneous intracranial hypotension. Cephalalgia 1998;18:60-63 [DOI] [PubMed] [Google Scholar]
- 24.Amor S, Maeder P, Gudinchet F, Duc C, Ingvar-Maeder M. Syndrome d'hypotension intracranienne spontanée. Rev Neurol (Paris) 1996;152:611-614 [PubMed] [Google Scholar]
- 25.Rohr-Le-Floch J, Gauthier G. Hypotension spontanée du liquide céphalo-rachidien: intéret de l'IRM cérébrale. Schweiz Med Wochenschr 1993;123:982-986 [PubMed] [Google Scholar]
- 26.Canellas R, Lopez C, Isern G, Gaerin M. Postcontrast dural MR enhancement and acute CSF intracranial hypotension. J Comput Assist Tomogr 1995;19:1008-1009 [DOI] [PubMed] [Google Scholar]
- 27.Berlit P, Berg-Dammer E, Kuehne D. Abducens nerve palsy in spontaneous intracranial hypotension. Neurology 1994;44:1552. [DOI] [PubMed] [Google Scholar]
- 28.Hochman M, Naidich T. Diffuse meningeal enhancement in patients with overdraining, long-standing ventricular shunts. Neurology 1999;52:406-409 [DOI] [PubMed] [Google Scholar]
- 29.Mokri B, Parisi J, Scheithauer B, Piepgras D, Miller G. Meningeal biopsy in intracranial hypotension: meningeal enhancement on MRI. Neurology 1995;45:1801-1807 [DOI] [PubMed] [Google Scholar]
- 30.Brightbill T, Goodwin R, Ford R. Magnetic resonance imaging of intracranial hypotension syndrome with pathophysiological correlation. Headache 2000;40:292-299 [DOI] [PubMed] [Google Scholar]
- 31.Vakharia SB, Thomas PS, Rosenbaum AE, Wasenko JJ, Fellows DG. Magnetic resonance imaging of cerebrospinal fluid leak and tamponade effect of blood patch in postdural puncture headache. Anesth Analg 1997;84:585-590 [DOI] [PubMed] [Google Scholar]
- 32.Katz J, Melzack R. Measurement of pain. Surg Clin North Am 1999;79:231-252 [DOI] [PubMed] [Google Scholar]
- 33.Skovlund E, Flaten O. Response measures in the acute treatment of migraine. Cephalalgia 1995;15:519-522 [DOI] [PubMed] [Google Scholar]
- 34.Mikulis DJ, Diaz O, Egglin TK, Sanchez R. Variance of the position of the cerebellar tonsils with age: preliminary report. Radiology 1992;183:725-728 [DOI] [PubMed] [Google Scholar]
- 35.Filippi M, Horsfield MA, Tofts PS, Barkhof F, Thomson AJ, Miller DH. Quantitative assessment of MRI lesion load in monitoring the evolution of multiple sclerosis. Brain 1995;118:1601-1612 [DOI] [PubMed] [Google Scholar]
- 36.Dillon W, Fishman R. Some lessons learned about the diagnosis and treatment of spontaneous intracranial hypotension. AJNR Am J Neuroradiol 1998;19:1001-1002 [PubMed] [Google Scholar]
- 37.Schievink W, Tourje J. Intracranial hypotension without meningeal enhancement on magnetic resonance imaging. J Neurosurg 2000;92:475-477 [DOI] [PubMed] [Google Scholar]
- 38.Schievink W, Morreale V, Atkinson J, Meyer F, Piepgras D, Ebersold M. Surgical treatment of spontaneous spinal cerebrospinal fluid leaks. J Neurosurg 1998;88:243-246 [DOI] [PubMed] [Google Scholar]
- 39.Mokri B. Spontaneous cerebrospinal fluid leaks: from intracranial to cerebrospinal fluid hypovolaemia: evolution of a concept. Mayo Clin Proc 1999;74:1113-1123 [DOI] [PubMed] [Google Scholar]
- 40.Schievink W, Reimer R, Folger W. Surgical treatment of spontaneous intracranial hypotension associated with spinal arachnoid diverticulum. J Neurosurg 1994;80:736-739 [DOI] [PubMed] [Google Scholar]
- 41.Clarot F, Callonec F, Douvrin F, et al. Giant cervical epidural veins after lumbar puncture in a case of intracranial hypotension. AJNR Am J Neuroradiol 2000;21:787-789 [PMC free article] [PubMed] [Google Scholar]
- 42.Andeweg J. Consequences of the anatomy of deep venous outflow from the brain. Neuroradiology 1999;41:233-241 [DOI] [PubMed] [Google Scholar]
- 43.Warwick R, Williams PL. Gray's Anatomy. 35th ed. Edinburgh: Longman; 1973:513–514
- 44.Sieglbauer F. Lehrbuch der normalen Anatomie des Menschen. 9th ed. Innsbruck: Urban und Schwarzenberg; 1963:213
- 45.Arnautovic KI, Al-Mefty O, Pait TG, Krisht AF, Husain MM. The suboccipital cavernous sinus. J Neurosurg 1997;86:252-262 [DOI] [PubMed] [Google Scholar]
- 46.Arnautovic KI, Pernkopf Anatomie: Atlas der topographischen und angewandten Anatomie des Menschen. 3rd ed. Munich: Urban und Schwarzenberg; 1987:284
- 47.Lang J. Clinical Anatomy of the Cervical Spine. Stuttgart: Thieme; 1993:135
- 48.Clemens HJ. Die Venensysteme der menschlichen Wirbelsäule: morphologie und funktionelle Bedeutung. Berlin: Walter De Gruyter; 1961:19–57
- 49.Töndury G. Angewandte und topographische Anatomie: ein Lehrbuch für Studierende und ärzte. 4th ed. Stuttgart: Thieme; 1970:262–263
- 50.Parke WW, Valsamis MP. The ampulloglomerular organ: an unusual neurovascular complex in the suboccipital region. Anat Rec 1967;159:193-198 [DOI] [PubMed] [Google Scholar]