Abstract
BACKGROUND AND PURPOSE: Prediction of the regions of the ischemic penumbra that are likely to progress to infarction is of great clinical interest. Whether lowered apparent diffusion coefficient (ADC) values were present in the ischemic penumbra of patients presenting with acute ischemic stroke and were specific to regions of the penumbra that proceeded to infarction was investigated.
METHODS: Nineteen patients with hemispheric stroke of less than 6 hours' onset and with acute scans showing a perfusion lesion greater than a diffusion lesion (ischemic penumbra) were studied. Scans also were performed subacutely (days 3 to 5) and at outcome (day 90). The outcome scan was used to identify regions of the penumbra that proceeded to infarction.
RESULTS: The ADC ratios were significantly reduced (P < .00001) in regions of the penumbra that progressed to infarction on the outcome scan compared with those that remained normal. In regions that showed transition to infarction, the mean ADC ratios were typically 0.75 to 0.90.
CONCLUSION: Intermediate ADC values are present in the ischemic penumbra and are indicative of tissue at risk of infarction.
Prediction of tissue that will proceed to infarction has been one of the major challenges of stroke research (1). The ability to identify tissue at risk of infarction would have great impact on treatment decisions. By combining MR diffusion and perfusion maps, patients with potentially salvageable tissue, as defined by a perfusion-weighted imaging lesion greater than a diffusion-weighted imaging abnormality, can be delineated (2–4). Not all patients with this putative ischemic penumbra, however, show extension of the infarct on follow-up scans. These MR measurements alone do not identify the subset of penumbral patients who will show expansion of the diffusion abnormality on subsequent scans. They do not identify which regions of the penumbra are truly at risk of infarction. The evolution of tissue to infarction is a dynamic process dependent on many physiological factors, including fluctuations in blood pressure, embolic fragmentation, and reperfusion.
Our aim was to investigate one factor that might be important in predicting the transition to infarction.
We retrospectively investigated ADC maps of patients presenting with acute ischemic stroke to determine whether intermediate ADC values were present in the ischemic penumbra and were specific to regions of the penumbra that proceeded to infarction.
Methods
Patients
Patients with acute hemispheric stroke presenting within 6 hours of symptom onset were prospectively recruited from the Stroke Service of the Royal Melbourne Hospital from January 1998 to June 2000. They form a subset of a much larger data base of patients collected over the same period. Nineteen patients with stroke onset of less than 6 hours showed a perfusion/diffusion mismatch and are the subjects of this study. Stroke onset was defined as the last time the patient was known to be without neurologic deficit. Both perfusion and diffusion imaging were performed within 6 hours of stroke onset in all patients. Scans also were obtained at days 3 to 5 (subacute study) and at day 90 (outcome study) in all surviving patients. Outcome clinical assessment was measured with the National Institutes of Health Stroke Scale on the same day as the outcome MR study. A neurologist or a neurology resident who was blinded to the MR studies and who was certified in performing the scale assessed all patients.
Exclusion criteria included the presence of cerebral hemorrhage, preexisting significant neurologic deficit, or a history of stroke, which would hamper interpretation of clinical and radiologic data. There were no age, sex, handedness, or prior therapy exclusions. The study was performed with the approval of our institution's ethics committee, and written informed consent was obtained from all patients or their next of kin.
Imaging
All MR images were obtained with a 1.5-T GE Signa equipped with echo-planar capabilities (Signa Horizon SR 120; General Electric Medical Systems, Milwaukee, WI). Sequences were performed in the same order with an initial T1-weighted sagittal localizer, a diffusion-weighted sequence, a perfusion-weighted sequence, a T2-weighted fast spin-echo sequence (3000/102/1 [TR/TE/excitation]), an echo-planar spin-echo sequence (3000/100 [TR/TE], 16 shot), and phase-contrast MR angiography (36/min TE; 30-degree flip; velocity encoding, 70). Imaging time was approximately 20 minutes.
Diffusion-weighted images were obtained using a multisection, single-shot spin-echo echo-planar imaging sequence with the Stejskal-Tanner diffusion-encoding method (5). Section thickness was 6 mm with a gap of 1 mm. The number of sections was set to include the whole brain (average, 16). Matrix size was 256 × 128 (6000/107/1 [TR/TE/excitation]). Diffusion gradient strength was varied between 0 and 22 mT/m, resulting in three b values of increasing magnitude from 0 to 1000 s/mm2. The diffusion gradients were applied in three orthogonal directions (x, y, z). Scanning time was 1 minute 18 seconds.
Perfusion-weighted images were obtained following administration of a bolus of gadopentetate dimeglumine (0.2 mmol;clkg) delivered via a large-bore cannula in the antecubital fossa. The injection was performed at a speed of 5 mL/s with MR-compatible power injector imaging and followed by a 15-mL bolus of saline. An echo-planar imaging gradient-echo sequence at 2000/70/1 (TR/TE/excitation) and flip angle of 60 degrees was used. Twelve sections were obtained, centered on the diffusion-weighted imaging lesion. Section thickness was 6 mm with a 1-mm gap (matrix, 256 × 128; field of view, 40 × 20 cm). Images were obtained at 40 time points per section with a scanning time of 1 minute 21 seconds.
Image Processing
Postprocessing of images was performed on a UNIX workstation using customized software developed in interactive data language. The x, y, and z diffusion images were used to form the isotropic diffusion map (6), and the trace of the tensor was calculated to form the ADC maps (6) . Motion and distortion artifacts were detected in a cine mode between images of different b values in each direction and between images of the same b value in different directions. The diffusion imaging signal intensity attenuation curve was also dynamically checked, particularly in the regions of interest. Any individual image with noticeable artifacts was excluded from the fitting process for the calculation of the ADC map (7).
Perfusion maps were generated by processing the signal intensity time curve of the magnetic susceptibility effect of the bolus as it passed through the brain on a pixel-by-pixel basis, to produce maps of the time-to-bolus peak (TTP) (8). The TTP maps were used to assess perfusion deficits, as they give the most visually distinct borders and result in lesions of greater volume than the other hemodynamic parameter maps (9, 10).
Data Analysis
Analysis of the data was performed using MEDx software. All patients had ischemic penumbras. Comparison with the outcome scan, or the subacute scan (when outcome not available), was done to identify the regions of the penumbra on the acute scan that proceeded to infarction and the regions that remained normal. For each patient, one to two sections of the acute scan were then examined in detail so that the largest regions of penumbral infarction (expansion group) and penumbral preservation (no-expansion group) were sampled for each patient. When there was no infarct expansion, only a region of penumbral preservation was examined. When the infarct expanded completely into the penumbra, only a region of penumbral expansion could be sampled. When an initial diffusion abnormality was present on the same section, it also was examined. Cerebrospinal fluid was excluded from the sections for examination by using a segmentation algorithm.
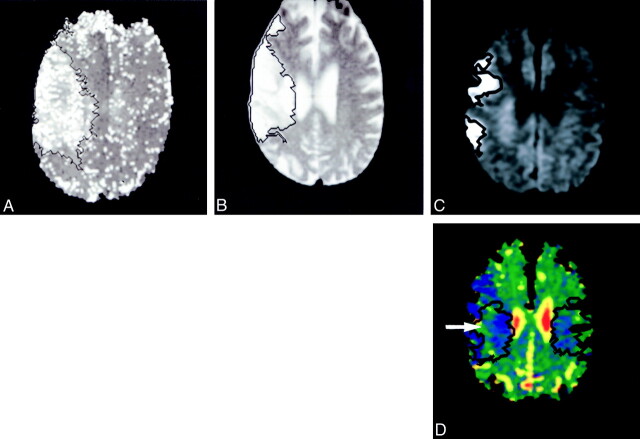
Region-growing techniques were used to obtain objective computer-generated outlines of the acute diffusion-weighted imaging lesion, acute TTP lesion, and the outcome (or subacute) lesion. A seed value was selected from a region of increased signal intensity in the lesion, and a normal pixel was selected from outside the lesion. Templates of these regions were then projected onto the acute ADC map. Regions with and without expansion of the penumbra were generated (Fig 1). Measurements of the mean, median, standard deviation, area, and histogram analysis of the ADCs in these regions were made. The mean, median, standard deviation, and area of the ADCs of the acute diffusion-weighted imaging lesion were measured. The templates of the regions were then reflected about the midline axis of the brain, and the same measurements were made in the normal contralateral hemisphere. When the template extended beyond the gray and white matter (due to slight asymmetry of the sections) the region was regrown to provide a more accurate measure of the comparative region in the normal hemisphere (Fig 1).
fig 1.
Regions of abnormality were identified on the TTP (A), T2 outcome (B), and the acute diffusion-weighted scans (C) using region-growing techniques. These were transferred on to the acute ADC map (D), and the region of expansion of the infarct was generated (black outline, right). The region was reflected about the midline axis and regrown to enclose just brain tissue (D, two black regions, left). The region of infarct expansion has reduced ADCs (D, white arrow) compared with the contralateral region and hazy, subtle change on the diffusion-weighted images (C, black arrow)
Patients who have just had a stroke, particularly those with large infarcts, are often confused and liable to move between sequences. Where patient motion had occurred between the acute diffusion-and perfusion-weighted sequences, realignment of the midline axis was performed for in-plane rotation. When out-of-plane motion had occurred (two patients), examination of multiple sections was necessary to ensure adequate matching of anatomic boundaries in the contralateral hemisphere.
All measures are reported as mean ± standard deviations. Student t tests were used to compare data sets. Results were considered significant at the 5% level.
Results
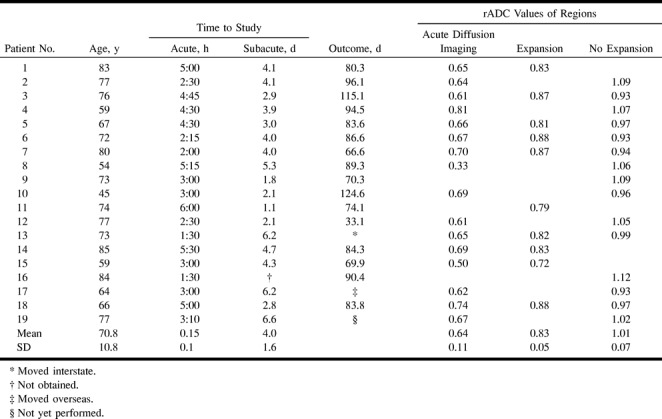
Nineteen patients scanned within 6 hours of stroke onset and with a perfusion-weighted imaging lesion greater than a diffusion-weighted imaging lesion are presented. They included eight men and 11 women, and their mean age was 70.8 years (range, 45 to 85 years). The mean time to MR imaging was 3 hours 30 minutes (range, 1 hour 30 minutes to 6 hours). A summary of their demographic data and imaging data is presented in the Table.
Sixteen acute diffusion-weighted imaging lesions were examined (mean area, 4.74 cm2; SD, 4.54 cm2), and there were 10 regions of expansion (mean area, 10.58 cm2; SD, 7.44 cm2) and 15 regions without expansion (penumbral preservation; mean area, 5.76 cm2; SD, 6.66 cm2).
The mean ADC values of regions were compared with the values in the contralateral normal hemisphere and expressed as an ADC ratio (rADC) of the region (Table).
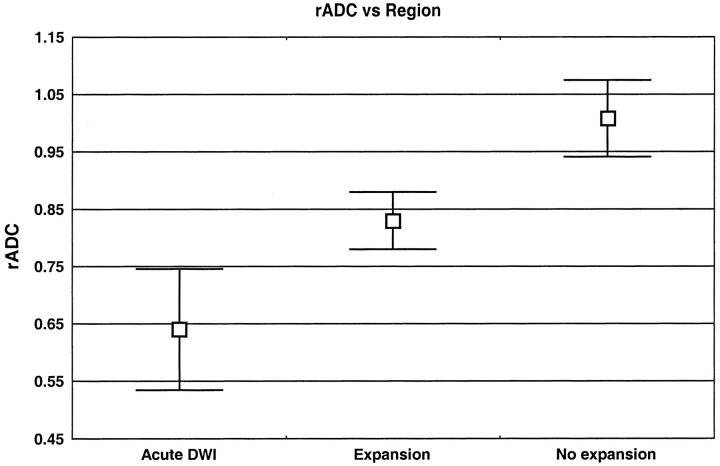
The mean rADC in the acute diffusion-weighted imaging lesion was 0.65 ± 0.11, which represents a decrease of approximately 35% from the normal side (range, 0.33 to 0.81). All values, except the 0.81, were below 0.75; the high value was from a small lesion of the basal ganglia. Previous workers have shown that ADC decreases are less marked in pure gray matter (11).
The mean rADC in regions of the penumbra that went on to infarction was 0.83 ± 0.05, with all values being less than 0.90. Regions of the penumbra that were preserved (no expansion) showed a higher mean rADC (1.01 ± 0.07), with all values being greater than 0.90 (Table, Fig 2).
fig 2.
Graph of mean rADC against region
Comparison of the rADC values in the different regions was significant for all comparisons. Both the expansion and no-expansion regions were different from the region of abnormality on the initial diffusion-weighted image (P < .00001 and P < .00001, respectively). Comparison of the rADC values in the expansion and no-expansion regions of the penumbra also was highly significant (P < .00001). These results show that, in the cases studied, intermediate rADC values (approximately 0.75–0.90) were associated with regions of the penumbra that later proceeded to infarction.
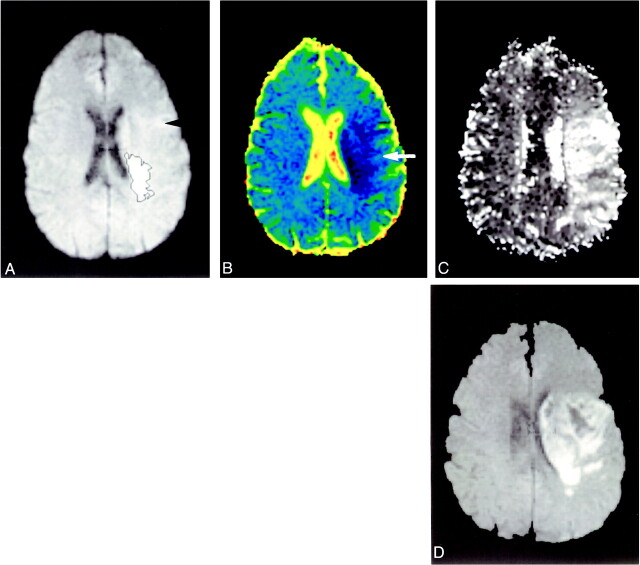
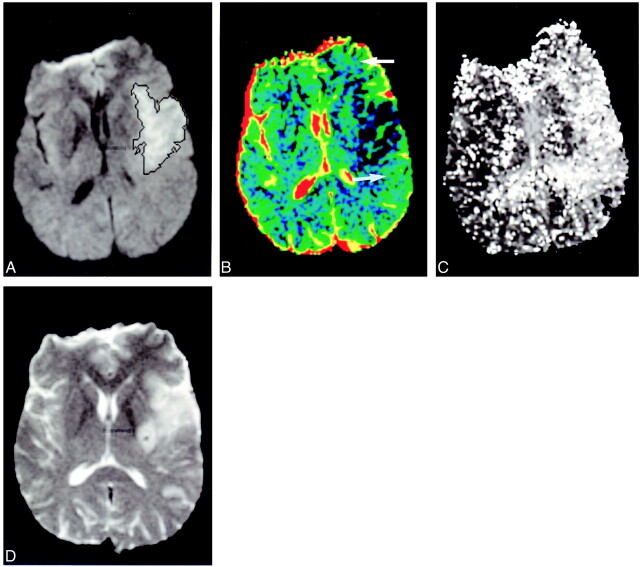
These regions of intermediate ADC values are difficult to identify on black-and-white diffusion-weighted images and are more easily seen on color ADC maps (Fig 3). They correspond to regions of subtle, hazy signal change on the diffusion-weighted images. When there was no expansion of the infarct into the penumbra, no such intermediate ADCs were found, and the acute diffusion-weighted imaging showed no hazy change (Fig 4).
fig 3.
Infarct expansion. Patient 13 presented 1 hour 30 minutes, after stroke onset. Acute diffusion-weighted images (A) show small region of hyperintensity (black outline). There was a large area of altered perfusion on the TTP map (C). Extensive regions of lowered ADC values are seen on the colored ADC map (B, white arrow) in the regions that progress to infarction (D, subacute scan). (Outcome scan was not available for this patient.) In retrospect, hazy, ill-defined change is seen on the acute diffusion-weighted image (A, black arrowhead)
fig 4.
Minor infarct expansion. Patient 10 presented 3 hours after stroke onset. The initial diffusion-weighted imaging lesion (A) was well defined and only minimally underestimated the final infarct size of the outcome scan (D). A large region of altered perfusion was present on the TTP (C). The larger regions of penumbral preservation show normal ADC values (B, white arrows)
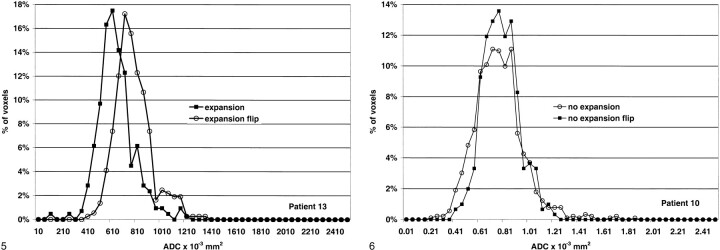
Histogram analysis was performed to obtain more information about the distribution of the voxel values in the expansion and no-expansion regions. The ADC values of the expansion region for patient 13 showed a downward shift compared with the contralateral side (Fig 5). By comparison, the distribution of the ADC values for the no-expansion region of patient 10 more closely matched that of the normal side (Fig 6). Similar changes were found for each of the expansion and no-expansion regions.
fig 5.
Histogram analysis of the region of infarct expansion (expansion) and the same region in the normal hemisphere (expansion flip) for patient 13. The curve is shifted to the left with a reduction in the mean ADC value.fig 6. Histogram analysis of the region of penumbral preservation (no expansion) and the comparative region in the normal hemisphere (no expansion flip) for patient 10. The curves are similar
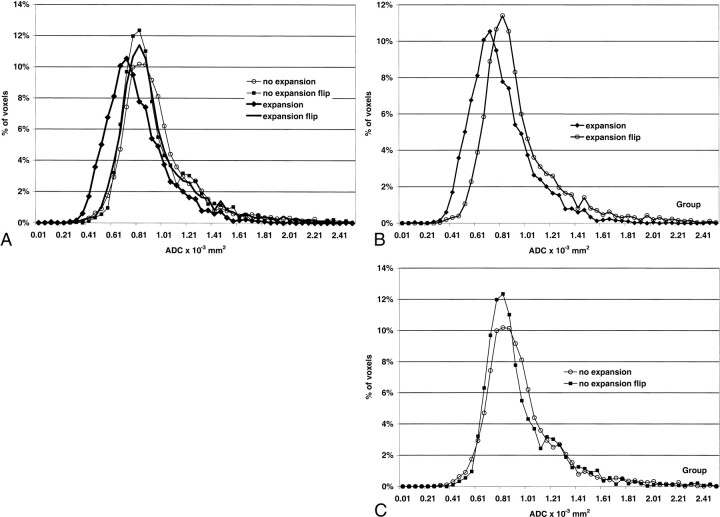
Grouped histogram analysis of the data standardized to area and showing percentage of voxels in the region against ADC values showed overlapping curves for the regions examined in the normal brain (reflections of the expansion and no-expansion regions) as well as the no-expansion region in the affected hemisphere. Mean values in the normal brain were 0.94 × 10⁻³ mm2; in the penumbral regions without expansion, 0.95 × 10⁻³ mm2. The grouped ADC values for the regions of expansion demonstrated a downward shift in ADCs and a reduced mean ADC value of 0.79 × 10⁻³ mm2 (Fig 7). This represented a decrease of 16% in the mean and coincided with the reduction of 17% predicted from the analysis of the rADC values of the regions.
fig 7.
Grouped data.
A, All regions. Only the region of infarct expansion shows a different distribution of ADC values.
B, The regions of infarct expansion have lowered ADC values compared with similar regions in the normal hemisphere.
C, The distribution of the ADC values in regions of penumbral preservation is the same as in the contralateral hemisphere.
Discussion
The main finding of this study is the presence of intermediate rADC values in the penumbral regions of infarct expansion. This was demonstrated in the most important group of acute stroke patients, those presenting less than 6 hours from onset (the accepted time window during which most therapy options might still be available to the treating clinician). The mean rADC in the regions of infarct expansion was more than the mean rADC in the infarct core and less than the mean rADC in penumbral regions without infarction, which was shown by the quantitative and histogram analysis of the mean ADC values in each region. These areas of infarct expansion and intermediate ADC values were not identified prospectively on the diffusion-weighted images and were better shown on color ADC maps. In retrospect, they were often represented by areas of ill-defined or hazy change on the diffusion-weighted images. Histogram analysis confirmed that the voxels in the expansion region were a different population from the other regions examined. The average decrease in ADC in this region, 15%, is at about the level that visual assessment of the changes would become difficult to detect, but this supports the hypothesis that color maps of these changes might aid in visual perception of the abnormality. Thresholding of ADC values to identify tissue at risk of infarction is difficult because of the overlap of ADC values of voxels in the regions. The data suggest that thresholding below the value of the mean, 85% normal value, might identify the population with the most reduced ADCs. Formal testing to assess how much of the affected region could be predicted has not yet been performed.
These subtle variations on diffusion-weighted images within penumbral tissue might relate to severity or heterogeneity of ischemia or both. In animal studies, Minematsu et al (12) have shown the presence of peripheral regions of minimally elevated diffusion abnormality, which correlated with regions of reversible ischemic change. Although the authors did not present ADC values in these regions, they postulated that these subtle diffusion changes would be reflected in quantitative ADC measurements. Hossman (1) also suggested that quantitative ADC values around the outer margin of the visible diffusion-weighted imaging lesion would provide information about the viability of the ischemic penumbra. More recently, Detre et al (13) have shown in rats that the ischemic penumbra has values of ADC that are intermediate between ischemic core and control regions.
Our work complements the recent suggestion of Koroshetz and Gonzales (14) that a hazy, dull hyperintensity on diffusion-weighted images might represent reversible ischemic tissue in the penumbra. We have found that these subtle areas of diffusion change correspond to intermediate rADC values and were only present in regions of infarct expansion. Alger et al (15) have demonstrated in humans that early reperfusion of regions with abnormal ADC values is associated with tissue salvage and reversal of ADC abnormalities.
Our work is in accord with previous animal studies. Hoehn-Berlage et al (16) and others have shown that the region of diffusion abnormality is greater than the region of adenosine triphosphate depletion, and that the zone with normal energy balance but abnormal ADC value may correspond with the ischemic penumbra. They showed that the region of energy depletion (ischemic core) had rADC values of less than 0.77 ± 0.03 compared with the contralateral side. The region of tissue acidosis (resembling the ischemic penumbra) had rADC values of less than 0.90 ± 0.04. Detre et al (13) used a rat model to demonstrate that this region of potentially reversible ischemia in the ischemic penumbra had intermediate rADCs values of 0.77–0.90 of normal.
Schlaug et al (17) also have recently reported the presence of abnormal rADC values in the ischemic penumbra. They found that the ischemic core had ADC values of 56.4%, and that area of the penumbra that proceeded to infarction had a mean ADC value of 91.3% when compared with the contralateral hemisphere. This ADC value of 91.3% is higher than that reported here (83%). The lack of segmentation of the cerebral spinal fluid in their ADC maps, as well as the different population studied (our patients' time from stroke onset, less than 6 hours; theirs, less than 24 hours), may account for their higher values. As such, our results are consistent with those of Schlaug et al and provide further human evidence for the presence of reduced ADC values in the penumbra at risk of infarction.
A limitation of our study is that only the largest regions of penumbral infarction and preservation were studied in each patient. Analysis of the full extent of the penumbra is now the subject of further work. This quantitative assessment of the penumbral regions has shown that intermediate ADC values are present in the regions of the penumbra that proceed to infarction. Quantitative prediction of abnormal voxels in the penumbra might require a sophisticated computer model performed on a voxel-by-voxel basis, of not only ADC values but also flow parameters. Until such programs exist and are readily accessible, visual assessment of the color ADC maps, or even color diffusion-weighted images, might help determine which penumbral patients are likely to have infarct expansion. This would provide a valuable clinical indicator to the treating physician.
Conclusion
Apparent diffusion coefficient maps might assist clinicians in selecting patients with salvageable tissue within the ischemic penumbra. Regions of the penumbra with rADC values greater than 0.90 are unlikely to proceed to infarction. The infarct core typically has an rADC of less than 0.75. Regions of the penumbra with intermediate rADC values are those at greatest risk of infarction.
Summary of patient data, time to MR examination, and values of the ADC ratios on the acute scan in the diffusion abnormality and different regions of the penumbra
Footnotes
Presented in part at the annual meeting of the American Society of Neuroradiology, San Diego, CA, May 23–28, 1999.
Address reprint requests to Patricia M. Desmond, Department of Radiology, University of Melbourne, Parkville, Victoria 3050, Australia.
References
- 1.Hossman KA. Viability thresholds and the penumbra of focal ischaemia. Ann Neurol 1994;36:557-565 [DOI] [PubMed] [Google Scholar]
- 2.Barber PA, Darby DG, Desmond PM, et al. Prediction of stroke outcome with echoplanar perfusion-and diffusion-weighted MRI. Neurology 1998;51:418-426 [DOI] [PubMed] [Google Scholar]
- 3.Sorensen AG, Buonanno FS, Gonzalez RG, et al. Hyperacute stroke: evaluation with combined multisection diffusion weighted echo-planar MR imaging. Radiology 1996;199:391-401 [DOI] [PubMed] [Google Scholar]
- 4.Warach S, Wielopolski P, Edelman RR. Identification and characterization of the ischaemic penumbra of acute human stroke using echo planar diffusion and perfusion imaging [abstract]. In: Proceedings of the Twelfth Annual Scientific Meeting of the Society of Magnetic Resonance in Medicine. Berkeley, CA: Society of Magnetic Resonance in Medicine; 1993:263
- 5.Stejskal EO, Tanner JE. Spin diffusion measurements: spin-echoes in the presence of a time-dependent field gradient. J Chem Physiol 1965;42:288-292 [Google Scholar]
- 6.Ulug AM, Beauchamp N Jr, Bryan RN, van Zijl PC. Absolute quantitation of diffusion constants in human stroke. Stroke 1997;28:1778-1782 [DOI] [PubMed] [Google Scholar]
- 7.Yang Q, Tress BM, Barber A, et al. Serial study of apparent diffusion coefficient and anisotropy in patients with acute stroke. Stroke 1999;30:2382-2390 [DOI] [PubMed] [Google Scholar]
- 8.Rosen BR, Belliveau JW, Buchbinder BR, et al. Contrast agent and cerebral hemodynamics. Magn Reson Med 1991;19:285-292 [DOI] [PubMed] [Google Scholar]
- 9.Neumann-Haefelin T, Moseley ME, Albers GW. New magnetic resonance imaging methods for cerebrovascular disease: emerging clinical applications. Ann Neurol 2000;47:559-570 [PubMed] [Google Scholar]
- 10.Tong DC, Yenari MA, Albers GW, O'Brien M, Marks MP, Moseley ME. Correlation of perfusion-and diffusion-weighted MRI with NIHSS score in acute ischemic stroke. Neurology 1998;50:864-870 [DOI] [PubMed] [Google Scholar]
- 11.Mukheerjee P, Bahn MM, Makinstry RC, et al. Differences between gray and white matter water diffusion in stroke: diffusion-tensor MR imaging in 12 patients. Radiology 2000;215:211-220 [DOI] [PubMed] [Google Scholar]
- 12.Minematsu K, Limin L, Sotak CH, Davis MA, Fisher M. Reversible focal ischemic injury demonstrated by diffusion-weighted magnetic resonance imaging in rats. Stroke 1992;23:1302-1310 [DOI] [PubMed] [Google Scholar]
- 13.Detre JA, Zager EL, Alsop DC, Harris VA, Welsh AW. Correlation of diffusion MRI and heat shock protein in a rat embolic stroke model. J Neurosci 1997;148:163-169 [DOI] [PubMed] [Google Scholar]
- 14.Koroshetz WJ, Gonzales RG. Imaging stroke in progress: magnetic resonance advances but computed tomography is poised for counterattack. Ann Neurol 1999;46:556-558 [DOI] [PubMed] [Google Scholar]
- 15.Alger JR, Kidwell SC, Kalafat M, et al. Can abnormal diffusion MRI in human stroke be reversed? J Cereb Blood Flow Metab 1999;19: (suppl) 44310197514 [Google Scholar]
- 16.Hoehn-Berlange M, Norris DG, Kohno K, Mies G, Liebfritz D, Hossman KA. Evolution of regional changes in apparent diffusion coefficient during focal ischemia of rat brain: the relationship of quantitative diffusion NMR to reduction of cerebral blood flow and metabolic disturbances. J Cereb Blood Flow Metab 1995;15:1002-1015 [DOI] [PubMed] [Google Scholar]
- 17.Schlaug G, Benfield BS, Baird AE, et al. The ischemic penumbra: operationally defined by the diffusion and perfusion MRI. Neurology 1999;53:1528-1537 [DOI] [PubMed] [Google Scholar]


