

Abstract
BACKGROUND AND PURPOSE: The radiologic assessment of suspicious brain lesions after stereotactic radiotherapy of brain tumors is difficult. The purpose of our study was to define parameters from single-voxel proton MR spectroscopy that provide a probability measure for differentiating neoplastic from radiation-induced, nonneoplastic lesions.
METHODS: Seventy-two lesions in 56 patients were examined using a combined MR imaging and MR spectroscopy protocol (point-resolved spectroscopy, TE = 135 ms). Signal intensities of cholines, creatines, N-acetyl aspartate, and the presence of lactate and lipid resonances were correlated to final diagnoses established by clinical and MR imaging follow-up, positron emission tomography studies, or biopsy/surgery. Statistical analysis was performed using the t test, linear discriminant analysis, and k nearest-neighbor method.
RESULTS: Significantly increased signal intensity ratios ItCho/ItCr (P < .0001) and ItCho/INAA (P < .0001) were observed in neoplastic (n = 34) compared with nonneoplastic lesions (n = 32) and contralateral normal brain (n = 33). Analysis of ItCho/ItCr and ItCho/INAA data yielded correct retrospective classification as neoplastic and nonneoplastic in 82% and 81% of the lesions, respectively. Neither INAA/ItCr nor signal intensitities of lactate or lipids were useful for differential diagnosis.
CONCLUSION: Metabolic information provided by proton MR spectroscopy is useful for the differentiation of neoplastic and nonneoplastic brain lesions after stereotactic radiotherapy of brain tumors.
Radiotherapy plays an important role in the treatment of nonresectable brain tumors. This approach is particularly important for patients with glial brain tumors, because these tumors rarely develop metastases, and local control can cure the patient. However, the narrow margin between the radiosensitivity of brain tumors and of normal brain restricts the effectiveness of radiotherapy.
Stereotactic radiation therapy allows a dose increase in the target volume and sparing of normal tissue. This treatment technique is deemed to improve patient quality of life and to control the disease (1). However, high radiation doses bear an increased risk of focal radiation injury to the normal brain tissue.
Pathophysiological studies of normal brain tissue after high-dose radiotherapy showed that in the case of radiation injury (RI), damage of oligodendrocytes and endothelial cells, as well as immunological mechanisms, contribute independently to demyelination and necrosis (2). Clinically, RI has been classified, according to the time of the onset of symptoms, as acute (during or shortly after radiotherapy), early delayed (a few weeks to a few months after radiotherapy), and late delayed reactions (from several months to years after exposure) (3). The symptoms of acute reactions, which are attributed to brain edema, are in general mild, reversible, and can be treated with corticosteroids. Early delayed reactions are caused by white matter alterations resulting from demyelination, are commonly of transient nature, and, in most cases, do not require a specific therapy. Late delayed reactions or focal radiation necrosis represent the most severe manifestation of radiation injury and can be progressive or sometimes fatal, and surgery may be required.
It is still difficult with X-ray CT, MR imaging, and positron emission tomography with [2-18F]fluoro-2-deoxy-D-glucose (FDG–PET) to assess suspicious imaging findings after radiotherapy as lesions related to residual or recurrent brain tumor, or as lesions related to nontumorous, posttreatment reactions. In particular, recurrent tumor and radiation-induced tissue damage often appear at the same location within or near the region of the irradiated volume, both resembling contrast-enhancing, expansive brain lesions surrounded by edema.
Beyond morphologic information provided by MR imaging, in vivo proton MR spectroscopy (1H MRS) creates a noninvasive window to neurometabolism (4, 5). Pattern analysis of 1H MRS data obtained with single-voxel spectroscopy (6–8) or spectroscopic imaging (9) was applied successfully to detect metabolic signatures of glial brain tumors. In a number of studies, the clinical value of 1H single-voxel MRS (10–13) and spectroscopic imaging (9) for the management of patients with brain lesions suspicious for malignant tumors has been demonstrated. In this study, we examined patients after stereotactic radiotherapy of brain tumors with the purpose of differentiating between neoplastic and radiation-induced, nonneoplastic lesions by using signal intensity ratios from long-TE single-voxel 1H MR spectra.
Methods
Patient Population
Fifty-six patients who presented with suspicious brain lesions and/or clinical symptoms after stereotactic radiotherapy of progressive brain tumors were included in this study (astrocytoma grade I, six patients; grade II, 29 patients; grade III, nine patients; grade IV, four patients; metastases, six patients; meningioma, two patients; 27 women and 29 men; mean age ± standard deviation, 42.5 ± 14.8 years). Seventy-two lesions detected by MR were examined by 1H MRS. Lesions showed either suspicious hyperintense areas on T2-weighted MR images and/or a new contrast enhancement within or near the irradiated volume.
Radiotherapy
The patients were treated at the German Cancer Research Center (dkfz) in cooperation with the Radiological Clinic of the University of Heidelberg. MR and CT scans (only MR imaging data in the case of single-dose radiation therapy) were employed for three-dimensional treatment planning by means of Voxelplan (software developed at the dkfz) or STP (Leibinger; Freiburg, Germany). All patients were positioned in an individual head mask (14) and treated using a linear accelerator with 6 MeV or 15 MeV energy (Siemens Corporation, Concord, CA). Forty-eight patients with astrocytoma or oligodendroglioma received fractionated stereotactic radiation therapy with single doses of 1.8 or 2 Gy and a median total dose at the isocenter of 55.8 Gy (range: 50.4–66 Gy). The 90% isodose surrounded the planning target volume (1).
Because of recurrent disease after initial regular radiation therapy, eight patients with astrocytoma received a second fractionated stereotactic irradiation that included the contrast-enhancing regions of the tumor. The median of the initial dose was 59.8 Gy (range: 40–60 Gy). The median of the additional dose was 36 Gy (range: 32–43.5 Gy) at the isocenter when using 1.8 or 2 Gy single fractions. In five patients, the astrocytoma was first treated with radioactive seed implantation. For recurrent disease, patients received fractionated stereotactic radiation therapy with a median dose of 47.7 Gy (range: 38–57.6 Gy) at 1.8 Gy single doses. One patient with astrocytoma grade III first received 54 Gy fractionated radiation therapy plus a stereotactic single-dose boost of 15 Gy. After recurrence, another 25 Gy (hypofractionated at 5-Gy single doses) were applied to the tumor. Five patients with brain metastases received a single-dose radiation therapy of the lesion as described by Pirzkall et al (15). The median dose was 18 Gy (range: 15–20 Gy) applied to the 80% isodose surrounding the tumor. Two of these patients previously underwent whole-brain radiation therapy. One patient with a metastasis in the pituitary gland received fractionated stereotactic irradiation with a total dose of 40.5 Gy.
MR follow-up examinations started 6 weeks after radiotherapy and were routinely repeated every 3 to 6 months. Examination intervals were shortened in the case of deterioration of the patient's symptoms.
Lesions were classified during follow-up. Progressive tumor (PT) was diagnosed in the case of an increase of the hyperintense area on T2–weighted MR images by more than 25%, or a new contrast-enhancing area with subsequent enlargement on MR imaging and (in patients with subsequent PET examinations) significant FDG uptake. RI was diagnosed in the case of less than 25% increase of the hyperintense area and no further change, or new contrast enhancement with unsuspicious FDG uptake or subsequent involution. Stable disease (SD) was assigned if the lesion was neither PT nor RI. If tumor progression was diagnosed, the patient was treated by surgery, chemo-, or radiotherapy.
Data Acquisition
MR and 1H MRS examinations were performed using a 1.5-T whole-body scanner (Magnetom Vision; Siemens, Erlangen, Germany) using the commercially available MR and MRS pulse sequences and the standard head coil. Informed consent was obtained from all patients after the nature of the procedures had been fully explained.
The MR imaging protocol included conventional multiplanar T1-and T2-weighted MR imaging. Multiplanar T1-weighted MR scans were repeated after intravenous administration of gadopentetate dimeglumine.
Proton MR spectra were acquired before administration of the contrast medium. On the basis of previous MR examinations, volumes of interest (VOIs) were placed inside suspicious lesions seen in T1- and T2-weighted images. Central areas of the lesions could comprise necrotic tissue. Normal brain tissue or fluid-filled structures (eg, cysts, surgical defects, and ventricles) that could be delineated on T2-weighted images were excluded from the VOI. When possible, signal contamination from fat tissue in the skull and skull base was avoided. After inspection of multiplanar images, the VOI was adapted to the extension of the lesion resulting in voxel sizes in the range of 1.5 × 1.5 × 1.5 to 2 × 2 × 3 cm3. In the majority of examinations, a voxel size of 2 × 2 × 2 cm3 was employed. VOI positions were verified by MR after administration of contrast medium. If a suspicious lesion was not detected on the precontrast image, but first on postcontrast MR images, a short-term follow-up MRS examination of this lesion was performed. Spectra were also obtained from VOIs in normal tissue of the contralateral hemisphere if the contralateral side was not affected by suspicious tissue alterations. Optimization of magnetic field homogeneity (shim) in the VOI produced a minimum line width (full width at half maximum) of the tissue water proton resonance in vivo in the range of 4–8 Hz. The 1H MR spectra were obtained with a double spin-echo sequence with 1-pulse water signal suppression, (1500/135/200–300 [TR/TE excitations]; measurement time, 5–7.5 minutes, spectral width, 1-kHz; and data points, 1024). The individual patient was always examined with the same measurement parameters (TE, TR, excitations, voxel size). The total measurement time for the MRS examination of all voxels (including voxel positioning, shim, adjustment of water suppression) lasted less than 30 minutes. The complete examination, including diagnostic MR imaging, lasted less than 60 minutes.
MR Data Analysis
MR spectroscopy data were evaluated using a commercial program (Luise; Siemens) available at the Magnetom Vision scanner. First, signal-time data were multiplied by a Gaussian function (time constant, 256 ms). After Fourier transformation and phase correction, the baseline was flattened by fit and subtraction of a spline function. Signal intensities (I) of choline-containing compounds (phosphocholine, glycerophosphorylcholine, etc. = total choline, tCho; chemical shift δ = 3.22 ppm), the creatine-phosphocreatine complex (tCr; δ = 3.01 ppm), and N-acetylaspartate (NAA; δ = 2.01 ppm) were calculated by fit and integration of the resonances in postprocessed Fourier spectra. Signal intensity ratios ItCho/ItCr, ItCho/INAA, and INAA/ItCr were analyzed for the different lesions (PT, RI, SD) and as a function of time after the end of treatment. In addition, all 1H spectra were inspected for resonances of lactate (β–methyl doublet centered at δ = 1.33 ppm) and free fatty acids (δ in the range of 0.8–2.4 ppm).
Statistical Analysis
To detect a possible correlation of ItCho/ItCr, ItCho/INAA, and INAA/ItCr of the lesions to the clinical evidence, a two-sample t test was applied to calculate P values (SAS for Windows, Version 6.10; SAS, Cary, NC). An F′ (folded) statistic was used to test for equality of the two variances. The level of significance was set at P < .05. To determine whether the signal intensity ratios of ItCho/ItCr and ItCho/INAA could be used for classification into different groups (PT, RI, SD, RI/SD, or normal brain tissue), two statistical methods were applied: linear discriminant analysis and the k nearest-neighbor method, where k = 7 gave the best cross-validated estimate of the error rate, and Euclidean distance to determine proximity (16). Each method separates the two-dimensional parameter space [(ItCho/ItCr), (ItCho/INAA)] by a discriminant line (ItCho/ItCr) = a − b × (ItCho/INAA).
Results
In 66 lesions (50 patients), good-quality 1H MR spectra and the clinical diagnosis were obtained: 34 lesions were classified as progressive tumor (PT), 17 lesions as RI, and 15 lesions as SD. The mean length of follow-up for SD and RI cases was 15.3 months. In one patient, the diagnosis of radiation necrosis was achieved by biopsy. In another patient, surgery revealed recurrent oligodendroglioma grade III. Four patient examinations could not be evaluated because of susceptibility artifacts from nasal sinus or metallic implants. Two patients died and no definite diagnosis could be established because autopsy was denied.
Figure 1 shows data of a patient with two suspicious contrast-enhancing lesions on MR imaging. High ItCho/ItCr and ItCho/INAA values were found in tumor progression (according to PET and MR follow-up), while low ItCho/ItCr and ItCho/INAA were observed in radiation necrosis (as confirmed by biopsy in this particular case).
fig 1.

A 67-year-old patient with astrocytoma grade II. MR examination 36 months after stereotactic radiotherapy showed two contrast-enhancing lesions on T1-weighted spin-echo images.
A and C, A lesion with ring-shaped enhancement zone is seen in the left frontal lobe (A) and a lesion with homogeneous enhancement in seen in the left temporal lobe (C) (boxes indicate MRS voxels).
B and D, 1H MR spectra [double spin-echo sequence 1500/135/200 (TR/TE/excitations)] of both lesions show a peak attributed to free lipids, indicating necrosis. An intense tCho resonance is only seen in the lesion in the left temporal lobe. FDG-PET revealed high glucose uptake in this region, indicating tumor progression. Low tCho signal was found in the lesion in the left frontal lobe. Radionecrosis in this region was confirmed by biopsy.
Figures 2 and 3 show MR and MRS data of patients with RI lesions with and without contrast enhancement. In the patient shown in Figure 2, a decrease of initially elevated ItCho/ItCr and ItCho/INAA values and a disappearance of the contrast-enhancing region was observed. In the patient shown in Figure 3, the ratios ItCho/ItCr and ItCho/INAA were low at the first examination and did not change during follow-up.
fig 2.

A 36-year-old patient with astrocytoma II in the right temporo-parietal lobe, examined before (A) and 20 months after stereotactic radiotherapy (B). During follow-up, an irregular contrast-enhancing lesion appeared at the upper region of the irradiated volume (B) with complete involution 13 months later (D). 1H MR spectra (double spin-echo sequence 1500/135/200) (C) show initially elevated ItCho/ItCr and ItCho/INAA values and a strong lipid resonance. Thirteen months later, the spectrum indicates normal brain tissue (E)
fig 3.

A 54-year-old patient with astrocytoma II of the right temporal lobe after surgery and stereotactic radiotherapy. T2-weighted turbo spin-echo images obtained before (A) and 9 months after radiotherapy (B) show a hyperintense lesion within the irradiated insula on the right hemisphere, a surgical tissue defect in the right temporal, and gliosis in the right occipital lobe (T1-weighted spin-echo images showed no uptake of contrast medium.) Corresponding 1H MR spectra (double spin-echo sequence 1500/135/200) acquired 9, 15, and 21 months after stereotactic radiotherapy (C–E) demonstrated similar signal intensities of tCho and tCr, with only minor changes during follow-up. MR imaging follow-up showed no further change of the lesion consistent with diagnosis of nonneoplastic lesion
Table 1 shows the mean ratios of metabolite signal intensities obtained from different lesions and from unaffected tissue in the contralateral side of the brain; the corresponding P values are shown in Table 2. Compared with the intensity ratios observed in normal tissue (n = 33), larger ItCho/ItCr and ItCho/INAA, as well as smaller INAA/ItCr, were found in PT lesions. These changes were significant (P = .0001). Likewise, significantly elevated ItCho/INAA and significantly reduced INAA/ItCr compared with normal tissue were observed in RI and SD lesions (P ≤ .017), while the increase of ItCho/ItCr was not significant.
TABLE 1:
Mean 1H MR signal intensity ratios from lesions and contralateral normal brain tissue
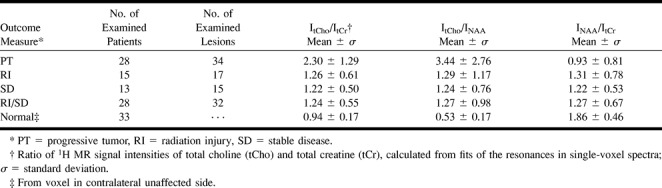
TABLE 2:
P values from two-sample t test between 1H MR signal intensity ratios of different lesions and contralateral normal brain
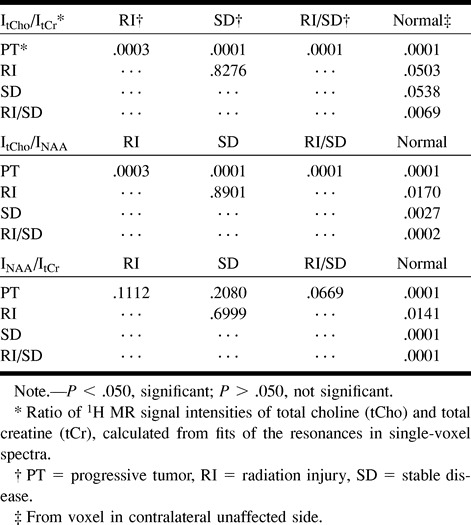
On the basis of ItCho/ItCr and ItCho/INAA values, three groups corresponding to PT (n = 34), RI and SD (n = 32), and unaffected tissue (n = 33) could be distinguished (Table 1). ItCho/ItCr and ItCho/INAA of PT lesions exceeded the intensity ratios of RI/SD lesions and normal brain tissue (P = .0001), while INAA/ItCr of PT was smaller than in RI/SD lesions, but without statistical significance (P = .0669). For RI/SD and normal brain tissue, all three ratios differed significantly, but were inappropriate for differentiation of RI and SD. Using INAA/ItCr, discrimination of PT, RI, SD, and RI/SD lesions was not possible. Lactate was observed in 59% of PT (20/34), 35% of RI (6/17), and 20% of SD lesions (3/15). Lipid resonances were found in 27% of PT (9/34), 12% of RI (2/17), and 27% of SD lesions (4/15).
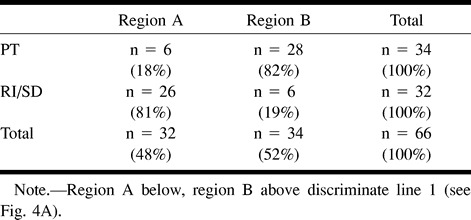
Figure 4 displays plots of ItCho/ItCr versus ItCho/INAA values observed in this study. In particular, Fig 4B displays ratios ≤ 5.0 together with ItCho/ItCr and ItCho/INAA values of normal brain (contralateral side). The discriminate lines in Fig 4A, obtained from linear discriminant analysis (line 1) and from the seven-point neighbor method (line 2), allowed classification of neoplastic and nonneoplastic lesions retrospectively. With both methods, the ratios of 81% of RI/SD lesions were located below, and of 82% of PT lesions above, the corresponding discriminate lines. Using discriminant analysis, individual probabilities of PT increased with orthogonal distance to the discriminate line 1 (50% line in Fig 4B). This is indicated in Fig 4B by means of lines parallel to the discriminate line labelled with the probability of PT. Table 3 summarizes the results of the linear discriminant analysis. All data points from normal brain tissue are located below the discriminate lines (Fig 4B).
fig 4.

a, Ratios of 1H MR signal intensities (double spin-echo sequence 1500/135/200–300) of total choline and total creatine (ItCho/ItCr) versus ratios of intensities of total choline and NAA (ItCho/INAA) observed in lesions classified as progressive tumor (●, n = 35), radiation injury (Δ, n = 17), and stable disease (⋄, n = 15). The straight lines: (ItCho/ItCr) = 2.5–0.5 × (ItCho/INAA) (line 1) and (ItCho/ItCr) = 4.2–1.35 × (ItCho/INAA) (line 2) obtained from linear discriminant analysis and 7-point neighbor method, respectively, differentiate neoplastic and nonneoplastic lesions.
b, Detail of (a) with ratios ≤ 5.0 together with ItCho/ItCr and ItCho/INAA values of normal brain (×, n = 33, voxel in the contralateral unaffected side). Parallel lines obtained from linear discriminant analysis are labeled with the probability of PT.
TABLE 3:
Retrospective classification of lesions using linear discriminant analysis
Discussion
The differentiation of tumor progression and radiation injury after brain tumor radiotherapy is indispensable for adequate treatment. The management of patients who present with clinical symptoms and/or suspicious brain lesions can, however, be difficult because both pathologic abnormalities can resemble each other: clinically, both may proceed by increased severity of focal neurologic signs, deterioration of mental status, or by seizures. On MR imaging, radiation-injury and tumor progression present as mass lesions with prolongation of T1 and T2 relaxation times, which is attributed to edema, demyelination, and necrosis (2). In both pathologic abnormalities, contrast enhancement after gadopentate dimeglumine administration indicates breakdown of the blood-brain barrier.
At follow-up of radiotherapy, particular diagnostic problems arise from the heterogeneity of the patient group (eg, regarding tumor histology, pretreatment). When edema is detected with CT or MR imaging during or early after therapy, the diagnosis of acute reactions after radiotherapy can usually be established. Problems arise, however, when early or late-delayed reactions have to be distinguished from tumor progression. While FDG-PET permits differentiation of hypometabolic radiation necrosis and chemonecrosis from hypermetabolic recurrent tumor, the method is limited in detecting low- or intermediate-grade gliomas (17, 18). Suspicious imaging findings may be evaluated by stereotactic biopsy; however, this procedure carries risk of morbidity, depending on the location of the lesion. Moreover, small tumor cell clusters may be missed by biopsy specimens, which are not necessarily representative for the whole, heterogeneous lesion.
1H MRS provides important metabolic information for the assessment of brain tumors (6–9). Prospective studies showed that signal intensity ratios can be used to evaluate suspicious brain lesions in patients (11, 12). In follow-up examinations after radiotherapy for glial tumors, decreasing or unchanging choline intensities were observed in the case of response to treatment, and increasing choline intensities in cases of tumor progression (19, 20). The problem of differentiating tumor recurrence from radiation necrosis by means of 1H MRS has been addressed by several groups (20–26). Their studies have demonstrated that high choline intensities indicate tumor progression and low choline intensities indicate radiation necrosis. On the basis of these findings, the present study was performed to obtain a probability measure from 1H MRS signal intensity ratios for differentiating neoplastic (PT) from nonneoplastic lesions (RI and SD) by the examination of a large group of patients.
Optimum differentiation of neoplastic and nonneoplastic lesions was obtained by pooling the ratios ItCho/ItCr and ItCho/INAA (Fig 4). Using this pair of MRS parameters, the linear discriminant analysis, as well as the k nearest-neighbor method, allowed a correct retrospective classification of lesions as neoplastic and nonneoplastic in 82% and 81% of the cases, respectively (Table 3 and Fig 4). The advantage of the linear discriminant analysis was the visualization of probabilities in the ItCho/ItCr–ItCho/INAA plot (Fig 4B), enabling assignment of individual probabilities to patient data in a prospective manner. The probability measures show a broad scatter that must be taken into account when they are used for the diagnosis. Data points close to the discriminate line correspond to expectation, because neoplastic and nonneoplastic tissue can exist in the same area examined by MRS (23). A differentiation between nonneoplastic lesions RI and SD was not possible (which is not critical, because anti-tumoral therapy was not required in these cases).
A false-positive classification as neoplastic was observed in 19% of the lesions (4/17 RI, 2/15 SD). High ItCho/INAA and ItCho/ItCr values can be attributed to radiation-induced inflammation, demyelination, and gliosis. This agrees with results of the following studies. Analyzing spectra of suspicious brain lesions, Krouwer et al (27) observed increased choline and decreased N-acetyl aspartate and creatine intensities not only in neoplastic, but also in nonneoplastic brain lesions, when histologic examination revealed signs of inflammation, demyelination, and reactive astrogliosis. Kizu et al (22) observed increasing choline and lipid levels in radiation necrosis in two patients after radiosurgery, which presumably reflected radiation-induced demyelination and mobile lipids in macrophages. After radiotherapy of nasopharyngeal carcinoma, high ItCho/ItCr was found in severe-grade cerebral necrosis in the temporal lobe (28). Esteve et al (29) observed a significant decrease of INAA/ItCho in normal human brain tissue 4 months after irradiation. Szigety et al (30) reported reduced ItCr/ItCho and INAA/ItCho in normal human brain within 4 months after irradiation. The spectral parameters turned to normal values 8 months after irradiation, which suggests that these radiation-induced metabolic changes are reversible. The authors discuss release of water-soluble choline-containing compounds during demyelination, reflecting breakdown of membrane phospholipids after radiation-induced damage of oligodendrocytes.
The false-positive classification of PT lesions as nonneoplastic in seven (18%) of the 34 lesions on the basis of low ItCr/ItCho and INAA/ItCho values can be explained by partial-volume effects (small tumor cell clusters within nonneoplastic tissue).
INAA/ItCr enabled the discrimination of normal brain tissue from all types of lesions, while the parameter was inappropriate to differentiate between PT, RI, SD, and RI/SD (Table 2). A reduction of NAA levels in brain tumors and radiation necrosis is a well-known phenomenon (9, 10, 20, 24, 26, 31). Yousem et al (32) measured low INAA/ItCr and INAA/ItCho values in contrast-enhancing lesions in the normal cat brain 8 to 9 months after irradiation. Histologic examination of these lesions revealed areas of demyelination, necrosis, and Wallerian degeneration. Accordingly, the MR spectroscopic findings were interpreted as a consequence of reduced neuronal cells within areas affected by radiation (32). Decreased N-acetyl aspartate concentrations may, therefore, reflect a nonspecific damage of neuronal/axonal structures caused by either tumor progression or radiation.
The presence of lipid resonances in the 1H MR spectra (indicative of phospholipid degradation) was not predictive for tumor growth. This corresponds to expectations since necrosis can result from tumor progression or radiation injury. It has also to be considered that in the case of lesions near the surface of the brain, the spectrum may be contaminated by signal from fat tissue in the skull. Lactate was observed most frequently in PT, but also in RI and SD, and could therefore not be used for differentiation of these lesions.
MR spectra of the contralateral normal hemisphere could not be obtained in all patients. The reasons were: 1) the contralateral side was affected by tumor or treatment-related effects, such as blood-brain–barrier disruption, gliosis, or edema; or 2) several suspicious lesions had to be studied, thus consuming the entire examination time. However, control spectra did not add relevant information concerning the discrimination between neoplastic and nonneoplastic lesions.
The single-voxel 1H MRS examination can easily be included into the routine MR protocol (additional measurement time was less than 30 minutes). A point resolved spectroscopy sequence (PRESS) was used because of its higher signal yield compared with stimulated echo acquisition mode (4). Long-TE spectra (TE = 135 ms) were acquired because they provide an inverted doublet signal of lactate (with respect to lipid singlets) and a relatively flat baseline, which facilitates the quantitative evaluation of the resonances. Since signals obtained with long-TE are more sensitive to changes in T2, absolute quantification of metabolite concentrations (33) must include the measurement of the relaxation times of the compounds in the tumor. In this study, however, absolute quantification with the required accuracy (irrespective of the spread of relaxation times across a heterogeneous lesion) turned out to be impossible within the available examination time. Therefore, intensity ratios were evaluated that can be derived easily and quite exactly from long-TE PRESS spectra. The disadvantage is that intensity ratios are difficult to interpret when the concentrations of both metabolites change. Nevertheless, the data in Tables 2 and 3 and in Figure 4 demonstrate the value of this approach.
MR spectra were always obtained before administration of contrast medium, because in contrast-enhancing brain tumors, a decrease of the choline signal intensity was observed after gadopentate dimeglumine infusion (34). However, the positioning of the voxel in precontrast MR images can be problematic in the case of contrast-enhancing lesions. To avoid partial volume effects from normal brain tissue, the voxels were always placed by an experienced radiologist using information of radiotherapy treatment plans and previous MR examinations. The positioning was finally verified by means of contrast-enhanced T1-weighted MR imaging.
Single-voxel MRS yields well-delineated VOIs and, therefore, avoids signal contamination, eg, from lipids when lesions are located near the skull or skull base. Moreover, the local shim to a small VOI enables resolved spectra even in the case of susceptibility problems, which can occur in patients with hemorrhage, metallic implants, and ventricular shunts after brain surgery.
To examine a larger region of the brain and to overcome the problems of single-voxel selection, several groups use spectroscopic imaging (9, 20, 23, 24). This technique provides an array of spectra with the option to shift the voxel grid after completion of the examination for optimum localization. It permits analysis of different areas of the suspicious lesion and of unaffected tissue. Compared with single-voxel MRS, however, the delineation of the individual voxel is worse, owing to signal contributions from adjacent voxels (“voxel bleeding”) caused by truncated sampling of k space. We performed patient examinations with spectroscopic imaging to scan the entire planning target volume of stereotactic radiotherapy. Single-voxel MRS is additionally used in cases with complicated location of the lesion and/or susceptibility problems.
Conclusion
The evaluation of 66 suspicious lesions in 50 patients with irradiated brain tumors demonstrated the advantage of 1H MRS for differentiating between neoplastic and radiation-induced, nonneoplastic lesions. Signal intensity ratios ItCho/ItCr and ItCho/INAA allowed a correct retrospective classification of lesions as neoplastic and nonneoplastic in 82% and 81% of the cases, respectively.
On the basis of our experience, it is avisable to include 1H MRS in MR imaging follow-up of patients with irradiated brain tumors. We also recommend performing an examination before radiotherapy, since baseline data facilitate the interpretation of follow-up spectra.
Acknowledgments
The authors thank Dr. Markus Wenke for support in data acquisition and Christopher Aisenbrey, MSc, for helpful contributions to data analysis.
Footnotes
This work was partially supported by the Tumorzentrum Heidelberg–Mannheim.
Presented in part at the 85th scientific assembly and annual meeting of the Radiological Society of North America, Chicago, IL, 1999.
Address reprint requests to H.–P. Schlemmer, MD, German Cancer Research Center (dkfz), Department of Oncological Diagnostics and Therapy, Im Neuenheimer Feld 280, D–69120 Heidelberg, Germany.
References
- 1.van Kampen M, Engenhart-Cabillic R, Debus J, Hess T, Schad LR, Wannenmacher MF. Low-grade astrocytoma: treatment with conventionally fractionated stereotactic radiation therapy. Radiology 1996;201:275-278 [DOI] [PubMed] [Google Scholar]
- 2.Schultheiss TE, Kun LE, Ang KK, Stephens LC. Radiation response of the central nervous system. Int J Radiat Oncol Biol Phys 1995;31:1093-1112 [DOI] [PubMed] [Google Scholar]
- 3.Sheline GE, Wara WM, Smith V. Therapeutic irradiation and brain injury. Int J Radiat Oncol Biol Phys 1980;6:1215-1228 [DOI] [PubMed] [Google Scholar]
- 4.Frahm J, Bruhn H, Gyngell ML, Merboldt KD, Hänicke W, Sauter R. Localized high–resolution proton NMR spectroscopy using stimulated echoes: initial applications to human brain in vivo. Magn Reson Med 1989;9:79-93 [DOI] [PubMed] [Google Scholar]
- 5.Ross B, Michaelis T. Clinical applications of magnetic resonance spectroscopy. Magn Reson Q 1994;10:191-247 [PubMed] [Google Scholar]
- 6.Alger JR, Frank JA, Bizzi A, Fuhlham MJ, et al. Metabolism of human gliomas: Assessment with H–1 MR spectroscopy and F–18 fluorodeoxyglucose PET. Radiology 1990;177:633-641 [DOI] [PubMed] [Google Scholar]
- 7.Ott D, Hennig J, Ernst T. Human brain tumors: assessment with in vivo proton MR spectroscopy. Radiology 1993;186:745-752 [DOI] [PubMed] [Google Scholar]
- 8.Tien RD, Lai PH, Smith JS, Lazeyras F. Single-voxel proton brain spectroscopy exam (PROBE/SV) in patients with primary brain tumors. AJR Am J Roentgenol 1996;167:201-219 [DOI] [PubMed] [Google Scholar]
- 9.Preul MC, Caramanos Z, Leblanc R, Villemure JG, Arnold DL. Using pattern analysis of in vivo proton MRSI data to improve the diagnosis and surgical management of patients with brain tumors. NMR Biomed 1998;11:192-200 [DOI] [PubMed] [Google Scholar]
- 10.Adamson AJ, Rand SD, Prost RW, Kim TA, Schultz C, Haughton VM. Focal brain lesions: effect of single-voxel proton MR spectroscopic findings on treatment decisions. Radiology 1998;209:73-78 [DOI] [PubMed] [Google Scholar]
- 11.Fulham MJ, Bizzi A, Dietz MJ, et al. Mapping of brain tumor metabolites with proton MR spectroscopic imaging: clinical relevance. Radiology 1992;185:675-686 [DOI] [PubMed] [Google Scholar]
- 12.Lin A, Bluml S, Mamelak N. Efficacy of proton magnetic resonance spectroscopy in clinical decision making for patients with suspicious malignant brain tumors. J Neurooncol 1999;45:69-81 [DOI] [PubMed] [Google Scholar]
- 13.Rand SD, Prost R, Haughton V, et al. Accuracy of single-voxel proton MR spectroscopy in distinguishing neoplastic from non-neoplastic brain lesions. AJNR Am J Neuroradiol 1997;18:1695-1704 [PMC free article] [PubMed] [Google Scholar]
- 14.Debus J, Engenhart-Cabillic R, Knopp MV, Schad LR, Schlegel W, Wannenmacher M. Image-oriented planning of minimally invasive conformal irradiation of the head-neck area. Radiologie 1996;36:732-736 [DOI] [PubMed] [Google Scholar]
- 15.Pirzkall A, Debus J, Lohr F, et al. Radiosurgery alone or in combination with whole-brain radiotherapy for brain metastases. J Clin Oncol 1998;16:3563-3569 [DOI] [PubMed] [Google Scholar]
- 16.Duda RO, Hart PE. Pattern Classification and Scene Analysis. John Wiley & Sons, Inc.;1973:130–159
- 17.Di Chiro G, Oldfield E, Wright DC, et al. Cerebral necrosis after irradiation and/or intraarterial chemotherapy for brain tumors: PET and neuropathologic studies. AJR Am J Roentgenol 1988;150:189-197 [DOI] [PubMed] [Google Scholar]
- 18.Patronas NJ, Di Chiro G, Brooks RA, et al. Work in progress: [18F] fluorodeoxyglucose and positron emission tomography in the evaluation of radiation necrosis of the brain. Radiology 1982;144:885-889 [DOI] [PubMed] [Google Scholar]
- 19.Heesters MA, Kamman RL, Mooyaart EL, Go KG. Localized proton spectroscopy of inoperable brain gliomas. Response to radiation therapy. J Neurooncol 1993;17:27-35 [DOI] [PubMed] [Google Scholar]
- 20.Wald LL, Nelson SJ, Day MR, et al. Serial proton magnetic resonance spectroscopy imaging of glioblastoma multiforme after brachytherapy. J Neurosurg 1997;87:525-534 [DOI] [PubMed] [Google Scholar]
- 21.Kamada K, Houkin K, Abe H, Sawamura Y, Kashiwaba T. Differentiation of cerebral radiation necrosis from tumor recurrence by proton magnetic resonance spectroscopy. Neurol Med Chir (Tokyo) 1997;37:250-256 [DOI] [PubMed] [Google Scholar]
- 22.Kizu O, Naruse S, Furuya S, et al. Application of proton chemical shift imaging in monitoring of gamma knife radiosurgery on brain tumors. Magn Reson Imaging 1998;16:197-204 [DOI] [PubMed] [Google Scholar]
- 23.Lee PL, Rabinov J, Cheng LL, Henson JW, Louis DN, Gonzalez RG. Differentiation between brain tumor recurrence and radiation effects: correlation of in vivo MRS at 3T and ex vivo high-resolution magic-angle spinning MRS and histopathology. Proc Intl Soc Magn Reson Med 1999;7:432 [Google Scholar]
- 24.Nelson SJ, Huhn S, Vigneron DB, et al. Volume MRI and MRSI techniques for the quantification of treatment response in brain tumors: presentation of a detailed case study. J Magn Reson Imaging 1997;7:1146-1152 [DOI] [PubMed] [Google Scholar]
- 25.Preul MC, Leblanc R, Caramanos Z, Kasrai R, Narayanan S, Arnold DL. Magnetic resonance spectroscopy guided brain tumor resection: differentiation between recurrent glioma and radiation change in two diagnostically difficult cases. Can J Neurol Sci 1998;25:13-22 [DOI] [PubMed] [Google Scholar]
- 26.Taylor JS, Langston JW, Reddick WE, et al. Clinical value of proton magnetic resonance spectroscopy for differentiating recurrent or residual brain tumor from delayed cerebral necrosis. Int J Radiat Oncol Biol Phys 1996;36:1251-1261 [DOI] [PubMed] [Google Scholar]
- 27.Krouwer HG, Kim TA, Rand SD, et al. Single-voxel proton MR spectroscopy of non-neoplastic brain lesions suggestive of a neoplasm. AJNR Am J Neuroradiol 1998;19:1695-1703 [PMC free article] [PubMed] [Google Scholar]
- 28.Chan YL, Yeung D, Leung SF, Cao G. Proton magnetic resonance spectroscopy of late delayed radiation-induced injury of the brain. J Magn Reson Imaging 1999;10:130-137 [DOI] [PubMed] [Google Scholar]
- 29.Estève F, Rubin C, Grand S, Kolodié H, Le Bas JF. Transient metabolic changes observed with proton MR spectroscopy in normal human brain after radiation therapy. Int J Radiat Oncol Biol Phys 1998;40:279-286 [DOI] [PubMed] [Google Scholar]
- 30.Szigety SK, Allen PS, Huyser-Wierenga D, Urtasun RC. The effect of radiation on normal human CNS as detected by NMR spectroscopy. Int J Radiat Oncol Biol Phys 1993;25:695-701 [DOI] [PubMed] [Google Scholar]
- 31.Bruhn H, Frahm J, Gyngell ML, et al. Noninvasive differentiation of tumors using localized H–1 spectroscopy in vivo: initial experience in patients with cerebral tumors. Radiology 1989;172:541-548 [DOI] [PubMed] [Google Scholar]
- 32.Yousem DM, Lenkinski RE, Evans S, et al. Proton MR spectroscopy of experimental radiation-induced white matter injury. J Comput Assist Tomogr 1992;16:543-548 [DOI] [PubMed] [Google Scholar]
- 33.Saunders DE, Howe FA, van den Boogaart A, Griffiths JR, Brown MM. Aging of the adult human brain: in vivo quantitation of metabolite content with proton magnetic resonance spectroscopy. J Magn Reson Imaging 1999;9:711-716 [DOI] [PubMed] [Google Scholar]
- 34.Sijens PE, van den Bent MJ, Nowak PJ, van Dijk P, Oudkerk M. 1H chemical shift imaging reveals loss of brain tumor choline signal after administration of Gd-contrast. Magn Reson Med 1997;37:222-225 [DOI] [PubMed] [Google Scholar]