

Abstract
Summary: Proton MR spectroscopy is a powerful noninvasive method that enables measurement of certain brain metabolites in healthy subjects and patients with diseases. A major difficulty with clinical and research applications of in vivo proton MR spectroscopy is the variability of metabolite concentrations, especially in regions with substantial physiologic motion. In our preliminary evaluation, we tested the hypothesis that physiologic brain motion leads to lower mean metabolite concentrations and higher SDs for the measured metabolite concentrations.
Methods to minimize the effect of brain motion on spectral data have been proposed in a few articles (1–3); however, only one group (4) has examined, in detail, the effects of physiologic brain motion on metabolite concentrations. Felblinger et al (4) used retrospective gating to acquire water-suppressed spectral data. Each line of data was phased individually on the basis of previously determined phase shifts in the unsuppressed water signal that occur in different parts of the cardiac cycle. In our study, prospective gating was used to synchronize spectral data acquisition with minimal brain motion.
Methods
Theory
The theory involving the signal amplitude and phase of moving spins when they interact with the pulsed gradients used for MR spectroscopy voxel localization is well known (2), and it is analogous to the theory for similar interactions in MR imaging (5). Motion sensitivity with the stimulated-echo acquisition mode (STEAM) sequence is primarily due to gradient A1, which is applied between the first two RF pulses, and gradient A2, which is applied after the third RF pulse and before data acquisition (Fig 1). When bulk motion occurs, the phase of the signal depends on the amplitude G and the duration δ of the gradient pulses A1 and A2, as well as time Δt separating the two gradient pulses. For simplicity, we assume that A1 and A2 are square gradients. The total signal of the stimulated echo at time t = TE is phase modulated, depending on the motion during and between the two gradient pulses. If no motion occurs, the second gradient pulse A2 cancels the effect of the first gradient pulse A1. If bulk motion occurs, the phase Φ of the signal is determined with Equation 1, as follows:
 |
1) |
where r′ is equal for the spins in the region of interest (ROI); it is determined by the initial position ro, the initial velocity υo, and the acceleration a. From Equation 1, if a different amount of motion occurs during acquisition (typically 256 lines of spectral acquisition), it leads to random phase dispersion, and signal averaging may lead to overall signal attenuation. The signal amplitude can also be affected during the acquisition of a single line of data if different parts of the ROI do not move in a parallel fashion. Therefore, rotation, expansion, or contraction of the original ROI leads to signal attenuation in a single line of data because of phase dispersion.
Fig 1.

Schematic representation shows the standard STEAM sequence used. The gradients (x, y, z) are applied along one of the three orthogonal axes for voxel selection, and the gradient waveforms (A1, A2) and shaded gradient waveform during the mixing time (TM) are applied along all three orthogonal axes. The distance between the vertical dashed lines under A1 and A2 represent δ; the distance of the horizontal dashed line represents Δ.
Subjects
Ten men (age range, 35–45 years; mean age, 40 years) were recruited for this study. Informed consent was obtained in accordance with the guidelines of the human subjects committee of our institutional review board. To prevent head motion during data acquisition, the subjects were positioned in the headrest, Velcro straps were placed over their foreheads and attached to the headrest assembly, and foam pads were placed on either side of the head and head coil. To remove any bias between the two acquisitions the subjects were not informed about the purpose of the study.
MR Imaging
The study was performed with a 1.5-T machine by using the quadrature body coil as a transmitter and the quadrature head coil as a receiver to provide images with a high signal-to-noise ratio and spectral data. Three orthogonal plane scout images were acquired, and axial proton density- and T2-weighted fast spin-echo images (3100/16, 96/1 [TR/effective TE/NEX]) were obtained with a section thickness of5 mm, gap of 1 mm, field of view (FOV) of 230 mm, and in-plane image matrix of 256 × 256. For purposes of voxel placement, additional coronal and parasagittal T1-weighted spin-echo pilot images (200/20/1) with a section thickness of 5 mm, a FOV of 240 mm, and an in-plane image matrix of 128 × 256 were acquired through the basal ganglia. An experienced neuroradiologist (B.C.B.) visually interpreted all of the images to ensure that the images were normal.
MR Spectroscopy Part I: Cardiac-gated Water Signal
In five subjects, spectra were obtained from a voxel located in the left basal ganglia region by using the STEAM sequence water suppression. Initial data were acquired by using a 75-millisecond delay from the R wave. Subsequent data were acquired in increments of 75 milliseconds to as long as 750 milliseconds. Global phase correction was performed with the data for each time point by using the spectral processing software provided by the manufacturer. To demonstrate the effect of brain motion on the global phase of the basal ganglia signal in each subject, the difference between the mean global phase correction and the global phase correction at each time delay (75, 150, 225,…, 750 milliseconds) was calculated. The mean global phase correction was the average of the global phase correction for all time delays.
MR Spectroscopy Part II: Water-suppressed Acquisition with and without Cardiac Gating
The remaining five subjects were imaged with and without cardiac gating in five sessions day apart. At each session, imaging was performed, and the cardiac waveform was monitored to determined the mean R-R interval for the subject. For the cardiac-gated water-suppressed STEAM acquisition (2500–2700 /20/12/256; three R-R intervals), the sequence was initiated 400 milliseconds after the R wave. At 400 milliseconds, water suppression RF pulses, as well as gradients along the three orthogonal axes, were applied to dephase the water signal. This process required 260 milliseconds; therefore, subsequent voxel selection occurred at 660 milliseconds. This delay time corresponded to the optimum delay time determined from part I of the study.
For the nongated water-suppressed STEAM acquisition, a TR equal to three R-R intervals was used. To account for subject-to-subject variability in coil loading, the unsuppressed water signal for each acquisition in every subject was normalized to the mean of the unsuppressed water signal for all subjects, and this was divided into the concentration results for the corresponding subject. From session to session, voxel location was reproduced by carefully positioning the subject within the head coil assembly and by referring to regional anatomic landmarks identified by the neuroradiologist (Fig 2). To remove any bias in the data due to the order of the spectral acquisition, gated and nongated acquisitions were alternated from session to session.
Fig 2.
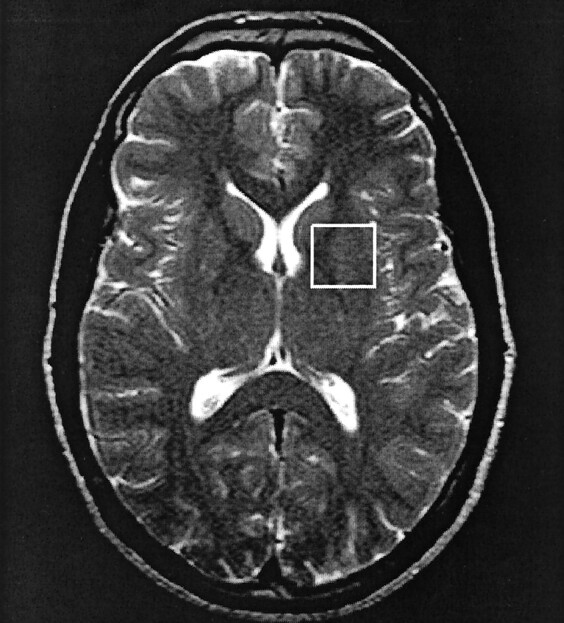
Axial T2-weighted image shows the placement of the 2 × 2 × 2-cm voxel in the left basal ganglia region, where the water-suppressed MR spectroscopic data were acquired.
Spectral Processing
The LCModel method (6) analyzes an in vivo spectrum as a linear combination of model spectra (basis set) obtained from aqueous solutions of the prevalent cerebral metabolites. We acquired the basis set spectra by using a TR of 2600 milliseconds, which is the average of the mean TRs used to acquire the in vivo spectra. The LCModel method is a user-independent, time domain-fitting routine that yields absolute concentrations of the prevalent brain metabolites from the in vivo spectral data. This method exploits the full spectroscopic information of each metabolite and not just isolated resonances. Analysis of complete spectra rather than individual peaks allowed the information in complex spectra to be fully used and permitted the separation of metabolites, even when some overlapping peaks were present. The concentration 2 of in vivo choline (Cho)-containing compounds is expressed as the sum of phosphorylcholine and glycerophosphorycholine (GPC). The concentrations of the metabolites N-acetylaspartate and N-acetylaspartylglutamate, which are co-localized to neurons, are combined and reported as the neuronal marker NA.
Statistical Methods
All statistical tests were performed by using SAS version 8 (SAS Institute, Cary, NC). A multivariate analysis of variance (MANOVA) was performed on the data to simultaneously test the effects of the two methods of acquisition (cardiac gated and nongated) in five metabolite concentrations by using the subjects as blocking factor. Post hoc analyses were conducted on each of the five metabolite concentrations by using univariate analyses of variance (ANOVAs) with a completely randomized block design to test the differences between the two methods. Post hoc analyses with ANOVA were conducted for each metabolite concentration measured with the two methods by using the least square difference (LSD) as a multiple comparison technique. A canonical variate was generated by using the canonical variate analysis technique to determine the space (number of dimensions) of the sample means. In this analysis, the canonical variate was defined as a linear combination of the metabolite concentrations that produce the largest possible F value (Fmax) in ANOVA. Another ANOVA was conducted to compare the effect of the two methods on the canonical variate. Post hoc analysis was conducted with the sample means of the two methods by using the LSD technique. Fmax analyses were conducted to test the homogeneity of the SDs of metabolite concentrations between the two methods.
Results
MR Spectroscopy Part I: Cardiac-Gated Water Signal
The variation in the global phase at different time points in the cardiac cycle relative to the overall mean of the global phase, called the global phase difference, is shown in Figure 3. The error bars at each time point indicate the intersubject deviation in the global phase difference. The maximum global phase difference of 7.5° occurred between the 150- and 225-millisecond delays from the R wave. Large global phase changes were observed in all subjects during the initial 300-millisecond period from the R wave. The global phase difference between the 300- and 600-millisecond delays from the R wave ranged from −0.43° to +0.57°, but a relatively large intersubject variation was noted during this period. The global phase differences were very small after the 600-millisecond delay from the R wave in all individuals. In particular, the small error bar indicated very little intersubject variation compared with that of earlier time points. At the 660-millisecond delay, the global phase difference was nearly 0°.
Fig 3.

Plot shows the global phase difference in the water signal (global phase at each time point minus the mean global phase) in the five subjects. The large change in the global phase difference during the systolic phase (75–300 milliseconds) of the cardiac cycle indicates a large amount of brain motion during that period. A relatively small global phase difference is observed after 300 milliseconds; however, the error bars are large ( 300–600 milliseconds). These indicate that some brain motion occurred in some subjects. The global phase difference and the error bar is small at the 675-millisecond delay; this finding indicates minimal brain motion in all of the subjects.
MR Spectroscopy Part II: Water-Suppressed Acquisition with and without Cardiac Gating
When the MANOVA test was used to simultaneously compare all five metabolite concentrations obtained without gating with those obtained with gating, a significant difference in the two groups was found (Wilkes λ = 0.713, P = .015). With individual metabolites, significant difference was observed for NA (F = 7.82, P= .008) and myo-inositol (Ins) (F = 6.51, P= .014). Nonsignificant differences were observed with creatine (Cr) (F = 1.73, P= .195), Cho (F= 1.49, P = .229), and glutamate and glutamine (Glx) (F = 0.66, P= .420). The results of the LSD analysis for multiple comparisons between the two methods are presented in the Table. For each metabolite, the concentration was larger with the gated method than with the nongated method. Representative spectra acquired with the two methods are shown in Figure 4. The increases in individual metabolite concentrations with the gated method were as follows: 10.75% with NA, 6.84% with Cr, 8.70% with Cho, 21.97% with Ins, and 5.91% with Glx. The canonical correlation analysis showed that the sample means could be connected with a straight line. The ANOVA result of the canonical variate showed that results of the two methods were significantly different (F= 17.74, P < .001). The multiple comparisons between the two methods with the LSD technique indicated a significant difference. The combination of the five metabolite concentrations was higher with the gated method (8.837) than the nongated method (7.645).
Metabolite concentrations with and without cardiac gating
| Metabolite | Concentration (mmol/L) |
|||
|---|---|---|---|---|
| All Subjects, Gated Method* | Individual SDs, Gated Method† | All Subjects, Nongated Method* | Individual SDs, Nongated Method† | |
| NA | 6.842 ± 0.926 | 0.674 | 6.178 ± 0.985 | 0.768 |
| Cr | 6.589 ± 1.195 | 0.931 | 6.167 ± 1.223 | 1.040 |
| Cho | 1.849 ± 0.509 | 0.296 | 1.701 ± 0.531 | 0.383 |
| Ins | 2.665 ± 0.494 | 0.497 | 2.185 ± 0.858 | 0.766 |
| Glx | 12.205 ± 2.599 | 2.299 | 11.524 ± 3.580 | 2.768 |
Note—The mean metabolite concentrations are higher with gated method than with the nongated method and the SDs for each metabolite are lower with gated than with the nongated method
Data are the means ± SDs.
Data are the means.
Fig 4.

Typical STEAM spectrum acquired with (A) and without (B) cardiac gating . The area under each of the metabolite peaks is larger with the data obtained from the gated spectrum compared with that of the nongated spectrum.
The Fmax test indicated a lack of homogeneity in the SDs with some of the five metabolite concentrations, as determined with the two methods. The SDs for Ins and Glx results obtained with the nongated method were significantly larger (P = .05) than those obtained with the gated method. The SDs for the remaining metabolite concentrations were not significantly different with the two methods; however, the gated method had a trend toward a lower SD (Table). Decreases in the SD with the gated method were as follows: 6.4% with NA, 2.3% with Cr, 4.3% with Cho, 73.7% with Ins, and 37.7% with Glx. The average SDs for the individuals were lower with the gated method for all metabolites. When the average SDs in individuals were similarly compared, the percentage decreases with the gated method were as follows: 13.5% with NA, 11.7% with Cr, 29.4% with Cho, 54.1% with Ins, and 20.4% with Glx.
Discussion
The physiologic motion of the brain reflects the response of the brain parenchyma, spinal cord, and CSF to changes in arterial and venous pressure and volume during the cardiac cycle (7, 8). Brain motion along three orthogonal axes (cephalic-caudal, anterior-posterior, and right-left) has been investigated to calculate in-plane strain, a measure of brain parenchyma deformation (9). Theoretical and experimental evaluation of phase-dispersion effects due to brain motion has been assessed, on calculations of the diffusion coefficient with MR imaging. The use of cardiac gating with an appropriate delay from the R wave or with a modification of the gradient waveforms has been shown to minimize the errors in the calculation of diffusion coefficients (10). The primary MR imaging techniques that have been developed to overcome the artifacts generated from flowing blood and CSF and other physiologic motions are the following: spatial presaturation, cardiac gating, and gradient waveform design (5, 7, 11).
To our knowledge, the effect of brain motion on the point-resolved spectroscopy (PRESS) technique has not been reported. The PRESS sequence uses a 90° RF pulse for excitation and two 180° refocusing pulses for voxel selection and generation of spectral data, which is analogous to even-echo rephasing in MR imaging (12). Even echoes on MR images are less susceptible to flow and motion (12); therefore, we focused our experiments on STEAM, because this sequence was inherently more sensitive to physiologic motion of the brain.
The possible susceptibility of cerebral proton MR spectroscopy, particularly diffusion-weighted MR spectroscopy, to physiologic motion, has been recognized (3), and corrective methods for single-voxel MR spectroscopic techniques have been suggested (2, 4). The present study was undertaken to quantitatively determine the effects of physiologic motion on quantitative proton MR spectroscopy of the basal ganglia region of the brain by using a standard manufacturer-supplied single-voxel STEAM technique.
The results of this study indicate that physiologic motion of the brain alters the global phase of the water signal. The maximum phase change in the sampled region (basal ganglia) occurred between the 150- and 225-millisecond delays from the R wave; this result indicates that brain motion is greatest between these time points in the cardiac cycle. This finding is similar to the results reported by Felblinger et al (4), who found that the maximum deviation in the global phase of the water signal from the frontal white matter occurred during ventricular systole, with a 180-millisecond delay from the R wave. Wirestam et al (10) evaluated the phase-dispersion effects of physiologic brain motion on diffusion and perfusion MR images and found that the maximum effect in the region of the thalamus occurred with a 176-millisecond delay from the R wave.
As shown in Figure 3, the deviation of the global phase from the mean global phase (global phase difference) was at a minimum for all volunteers at the 600- and 675-millisecond delays from the R wave. Although the mean of the global phase difference at the 660-millisecond delay was closer to 0 than that at 675-millisecond delay, the range of error was less with a 675-millisecond delay. On the basis of these results, a delay setting of 660 milliseconds for the water-suppressed STEAM acquisitions was chosen.
Comparing gated acquisition (with a 660-millisecond delay) with nongated acquisition, we found that all metabolite concentrations were larger with the gated method (Table). This finding implies that the delay time and, hence, cardiac cycle–dependent brain motion affects basal ganglia metabolite concentrations. By acquiring spectra at the time of minimal brain motion, the areas under the metabolite peaks and, hence, the calculated metabolite concentrations are generally increased. With NA and Ins, the increase in concentration with the gated method was statistically significant. With Cr, Cho, and Glx, the increases were not significant; however, the gated method had a trend toward higher concentrations. The concentration increase with Cr, Cho, and Glx may not have been significant for two reasons. The first reason is related to the use of prospective gating in this study. As a result of gating, TR varied slightly from subject to subject. The variation in TR could have increased the SD of the measured concentrations because of T1 relaxation effects on the signal intensity. The T1 effects on TR were minimized by acquiring the in vitro basis set data with a TR of 2600 milliseconds (the average of the TRs used for the gated and nongated studies). The second reason is that the size of the subject groups may not have been large enough to allow detection of a significant difference in Cr, Cho, and Glx concentrations, although the trend toward higher concentrations with these metabolites supports the hypothesis regarding brain motion.
In this study, the differences in metabolite concentrations between the nongated and prospectively gated methods ranged from 5.9% to 21%. This range is greater than the 6%–7% reported by Felblinger et al (4), who used retrospective gating to acquire water-suppressed spectral data. Each line of data was phased individually, on the basis of previously determined phase shifts in the unsuppressed water signal that occur at different parts of the cardiac cycle. In our study, prospective gating was used to synchronize spectral data acquisition with minimal brain motion. In their method, signal dephasing due to brain motion within each line of data may have led to smaller increases in concentrations. In our method, data acquisition occurred when brain motion was at a minimum, hence within-the-line motion dephasing was not factor.
Another factor that may account for greater concentration differences in our study is the use of a larger voxel size (8 cm3), which may be more sensitive to the dephasing effects of non linear brain motion than the smaller voxel (2.25 cm3) used by Felblinger et al (4). An additional factor that could have affected the concentration differences is the location of the voxel. Wirestam et al (10) showed that a rapid motion wave occurs near the center of the brain. This rapid motion is in the systolic phase; it is directed caudally and decreases in amplitude as it moves toward the surface of the brain.
The SDs for each of the metabolites were lower with the gated method than with the nongated method (Table), but only the differences in Ins and Glx concentrations were significant. The Ins and Glx resonances each consisted of a set of closely coupled peaks, and these had relatively small areas compared with those of the other metabolites, such as NA. Consequently, a small increase in the Ins or Glx peak areas can have a substantial effect on the accuracy of area measurements that affect concentration values, with other factors being equal.
As observed on MR images, moving spins that interact with imaging gradients produce phase shifts so that the signal is randomly distributed along the phase-encode direction. By the same analogy, moving spins that interact with spectroscopic acquisition gradients also produce phase shifts, which shorten T2 relaxation times. These may propagate random signals, which, in this case, occur in the frequency direction. This interaction can decrease the overall signal-to-noise ratio, which has a greater effect on the SDs of metabolite with lower peak areas. With in vivo spectroscopy, Ziegler et al (1) showed that the signal-to-noise ratio in the presence of motion can be improved with the coaddition of individually phased spectra in the final data set. The reduced SDs among subjects with the larger peaks (2.3–6.4%) supports the conclusions from previous studies, which showed that the overall decrease in the signal-to-noise ratio is less with the larger peaks. The average SDs within individuals markedly improved in the larger peaks (11.7%–29.4%), because the differences in metabolite concentrations between subjects were eliminated. Felblinger et al (4) showed that the SDs among subjects were reduced from 2% to 1%. The discrepancies between their results and ours may be explained by the same three factors described earlier: 1) dephasing effects within the each line of data caused by brain motion, 2) differences in the size of the voxel, and 3) the location of the voxel.
The method presented in this article differs from that of Felblinger et al primarily because the use of prospective gating does not require phasing of individual lines of spectral data, and it prevents the effect of signal dephasing within a line of data. This method simplifies spectral analysis and markedly shortens the overall processing time.
Conclusion
Our preliminary results indicate that the physiologic motion of the brain reduces the metabolite concentration and increases the overall SD of the metabolite concentrations. Future development, such as the incorporation of motion-correction gradient waveforms into the STEAM sequence, would be beneficial; this technique eliminates cardiac gating, which alters the TR on the basis of differences in heart rates between subjects. Therefore, it would further reduce the SD of the spectral data.
References
- 1.Ziegler A, Decorp M. Signal-to-noise improvement in in-vivo spin-echo spectroscopy in the presence of motion. J Magn Reson 1993;102:26–34 [Google Scholar]
- 2.Posse S, Cuenod CA, LeBihan D. Motion artifact compensation in 1H spectroscopic imaging by signal tracking. J Magn Reson 1993;102:222–227 [Google Scholar]
- 3.Posse S, Cuenod CA, LeBihan D. Human brain: proton diffusion MR spectroscopy. Radiology 1993;188:719–725 [DOI] [PubMed] [Google Scholar]
- 4.Felblinger J, Kreis R, Boesch C. Effects of physiologic motion of the human brain upon quantitative 1H-MRS: analysis and correction by retro-gating. NMR Biomed 1998;11:107–114 [DOI] [PubMed] [Google Scholar]
- 5.Pattany PM, Phillips JJ, Chiu JC, et al. Motion artifact suppression technique (MAST) for MR Imaging. J Comput Assist Tomogr 1987;2:369–377 [DOI] [PubMed] [Google Scholar]
- 6.Provencher SW. Estimation of metabolite concentrations from localized in vivo proton NMR spectra. Magn Reson Med 1993;30:672–679 [DOI] [PubMed] [Google Scholar]
- 7.Bergstrand G, Bergstrom M, Nordell B, et al. Cardiac gated MR imaging of the cerebrospinal fluid flow. J Comput Assist Tomogr 1985;9:1003–1006 [DOI] [PubMed] [Google Scholar]
- 8.Feinberg DA, Mark AS. Human brain motion and cerebrospinal fluid flow circulation demonstrated with MR velocity imaging. Radiology 1987;163:793–799 [DOI] [PubMed] [Google Scholar]
- 9.Poncelot BP, Wedeen VJ, Weiskoff RM, Cohen MS. Brain parenchyma motion measurement with cine echo-planar MR imaging. Radiology 1992;185:645–651 [DOI] [PubMed] [Google Scholar]
- 10.Wirestam R, Greitz D, Thomsen C, Brockstedt S, et al. Theoretical and experimental evaluation of phase-dispersion effects caused by brain motion in diffusion and perfusion MR imaging. J Magn Reson Imaging 1996;6:348–355 [DOI] [PubMed] [Google Scholar]
- 11.Felmlee JP, Ehman RL. Spatial presaturation: a method for suppressing flow artifacts and improving depiction of vascular anatomy in MR imaging. Radiology 1987;164:559–564 [DOI] [PubMed] [Google Scholar]
- 12.Waluch V, Bradley WG. NMR even echo rephasing in slow laminar flow. J Comput Assist Tomogr 1984;8:594–598 [DOI] [PubMed] [Google Scholar]