Abstract
BACKGROUND AND PURPOSE: Elevated relative regional cerebral blood volume (rCBV) reflects the increased microvascularity that is associated with brain tumors. The purpose of this study was to investigate the potential role of rCBV in the determination of recurrent/residual disease in patients with treated gliomas.
METHODS: Thirty-one rCBV studies were performed in 19 patients with treated gliomas. All patients also had proton MR spectroscopy and conventional MR imaging. Regions of abnormality were identified on conventional MR images by two neuroradiologists and compared with rCBV and MR spectroscopic data. Metabolites and rCBV were quantified and compared in abnormal regions.
RESULTS: In high-grade tumors, rCBV values were proportional to choline in regions of tumor and nonviable tissue. Although the presence of residual/recurrent disease was often ambiguous on conventional MR images, the rCBV maps indicated regions of elevated vascularity in all low-grade tumors and in 12 of 17 grade IV lesions. Regions of elevated and low rCBV corresponded well with spectra, indicating tumor and nonviable tissue, respectively.
CONCLUSION: This study suggests that rCBV maps and MR spectroscopy are complementary techniques that may improve the detection of residual/recurrent tumor in patients with treated gliomas. Compared with the spectra, the rCBV maps may better reflect the heterogeneity of the tumor regions because of their higher resolution. The multiple markers of MR spectroscopy enable better discrimination between normal and abnormal tissue than do the rCBV maps.
The differentiation of tumor from treatment-induced necrosis and edema is critical in evaluating the response to therapy among patients with gliomas. Although conventional MR imaging is valuable in the overall assessment of such lesions, it is often difficult to differentiate persistent or recurrent tumor from post-treatment changes. For example, contrast-enhancing regions on T1-weighted images may reflect either residual/recurrent tumor or treatment-induced necrosis. There may also be significant regions of nonenhancing tumor that are indistinguishable from edema and other post-treatment effects in terms of their intensity characteristics on T2- or T1-weighted images. Techniques that measure functional characteristics of brain tissue are other possible methods to evaluate residual or recurrent tumor. For these techniques to be useful, their characteristics in treated patients must first be understood. Regional cerebral blood volume (rCBV) mapping (1–7) and proton MR spectroscopy (8–16) are MR imaging techniques that measure functional characteristics of brain tissue and that may assist in distinguishing tumor from necrosis, post-treatment effects, and edema. The possible utility of these techniques in determining recurrent/residual tumor was evaluated by studying the characteristics of rCBV and MR spectroscopy in patients with treated gliomas.
Dynamic susceptibility contrast imaging can be performed relatively rapidly within the same examination as conventional MR imaging and used to determine both relative and absolute rCBV (1–7, 17–26). The rationale for using rCBV to characterize brain tumors is that tumors are associated with increased microvascularity while necrosis is associated with decreased microvascularity (1–7). Comparisons of rCBV with histologic sections in patients with glioma have indicated a significant relationship between tumor vascularity and maximum tumor rCBV (5).
rCBV values have also been measured clinically for gray and white matter in normal, ischemic, irradiated, and diseased tissue (6). The absolute rCBV values for normal-appearing gray and white matter were found to decrease in patients who had received whole-brain radiation treatment, whereas patients who had received fractionated radiation therapy showed no significant change (6). Although the ratio of gray to white matter rCBV did not appear to change significantly in either group of patients, this result suggests that normal-appearing regions that are used for comparison must be chosen outside the treated volume. The rCBV was also found to decrease in the low-grade astrocytomas studied after treatment (6, 7), which indicates that the relative blood volume in treated gliomas may be less than in untreated tumors.
MR spectroscopy has shown great promise in helping to distinguish among tumor, normal tissue, and nonviable tissue, including necrosis, edema, gliosis, and cysts (8–16). This distinction is provided by the relative levels of the metabolites choline (Cho), creatine (Cr), and N-acetyl aspartate (NAA). Decreased NAA and elevated Cho are associated with tumor, whereas significant decreases in all metabolites are associated with nonviable tissue. Studies of response in gliomas after brachytherapy have shown increased Cho levels associated with tumor progression and decreased Cho in regions treated with high-dose radiation (15). The limitations of MR spectroscopy arise from its relatively coarse spatial resolution.
The higher resolution of rCBV maps and the possibly improved specificity of MR spectroscopy due to multiple metabolic markers suggest that these two functional imaging techniques may be complementary for the assessment of response to therapy. With recent advances in hardware and software, it is now possible to perform both types of studies within the same examination and thereby to decrease the time and effort needed to perform these procedures. To better understand the role of rCBV and MR spectroscopy in determining the presence and extent of tumor, we compared conventional MR imaging characteristics, rCBV, and proton spectroscopic data in 31 studies of 19 patients with treated gliomas. This study had two components: the first was a visual comparison of conventional MR images, rCBV maps, and spectral data; the second was a quantitative comparison of rCBV and metabolite levels.
Methods
Thirty-one MR imaging studies were performed, including conventional MR imaging, CBV mapping, and proton MR spectroscopy. All images and spectra were acquired on a GE 1.5-T magnet with a GE Echospeed system.
Patients
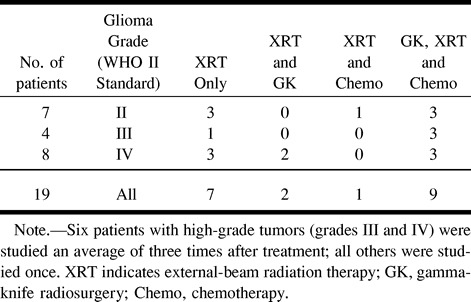
MR examinations were performed in 19 patients with primary gliomas. On the basis of the World Health Organization II grading system, eight patients (17 studies) had grade IV gliomas, four patients (seven studies) had grade III gliomas, and seven patients (seven studies) had grade II gliomas. The study group included seven women and 12 men with an overall mean age of 41 years. Table 1 summarizes the diagnosis and treatment in these patients. The six patients with high-grade tumors who received multiple MR examinations were studied an average of three times each. Informed consent was obtained from all patients for these studies, in accordance with the guidelines of the Committee on Human Research at this institution.
TABLE 1:
Diagnosis and treatment in 19 patients with primary glioma
In each study, which lasted 1.5 hours, T2- and proton density–weighted images were acquired using a spin-echo sequence with a TR/TE of 2500/30/80, a slice thickness of 3 mm, and a rectangular field of view (FOV) of 240 × 180 mm. Precontrast T1-weighted spoiled gradient-recalled (SPGR) volume images were then acquired with a slice thickness of 1.5 mm, a rectangular FOV, a TR/TE of 32/8, and a flip angle of 45°. A bolus of 0.1 mmol/kg body weight of contrast material was injected rapidly by hand into an antecubital vein at a rate of about 5 mL/s. Dynamic susceptibility-contrast echo-planar spin-echo (EPI-SE) images were acquired before, during, and after the bolus injection for a total of 60 time points and a TR/TE of 1500/100 or 1700/100 with corresponding time resolutions of 1.5 and 1.7 seconds, an FOV of 40 × 20 cm, a 256 × 64 matrix, and an acquisition time of 126 seconds. A postcontrast T1-weighted SPGR volume was acquired with the same parameters as the precontrast sequence, followed by 3D point-resolved chemical-shift imaging proton spectroscopy. The spectroscopic examinations were performed with a TR/TE of 1000/144, a nominal voxel size of 10 × 10 × 10 mm, phase-encode arrays of 8 × 8 × 8 (two excitations) or 16 × 8 × 8 (one excitation), and an acquisition time of 17 minutes with a preparation time of 5 to 10 minutes, as described previously (14).
Analysis of Conventional MR Imaging Data
The T2-, proton density-, and precontrast T1-weighted images were aligned with the postcontrast T1-weighted volume (14). The postcontrast T1-weighted volume was assumed to be aligned with the EPI-SE images and the spectroscopic data; this assumption is reasonable, since the EPI-SE series and the spectroscopic examination were acquired shortly before and after the postcontrast T1-weighted images, respectively.
The conventional MR imaging data were assessed by the neuroradiologists participating in the study to identify regions of post-treatment changes, edema, tumor, necrosis, cyst, hemorrhage, or other nontumoral disease. These interpretations were not confirmed by histologic analysis, and they represent the interpretation of MR images as is usually done for the management of treated glioma patients. Since most of these patients had been treated by external-beam radiation, gamma-knife surgery, or chemotherapy, it was generally not possible to distinguish residual or recurrent tumor from treatment-induced effects by means of conventional MR imaging alone. Therefore, most abnormal regions were considered by the neuroradiologists to consist of possible combinations of post-treatment changes, edema, and residual or recurrent tumor.
Calculation of rCBV
The changes in signal intensity as a function of time were used to calculate the rCBV maps and numerical rCBV values. This calculation was based on the assumption that paramagnetic contrast agents increase the T2 rates by virtue of susceptibility differences between the agent and tissue, as previously shown by several authors (17, 18). The MR signal intensity was assumed to be described by the equation
 |
where E1 is the T1-weighted term, S0 is the prebolus signal intensity, TR and TE are the repetition and echo times, respectively, and ΔR2 and ΔR1 are the changes in T2 and T1 relaxation rates, respectively, caused by the presence of the contrast agent.
In previous T2-weighted SE experiments, empirical results and Monte-Carlo simulations established a linear relationship between the change in T2 rate, ΔR2, and the concentration, C, of the paramagnetic agent (18, 22, 23). Therefore, neglecting the T1-weighted dependence in equation 1 (E1 term),
 |
where k depends on the tissue relaxivity, the static magnetic field, and the pulse sequence. This mechanism has been exploited to create rCBV maps from the relative concentration-time curves C(t) of the contrast agent in the cerebral vasculature. Figure 1A shows a typical signal and associated concentration curves for nonenhancing regions.
fig 1.
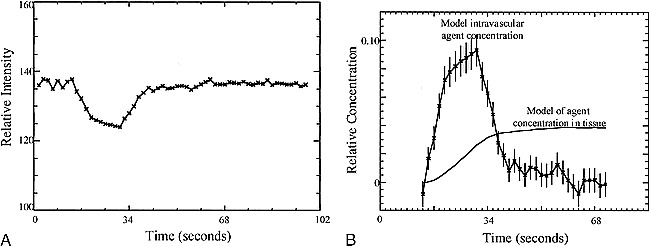
A, MR signal versus time curves for the empirical model ROI. The signal was taken from an ROI of all nonenhancing pixels from the hemisphere contralateral to the abnormality.
B, Time courses for the empirical model of vascular concentration (with error bars) and for the associated tissue concentration. The intravascular concentration model was obtained from the time curve for nonenhancing pixels shown in A. The model of contrast agent concentration in the tissue was calculated from the empirical model of the intravascular concentration.
In cases in which the blood-brain barrier breaks down, there is leakage of contrast agent into the extravascular space. This leakage of contrast material into tissue leads to signal enhancement caused by the T1-weighted dependence of the EPI-SE sequence (E1 term in Equation 1), as can be seen in the examples shown in Figures 2A and 3A. This effect reduces the signal loss due to susceptibility contrast and would lead to an underestimation of the rCBV values. Corrections for the rCBV calculations in these cases have been proposed (Weisskoff RM, Boxerman JL, Sorensen AG, Kulke SM, Campbell TA, Rosen BR. “Simultaneous Blood Volume and Permeability Mapping Using a Single Gd-Based Contrast Injection.” Paper presented at the Second Scientific Meeting of the Society of Magnetic Resonance, San Francisco, 1994) and have been used to calculate rCBV and relative permeability information simultaneously. The application of this technique in a patient for whom the MR images and proton spectra indicated a contrast-enhancing tumor (Fig 2) and contrast-enhancing necrosis (Fig 3) are shown; Figures 2B and 3B are the corrected vascular concentration time course curves. This technique assumes no change in response functions over the image slice and ignores effects caused by recirculation.
fig 2.
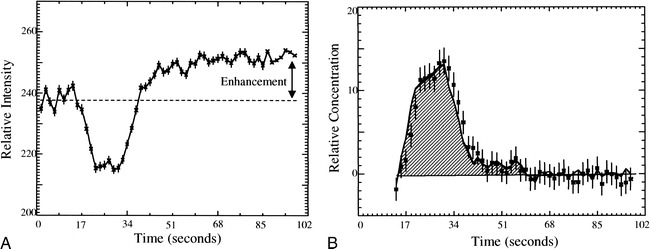
A, The measured signal versus time for a moderately enhancing region of a recurrent anaplastic astrocytoma. Enhancement of the signal after the bolus arrival is due to the leakage of contrast agent into the extravascular space.
B, The vascular concentration versus time corrected for the leakage of contrast agent into the tissue for the ROI described in A. The corrected rCBV (shaded area) is twice that of normal white matter.
fig 3.
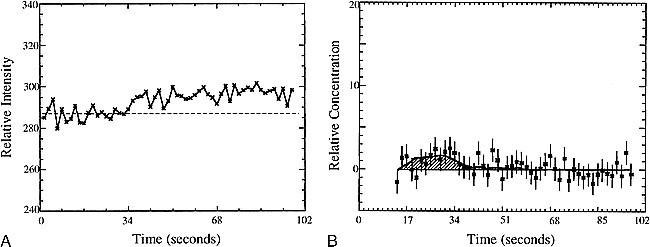
A, The measured signal versus time for a contrast-enhancing region with Cho/normal Cho = 0.4.
B, The vascular concentration after correction for leakage (squares) and model fit (smooth line) versus time for the ROI described in A. The calculated rCBV (shaded area) is one fourth the rCBV of normal white matter.
Relative rCBV maps were made by first calculating C(t) from Equation 3, where S0 is an average of the prebolus signal values for each pixel. For pixels without enhancement, the rCBV map value was obtained by directly integrating C(t). The corrected rCBV and permeability weighted map values were calculated for enhancing regions.
Reconstruction and Quantification of MR Spectroscopic Data
The spectral data were baseline corrected, apodized, filtered, Fourier transformed, and quantified using software developed in this laboratory (14). Since these were 3D acquisitions, the spectra could be reconstructed to coincide with the region of interest (ROI) specified in three dimensions by using these programs.
The abnormal proton spectra were classified into three categories based on their levels relative to the average spectra from normal-appearing regions on conventional MR images. Spectra with no significant NAA, Cr, or Cho resonances (less than 3 SD of the noise values) were assumed to correspond to nonviable tissue. Spectra with Cho levels greater than NAA levels and more than 3 SD above noise (but less than 2 SD above normal) values were assumed to correspond to possible tumor. Spectra with Cho levels at least 2 SD above normal were assumed to correspond to tumor.
Visual Assessment of rCBV Maps
The regions interpreted on conventional MR images and labeled by the neuroradiologists were then examined on the rCBV maps for hypointense, hyperintense, or isointense rCBV signal relative to normal white matter. MR image regions that contained two distinct regions of rCBV signal intensity were counted as two regions. The results of this visual assessment were then compared with proton spectra from corresponding regions. A subset of 10 patients' images were interpreted by both neuroradiologists to investigate reader variability. The results of the 10 studies indicated no variability in the definition of regions on the MR images and very few differences in the visual assessment of rCBV maps. The remaining 21 studies were then interpreted by one neuroradiologist.
Quantitative Comparison of rCBV and Proton Spectra
When possible, two voxels of abnormal proton spectra were chosen for each study for quantitative comparison with rCBV. The abnormal voxels chosen were restricted to those with significantly reduced levels of NAA. One voxel was chosen to have significantly reduced Cho and the other to have normal or elevated Cho. To correlate the spectra and rCBV, the proton spectra were reconstructed to have the voxels of interest coincide with the centers of the EPI-SE images in the slice direction. The rCBV values were normalized to contralateral normal-appearing white matter rCBV values. The normal-appearing white matter regions were segmented by thresholding based on histograms of postcontrast T1- and T2-weighted images that were resampled to the FOV, resolution, and acquisition center of the EPI-SE images.
Results
The results include visual and quantitative comparisons of rCBV maps and MR spectroscopic data. The visual comparisons produced correlations between conventional MR images, rCBV maps, and MR spectroscopic data. These showed that 1) nonenhancing regions with tumor/post-treatment effects/edema tended toward hypovascularity and that 2) contrast-enhancing regions with tumor/post-treatment effects corresponded strongly with hypervascularity. The hypovascular rCBV regions visually assessed on the rCBV maps were strongly associated with low levels of metabolites while the hypervascular regions were associated with high-Cho, low-NAA spectra. The quantitative comparison was used to determine the relationship between rCBV and Cho levels. This relationship for ROIs in areas of disease was consistent with the results of visual assessment. Although six patients with high-grade tumors were studied an average of three times, the results were found to be the same if only one examination from each patient was considered. Moreover, patients were likely to have either progression or additional treatments between studies, which reduces the redundancy of the data from any individual.
Visual Assessment: Conventional MRImaging Results
The most commonly identified regions on conventional MR images were areas of nonenhancement. A distinction between tumor and edema/post-treatment changes could not be made on the MR images. Such regions were found in all patients. The second most common observation was contrast-enhancing regions. For most of these regions, the MR images could not be used to differentiate tumor from post-treatment changes.
Visual Assessment: Comparison of rCBVMaps and MR Images
Table 2 summarizes the results of the radiologists' visual assessment of the rCBV maps for the regions interpreted on the conventional MR images. Of the 207 nonenhancing regions with possible post-treatment changes/edema/tumor, 180 had low rCBV relative to normal white matter, 17 had rCBV similar to normal white matter, and 10 had rCBV above that of normal white matter. Most of the contrast-enhancing regions interpreted from the MR images as representing possible tumor/post-treatment changes had rCBV above normal white matter (100 of 174), 32 regions corresponded to CBV map regions that were similar to normal white matter, and 42 regions had rCBV below that of normal white matter. All 12 regions interpreted from the MR images as representing necrotic/post-treatment changes and 56 cystic/surgical cavity regions had decreased rCBV relative to normal white matter. The two regions considered to represent infarct/post-treatment changes and the three regions regarded as hemorrhage/tumor/post-treatment changes also had decreased rCBV relative to normal-appearing white matter. Two regions with low rCBV and one region with high rCBV appeared normal on the conventional MR images.
TABLE 2:
Visual assessment of MR images versus relative intensity for the corresponding regions on the rCBV maps
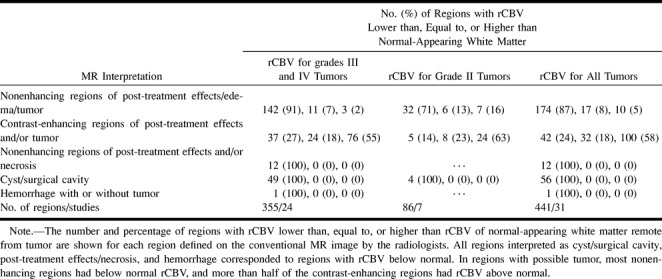
For high-grade lesions, almost all nonenhancing regions interpreted from MR images as tumor/post-treatment changes/edema had rCBV that was lower than (91%) or similar to (7%) normal white matter. On the other hand, more than half the contrast-enhancing regions interpreted from MR images as tumor/post-treatment changes had rCBV above normal-appearing white matter.
A contrast-enhanced T1-weighted image and rCBV map of a patient with glioblastoma multiforme (grade IV) are shown in Figure 4A and B, respectively. These images were acquired 14 months after subtotal resection, 11 months after the start of hyperfractionated external-beam radiation treatment, and 8 months after brachytherapy implants. The rCBV map indicated an increase in hypervascularity in contrast-enhancing regions, which suggested tumor recurrence. This was confirmed by findings from a second resection that was performed 2 weeks after this examination.
fig 4.
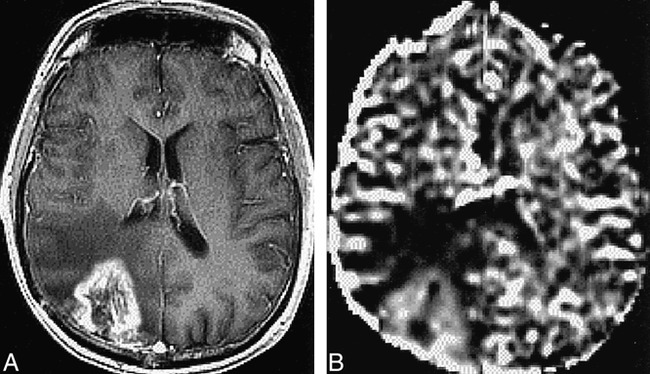
A and B, Contrast-enhanced T1-weighted image (32/8/1) (A) and rCBV map (B) for a patient with glioblastoma multiforme. The rCBV is increased in the region coincident with contrast-enhancement on the T1-weighted image and decreased in the nonenhancing region with possible tumor/edema/post-treatment effects. The contrast-enhancing region was resected and the histologic examination indicated recurrent tumor
Visual Assessment: Comparison of ProtonSpectra and MR Images
A strong correlation (P < .001) was found between MR imaging regions identified as abnormal by the neuroradiologists and the corresponding spectral types. All regions interpreted from MR images as cyst, post-treatment necrosis, or hemorrhage/tumor had significantly decreased levels of NAA, Cr, and Cho (nonviable tissue spectral pattern). Contrast-enhancing regions believed to be possible combinations of tumor and post-treatment effects on conventional MR images corresponded mostly to spectra with Cho levels above NAA but not elevated above normal levels (possible tumor spectral pattern) or spectra with Cho elevated above normal levels and NAA greatly reduced (tumor spectral pattern). Nonenhancing regions interpreted as possible combinations of post-treatment effects, edema, and/or tumor corresponded mostly to a spectral pattern of nonviable tissue or possible tumor, with very few voxels having a spectral pattern of tumor. These regions tended to be larger than the contrast-enhancing regions. The scarcity of regions with tumor spectral patterns may reflect partial voluming close to the edge of the lesion rather than the absence of tumor.
Visual Assessment: Comparison of rCBVMaps and Proton Spectra
The results of the comparison between rCBV maps and proton spectra are summarized in Figure 5. The χ2 statistic indicated a strong correlation (P < .001) between these variables. The regions with rCBV intensities below normal contralateral white matter were found to have spectra with low NAA, Cho, and Cr, with Cho spectra above NAA but lower than or equal to normal Cho values (spectral patterns of nonviable tissue and possible tumor). The regions with normal-appearing rCBV intensity corresponded to regions with normal Cho levels and to areas with spectra of mixed high and low Cho levels. Regions with above-normal rCBV intensities corresponded to spectra with low NAA and high-to-normal Cho levels. Furthermore, for hypointense regions on the rCBV map, there were no corresponding tumor spectral patterns. Similarly, for regions that were hyperintense on the rCBV map, there were no corresponding nonviable tissue spectral patterns. Examples of correlations between MR imaging findings, rCBV values, and MR spectra are shown in Figures 6 and 7.
fig 5.
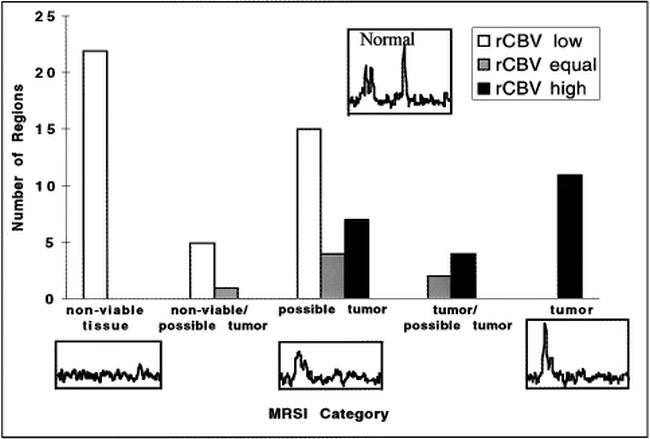
Correlations of MR spectroscopy (MRSI) and rCBV for regions interpreted on the conventional MR images for all gliomas. There was a strong correlation (P < .001) between the rCBV assessed from the maps and their corresponding spectra. In particular, no clear tumor spectral pattern was found in the regions with rCBV below normal. Tumor spectral patterns were found in 15 of 22 regions with elevated rCBV; the remaining seven regions had spectral patterns suggestive of possible tumor. Regions on the rCBV map were determined to be lower than, equal to, or higher than the rCBV of normal-appearing contralateral white matter remote from tumor and outside the treatment port
fig 6.
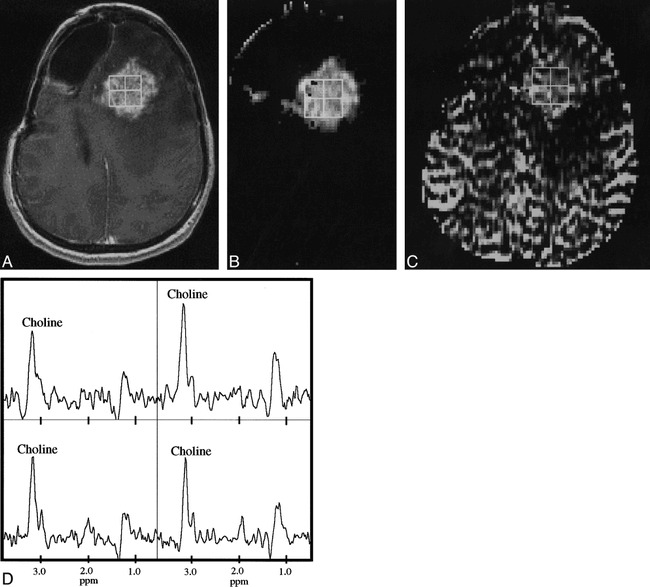
A–D, Contrast-enhanced T1-weighted (32/8/1) image (A) permeability-weighted image (B), rCBV map (C), and corresponding proton spectra (D) for a patient with recurrent anaplastic astrocytoma. Note that the intensity of the rCBV map is markedly lower in the regions of reduced intensity posterior to the contrast-enhanced T1-weighted image, which may correspond to a region of edema or infiltrative nonenhancing tumor. The 2 × 2 array of proton spectra from voxels corresponding to the contrast-enhancing lesion indicate tumor, as evidenced by elevated levels of Cho, negligible NAA, and a resonance corresponding to lactate or lipid
Quantitative Comparison of rCBV and Cho
A quantitative comparison of rCBV versus metabolite levels was obtained for high-grade lesions only, since the number of voxels for lower grade tumors was too few to make a statistically significant fit. Fits to concentration data from ROIs were performed in the regions identified as abnormal on conventional MR images and for which proton spectra were acquired. When possible, two ROIs were chosen to correspond to spectra with NAA at least 2 SD below normal: one ROI with normal-to-high Cho levels and one with very low Cho levels. After the elimination of regions for which the spectral quality was poor or the rCBV fit unacceptable (27), 35 spectral voxels were available for this comparison. These voxels had Cho values ranging from 0.0 to 2.3 times normal and NAA values ranging from 0.0 to 0.5 times the normal spectral values. The results of a linear regression analysis of normalized rCBV values against the corresponding normalized Cho values are shown in Figure 8. The correlation indicated that the blood volume values were proportional to the Cho values (r = .97). This relationship also indicates that in order for rCBV to be near gray matter values (2.0 to 2.3 times that of white matter), the corresponding spectra would have to have Cho levels that were 2.0 to 3.0 times normal. While this is sometimes the case, most treated glioma patients had Cho levels less than 1.5 times normal (15). Therefore, rCBV will tend to be below gray matter values, even in regions of tumor for this patient population.
fig 8.
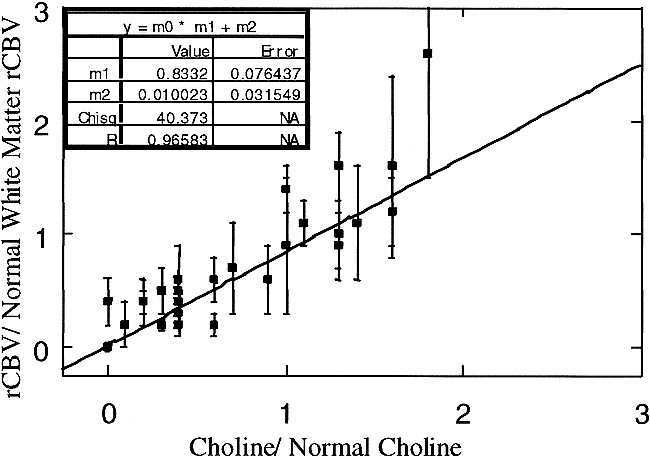
Normalized rCBV versus normalized Cho for low Cho/low NAA spectra and spectra with normal to elevated Cho and reduced NAA
Discussion
The survival rate for patients with cerebral gliomas is relatively poor and may depend on the effectiveness of treatment, such as surgery, radiation therapy, and chemotherapy. The assessment of response to therapy requires an accurate definition of tumor presence and extent. Since conventional MR imaging is limited in its ability to assess tumor volume in treated patients, the emergence of new technologies that can better define tumor presence and extent is important for the assessment of response to therapy.
The effectiveness of imaging techniques in the assessment of tumor presence and extent in untreated patients cannot be assumed to be the same as in treated patients. The evaluation of patients with treated gliomas is more complex and is often difficult by conventional MR imaging alone. Although positron emission tomography with 18F-fluorodeoxyglucose (FDG-PET) has been used for patients with untreated gliomas, there have been reports of difficulties in interpreting scans obtained after radiation therapy (28–31). Although blood volume maps are similar to FDG-PET scans in that they have high signal intensity in normal tissue, such as the cortex, there are possible advantages to this technique over FDG-PET studies. The rCBV measurements can be part of the clinical MR imaging examination and so add little to standard costs and patient inconvenience as compared with FDG-PET.
For rCBV maps to be useful for patients with treated gliomas, it must first be shown that rCBV values in these patients can be used to distinguish tumor from treatment effects and necrosis. Previous studies have shown that rCBV above that of normal white matter corresponds to tumor (5). Additionally, spectral patterns with highly elevated Cho (more than 2 SD above normal) and decreased NAA have been shown to indicate tumor (Dowling C, Vigneron DB, Day MR, et al. “Correlation of Preoperative MR Spectroscopic Imaging with Subsequent Histologic Examination in Brain Tumor Patients with a Mass Lesion.” Paper presented at the annual meeting of the American Society of Neuroradiology, Toronto, 1997). A comparison of rCBV with proton spectra provides an indirect indication of the ability of this technique to assess tumor presence in these patients. The current study indicates that blood volume maps are useful for determining tissue viability in patients who have been treated, and that the combination of rCBV and proton spectroscopy may provide a higher degree of confidence in distinguishing tumor from necrosis.
The rCBV characteristics of treated patients indicate a trend toward normal to increased rCBV in contrast-enhancing regions and decreased rCBV in nonenhancing regions. However, a prospective study using a uniform treatment protocol and study time points is needed to confirm these findings.
Of all the regions in which conventional MR imaging suggested possible tumor, about 13% had normal-appearing rCBV. The significance of this finding is not clear, since the spectra in most of these regions were of the pattern that has so far only been characterized as possible tumor. Tumor in these regions cannot be ruled out, because previous studies have indicated that normal-appearing rCBV in high-grade gliomas corresponds to tumor and micronecrosis (5), and it is unknown whether the effects of therapy may lead to normal-appearing rCBV in regions of tumor.
Contrast-enhancing regions in all low-grade gliomas corresponded to tumor, as indicated by elevated blood volume and highly elevated Cho/decreased NAA spectral patterns. On the other hand, in the high-grade tumors, elevated blood volume in contrast-enhancing regions corresponded to spectral patterns with decreased NAA and either highly elevated or nearly normal Cho (within 2 SD of normal). Although spectral patterns with nearly normal Cho and decreased NAA are not always tumor, they may represent partial voluming of tumor and necrosis, which is common in high-grade tumors.
For nonenhancing regions in low-grade tumors, elevated blood volume corresponded to spectra that indicate tumor (highly elevated Cho/decreased NAA). Very few nonenhancing regions with elevated blood volume were observed for the higher grade gliomas.
In many cases, rCBV and MR spectroscopy complement each other in their ability to provide improved tissue characterization. The heterogeneous rCBV values found in this study for high-grade gliomas agree with previous studies of rCBV maps of untreated gliomas (4, 5). As a result of this heterogeneity, the average rCBV values in glioblastoma multiforme were not significantly higher than white matter values, presumably because of averaging of tumor and necrotic regions. Also, since the tumor rCBV values are typically between white and gray matter values, the specificity of rCBV in identifying tumor is limited near the cortex and other regions that have normal rCBV values above white matter. The MR spectroscopic data do not suffer from this limitation, because the differences in metabolite levels between normal and tumor voxels are much larger than the differences between the metabolite levels in normal gray and white matter. As a result of the better specificity of MR spectroscopy over rCBV in these cases, the extent of abnormality that was predicted by proton spectroscopy was sometimes larger than that suggested by rCBV maps. On the other hand, the interpretation of the spectra from regions with heterogeneous morphology was sometimes difficult. In such cases, it was not possible to determine whether voxels with decreased NAA levels but with Cho levels less than or equal to normal corresponded to gliosis or to partial voluming of tumor and necrosis. In these circumstances, the higher resolution of the rCBV maps allows the identification of pockets of tumor (hypervascularity) and necrosis (hypovascularity) within the 1-cm3 voxel region.
Conclusion
The current study suggests that a combination of rCBV and MR spectroscopy may be important in increasing the ability to noninvasively differentiate tumor from necrosis, post-treatment effects, or edema in patients with treated gliomas, and may therefore be useful for evaluating response to therapy. Values of rCBV in regions with metabolic profiles characteristic of tumor were typically above those found in normal-appearing white matter but lower than or equal to those in gray matter. This implies that the blood volume data should be interpreted carefully in context of the anatomy. In regions near the cortex, where the rCBV data were ambiguous, the spectral data were able to provide more definitive results.
fig 7.
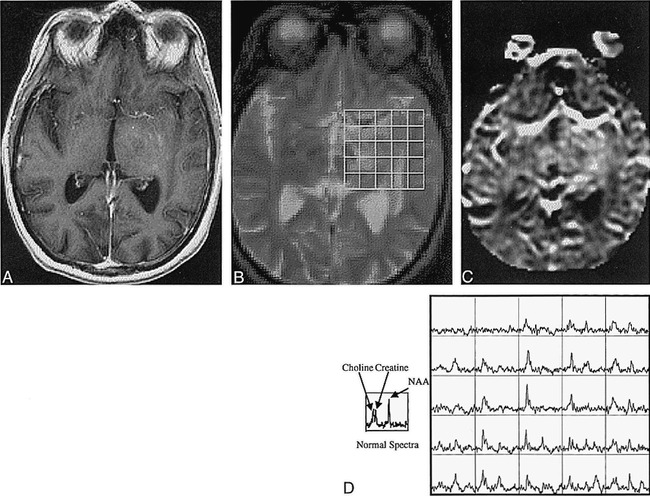
A–D, T1-weighted (32/8/1) (A) and T2-weighted (2500/30/1) (B) images resampled to the resolution of the rCBV map (C) and corresponding spectra (D) of a patient with an oligoastrocytoma. Spectra with elevated Cho and decreased NAA coincide with the abnormality on the T2-weighted image. The abnormal regions on the conventional T1- and T2-weighted images were interpreted to be areas of possible tumor, post-treatment changes, and/or edema, whereas the rCBV map was elevated relative to normal white matter and the spectra showed a tumor pattern. Therefore, conventional MR imaging was not specific for the presence of tumor, whereas both the rCBV map and the proton spectra indicated tumor. Note also the difficulty of assessing increased microvascularity near the middle cerebral artery on the rCBV map. This case is typical for low-grade tumors and unusual for most treated higher-grade tumors, because there are regions of hyperintensity on the rCBV map in nonenhancing regions
Acknowledgments
Thanks to Evelyn Proctor and Niles Bruce for excellent technical support.
Footnotes
Supported by grants K01 CA76998, R01 CA59880, and R01 CA59897 from the National Institutes of Health/National Cancer Institute, and by grant EDT34 from the American Cancer Society.
Presented in part at the annual meetings of the American Society of Neuroradiology, Toronto, 1997, and the International Society of Magnetic Resonance in Medicine, Toronto, 1997.
Address reprint requests to Roland G. Henry, PhD, Magnetic Resonance Science Center, 1 Irving St, Box 1290, UCSF, San Francisco, CA 94143.
References
- 1.Aronen HJ, Cohen MS, Belliveau JW, Fordham JA, Rosen BR. Ultrafast imaging of brain tumors. Top Magn Reson Imaging 1993;5:14-24 [PubMed] [Google Scholar]
- 2.Rosen BR, Belliveau JW, Chien D. Perfusion imaging by nuclear magnetic resonance. Magn Reson Q 1989;5:263-281 [PubMed] [Google Scholar]
- 3.Maeda M, Itoh S, Kimura H, et al. Tumor vascularity in the brain: evaluation with dynamic susceptibility-contrast MR imaging. Radiology 1993;189:233-238 [DOI] [PubMed] [Google Scholar]
- 4.Guckel F, Brix G, Rempp K, Deimling M, Rother J, Georgi M. Assessment of cerebral blood volume with dynamic susceptibility contrast enhanced gradient-echo imaging. J Comput Assist Tomogr 1994;18:344-351 [DOI] [PubMed] [Google Scholar]
- 5.Aronen HJ, Gazit IE, Louis DN, et al. Cerebral blood volume maps of gliomas: comparison with tumor grade and histologic findings. Radiology 1994;191:41-51 [DOI] [PubMed] [Google Scholar]
- 6.Wenz F, Rempp K, Hess T, et al. Effect of radiation on blood volume in low-grade astrocytomas and normal brain tissue: quantification with dynamic susceptibility contrast MR imaging. AJR Am J Roentgenol 1996;166:187-193 [DOI] [PubMed] [Google Scholar]
- 7.Pardo FS, Aronen HJ, Kennedy D, et al. Functional cerebral imaging in the evaluation and radiotherapeutic treatment planning of patients with malignant glioma. Int J Radiat Oncol Biol Phys 1994;30:663-669 [DOI] [PubMed] [Google Scholar]
- 8.Chang L, McBride D, Miller BL, et al. Localized in vivo 1H magnetic resonance spectroscopy and in vitro analyses of heterogeneous brain tumors. J Neuroimaging 1995;5:157-163 [DOI] [PubMed] [Google Scholar]
- 9.McBride DQ, Miller BL, Nikas DL, et al. Analysis of brain tumors using 1H magnetic resonance spectroscopy. Surg Neurol 1995;44:137-144 [DOI] [PubMed] [Google Scholar]
- 10.Shimizu H, Kumabe T, Tominaga T, et al. Non-invasive evaluation of malignancy of brain tumors with proton MR spectroscopy. AJNR Am J Neuroradiol 1996;17:737-747 [PMC free article] [PubMed] [Google Scholar]
- 11.Go KG, Keuter EJW, Kamman RL, et al. Contribution of magnetic resonance spectroscopic imaging and L-[1–11C]tyrosine positron emission tomography to localization of cerebral gliomas for biopsy. Neurosurgery 1994;34:994-1002 [DOI] [PubMed] [Google Scholar]
- 12.Heesters MAAM, Kamman RL, Mooyaart EL, Go KG. Localized proton spectroscopy of inoperable brain tumors: response to radiation therapy. J Neurooncol 1993;17:27-35 [DOI] [PubMed] [Google Scholar]
- 13.Fulham MJ, Bizzi A, Dietz MJ, et al. Mapping of brain tumor metabolites with proton MR spectroscopic imaging: clinical relevance. Radiology 1992;185:675-686 [DOI] [PubMed] [Google Scholar]
- 14.Nelson SJ, Nalbandian AB, Proctor E, et al. Registration of images form sequential MR studies of the brain. J Magn Reson Imaging 1994;4:877-883 [DOI] [PubMed] [Google Scholar]
- 15.Wald LL, Nelson SJ, Day MR, et al. Serial proton magnetic resonance spectroscopy imaging of glioblastoma multiforme after brachytherapy. J Neurosurg 1997;87:525-534 [DOI] [PubMed] [Google Scholar]
- 16.Gill SS, Thomas DGT, Van Bruggen N, et al. Proton MR spectroscopy of intracranial tumors: in vivo and in vitro studies. J Comput Assist Tomogr 1990;14:497-504 [DOI] [PubMed] [Google Scholar]
- 17.Villringer A, Rosen BR, Belliveau JW, et al. Dynamic imaging with lanthanide chelates in normal brain: contrast due to magnetic susceptibility effects. Magn Reson Med 1988;6:164. [DOI] [PubMed] [Google Scholar]
- 18.Fisel CR, Ackerman JL, Buxton RB, et al. MR contrast due to microscopically heterogeneous magnetic susceptibility: numerical simulations and applications to cerebral physiology. Magn Reson Med 1991;17:336-347 [DOI] [PubMed] [Google Scholar]
- 19.Edelman RR, Mattle HP, Atkinson DJ, et al. Cerebral blood flow: assessment with dynamic contrast-enhanced T2*-weighted MR imaging at 1.5 T. Radiology 1990;176:211-220 [DOI] [PubMed] [Google Scholar]
- 20.Belliveau JW, Rosen BR, Kantor HL, et al. Functional cerebral imaging by susceptibility-contrast NMR. Magn Reson Med 1990;14:538-546 [DOI] [PubMed] [Google Scholar]
- 21.Rempp KA, Brix G, Wenz F, Becker C, Guckel F, Lorenz W. Quantification of regional cerebral blood flow and volume with dynamic susceptibility contrast-enhanced MR imaging. Radiology 1994;193:637-641 [DOI] [PubMed] [Google Scholar]
- 22.Boxerman JL, Hamberg LM, Rosen BR, Weisskoff RM. MR contrast due to intravascular magnetic susceptibility perturbations. Magn Reson Med 1995;34:555-566 [DOI] [PubMed] [Google Scholar]
- 23.Kennan RP, Zhong J, Gore JC. Intravascular susceptibility contrast mechanisms in tissues. Magn Reson Med 1994;31:9-21 [DOI] [PubMed] [Google Scholar]
- 24.Larson KB, Perman WH, Perlmutter JS, Gado MH, Ollinger JM, Zierler K. Tracer-kinetic analysis for measuring regional cerebral blood flow by dynamic nuclear magnetic resonance imaging. J Theor Biol 1994;170:1-14 [DOI] [PubMed] [Google Scholar]
- 25.Perman WH, Mokhtar HG, Larson KB, Perlmutter JS. Simultaneous MR acquisition of arterial and brain signal-time curves. Magn Reson Med 1992;28:74-83 [DOI] [PubMed] [Google Scholar]
- 26.Donahue KM, Weisskoff RM, Chesler DA, et al. Improving MR quantification of regional blood volume with intravascular T1 contrast agents: accuracy, precision, and water exchange. Magn Reson Med 1996;36:858-867 [DOI] [PubMed] [Google Scholar]
- 27.Press WH, Flannery BP, Teukolsky SA, Vetterling WT. Numerical Recipes in C. Cambridge: Cambridge University Press; 1988
- 28.Janus TJ, Kim EE, Tilbury R, Bruner JM, Yung WKA. Use of [18F]fluorodeoxyglucose positron emission tomography in patients with primary malignant brain tumors. Ann Neurol 1993;33:540-548 [DOI] [PubMed] [Google Scholar]
- 29.Di Chiro G, DeLaPlaz RL, Brooks RA, et al. Glucose utilization of cerebral gliomas measured by F-18-fluorodeoxyglucose and positron emission tomography. Neurology 1982;32:1323-1329 [DOI] [PubMed] [Google Scholar]
- 30.DeLaPlaz RL, Patronas NJ, Brooks RA, et al. Positron emission tomography study of gray-matter glucose utilization by brain tumors. AJNR Am J Neuroradiol 1983;4:826-829 [PMC free article] [PubMed] [Google Scholar]
- 31.Di Chiro G. Positron emission tomography using F-18-fluorodeoxyglucose in brain tumors: a powerful diagnostic and prognostic tool. Invest Radiol 1983;22:360-371 [DOI] [PubMed] [Google Scholar]


