Abstract
BACKGROUND AND PURPOSE: A CT scanner employing a digital flat-panel detector is capable of very high spatial resolution as compared with a multi-section CT (MSCT) scanner. Our purpose was to determine how well a prototypical volume CT (VCT) scanner with a flat-panel detector system defines fine structures in temporal bone.
METHODS: Four partially manipulated temporal-bone specimens were imaged by use of a prototypical cone-beam VCT scanner with a flat-panel detector system at an isometric resolution of 150 μm at the isocenter. These specimens were also depicted by state-of-the-art multisection CT (MSCT). Forty-two structures imaged by both scanners were qualitatively assessed and rated, and scores assigned to VCT findings were compared with those of MSCT.
RESULTS: Qualitative assessment of anatomic structures, lesions, cochlear implants, and middle-ear hearing aids indicated that image quality was significantly better with VCT (P < .001). Structures near the spatial-resolution limit of MSCT (e.g., bony covering of the tympanic segment of the facial canal, the incudo-stapedial joint, the proximal vestibular aqueduct, the interscalar septum, and the modiolus) had higher contrast and less partial-volume effect with VCT.
CONCLUSION: The flat-panel prototype provides better definition of fine osseous structures of temporal bone than that of currently available MSCT scanners. This study provides impetus for further research in increasing spatial resolution beyond that offered by the current state-of-the-art scanners.
CT is an important diagnostic tool in temporal-bone imaging (1). Recent changes in the design of multisection CT (MSCT) scanners, such as addition of more and thinner sections to the detector subsystem combined with a change from parallel-beam to cone-beam reconstruction, have decreased scanning time and concomitantly increased spatial resolution. The current generation of scanners offers a resolution of approximately 0.5 × 0.5 mm in-plane and 0.5 to 1.0 mm in the direction of the z-axis (2). Despite all of these advances, numerous small and important anatomic structures in the temporal bone are still below this resolution limit; these structures are either blurred owing to partial-volume effect or not seen at all (1, 3). For example, assessment of otosclerosis, luxation of ossicles, the integrity of the round and oval window niche, malformations of the middle and inner ear, and many other diseases is often not possible by imaging alone. In addition, accurate postsurgical assessment of middle- and inner-ear implants is limited because of metal artifacts. For treatment and surgical planning, accurate and repeatable visualization of these structures and the associated disease would be highly beneficial (4). Herein we present a new CT scanner design, realized as an experimental scanner only suitable for ex vivo specimens at this time, which can potentially overcome these difficulties. The main advantages of this design are volumetric coverage, higher spatial resolution, and isotropic voxel imaging.
A key attribute of this prototypical volumetric CT (VCT) scanner is the use of a digital flat-panel detector. These detectors, when compared with MSCT detectors, offer much smaller detector element size by fabricating them on an amorphous silicon wafer by using photolithographic techniques (2, 5, 6). This results in higher spatial resolution. Unfortunately, the flat-panel detector elements also have a lower dynamic range. This, coupled with the fact that a smaller detector element receives proportionately lower X-ray photon flux, results in inferior contrast resolution. Therefore, a flat-panel detector design favors spatial resolution over soft-tissue contrast (2). Because temporal-bone imaging is often critically dependent on spatial resolution (1) rather than soft-tissue contrast, we hypothesized that such a scanner design could produce images of these structures superior to those rendered by the current state-of-the-art technique.
Methods
To test our hypothesis, we scanned four temporal-bone specimens by using a modern MSCT scanner, the reference standard, and a prototypical VCT scanner that employs a flat-panel detector. One of the specimens was unaltered, whereas the other three were manipulated by installing implants or simulating disease.
Dissected Temporal Bones
Four temporal bones were dissected from skulls of normal-hearing, elderly, male patients (average age, 64 years) who died from causes unrelated to ear or skull-base disease. Auricles were removed and dissected.
The first temporal bone (specimen 1) was scanned to obtain the unaltered anatomy. Subsequently, a tympanoscopy was performed, which revealed a high jugular bulb with dehiscence, a common anatomic variant.
In the second temporal bone (specimen 2), two differently sized, laser-drilled lesions were introduced in the ossicular chain. The smaller lesion (0.3 mm wide) was placed in the neck of the malleus. The bigger lesion (0.9 mm wide) was drilled in the distal end of the long process of incus.
The third temporal bone (specimen 3) was fitted with a cochlear implant (Nucleus, Cochlear Corp, Sydney, Australia). Modified Stenvers X-ray projection imaging was used to ascertain that the implant was in the correct position.
In the fourth temporal bone (specimen 4), a middle-ear hearing aid was implanted by means of tympanoscopy. The hearing aid was a floating mass transducer (FMT; Vibrant Soundbridge, Symphonix Devices Inc., San Jose, CA). The FMT mechanically stimulates the ossicles. The oscillations generated by a small swinging coil with an iron core are transmitted over a clamp to the long process of incus; the coil is free floating in the middle ear. The FMT was attached to the long process of incus near the lenticular process (7).
MSCT Protocol
A special plastic fixture was designed and built to hold the temporal bones in the MSCT scanner (Lightspeed QX/I; GE Medical System, Milwaukee, WI). Previous experiments have shown that the fixture did not significantly affect image quality. Specimens were scanned by using a reduced-dose clinical protocol: 140 kV, 80 mA, collimation of 1.25 mm, pitch of 3, and total exposure time of 7.8 seconds (8). The reconstruction was performed with a 180° LI bone algorithm to yield 1.25-mm-thick sections, separated by 0.3-mm spacing. Each section consisted of a 512 × 512 image matrix over a 9.6-cm field of view. The small field of view was chosen to minimize the effect of reconstruction voxel size on the spatial resolution.
VCT System Description and Protocol
For VCT, each specimen was placed on a rotating platform between the X-ray source and detector (Fig 1). The projections were acquired at 120 kV and 120 mA and with a 15.5-cm field of view. These parameters were empirically derived to optimize image quality. The X-ray source was derived from a tungsten anode Performix 630 X-ray tube (GE Medical Systems, Milwaukee, WI) with a user-selectable focal spot size of 1.1 mm or 0.7 mm. The detection subsystem consisted of a flat-panel detector fabricated with a matrix of photodiodes on an amorphous silicon wafer. Each photodiode is joined to a layer of CsI scintillator for conversion of X-ray photons into light photons. This 20 × 20 cm2 fluoroscopic X-ray imager has an isotropic detection element size of 200 μ (1024 × 1024 pixels). During examination, specimens were rotated 360° on a computer-controlled stage. A total of 900 cone-beam projections were acquired at 30-second intervals with a source-to-detector distance of 110 cm and source-to-object distance of 85 cm.
Fig 1.
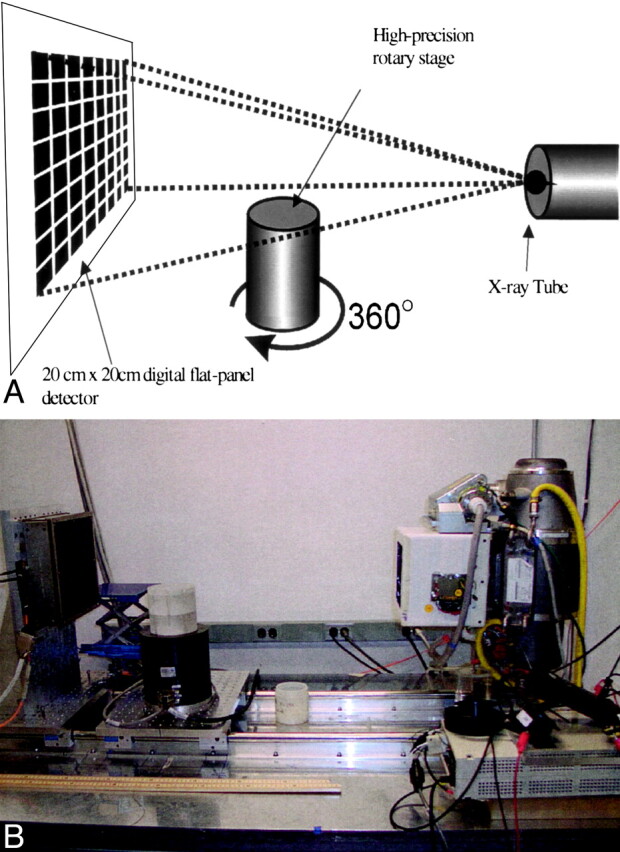
Schematic diagram (top) and photograph of the bench-top VCT system (bottom). Specimens were rotated 360° on the rotary stage as the digital flat-panel detector acquired 900 X-ray projection images.
From projection data, a volume was reconstructed by using a modified Feldkamp, Davis & Kress algorithm (9). A volumetric stack of about 450 images, each with 1024 × 1024 pixels, was generated. The volume calculation took 18 minutes on 18 dedicated 1-GHz Pentium III processors in a Beowulf Linux cluster (Aspen Systems, Inc., Wheat Ridge, CO).
Data Analysis
Postprocessing of datasets was performed with the Advantage Windows Workstation 4.0 (GE Medical Systems, Milwaukee, WI) and consisted of reformatting oblique planes through the CT stack, segmentation, and volume rendering. For 3D imaging of the segmented ossicular chain from specimen 1, a volume-rendering algorithm with a linear-ascending opacity from −750 H (0% opacity) to -500 H (30% opacity) was used (10).
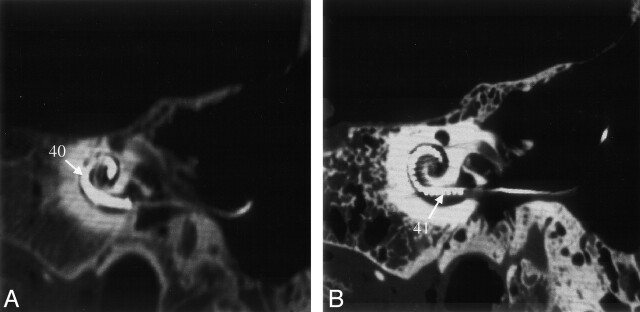
Axial and oblique reformatted sections from VCT and MSCT, including the Poschls and Stenvers planes, were compared. Three readers (H.B., R.G., H.C.) independently performed qualitative assessment and comparison of various anatomic structures, the two laser-drilled lesions, the electrodes of the cochlear implant, and the middle-ear hearing aid (Table). A three-point scale was used: clearly defined structures were scored 2, those that were detectable but not clearly defined were scored 1, and those that were not visible at all were scored 0. The summed score of these qualitative assessments for 42 structures (Table) in each specimen was calculated.
Anatomic Structures, Lesions, and Implants Used for Comparison
| Temporal Bone Structure | Summed Scores |
||
|---|---|---|---|
| MSCT | VCT | Maximum | |
| 1 Tympanic membrane | 10 | 24 | 24 |
| 2 Handle of malleus | 24 | 24 | 24 |
| 3 Head of malleus | 24 | 24 | 24 |
| 4 Bone marrow of malleus | 0 | 21 | 24 |
| 5 Anterior process of malleus | 7 | 19 | 24 |
| 6 Incudomalleolar joint | 11 | 21 | 24 |
| 7 Body of incus | 24 | 24 | 24 |
| 8 Bone marrow of incus | 0 | 19 | 24 |
| 9 Long process of incus | 24 | 24 | 24 |
| 10 Short process of incus | 24 | 24 | 24 |
| 11 Lenticular process of incus | 8 | 21 | 24 |
| 12 Incudo-stapedial joint | 0 | 19 | 24 |
| 13 Head of stapes | 9 | 24 | 24 |
| 14 Anterior crus of stapes | 12 | 24 | 24 |
| 15 Posterior crus of stapes | 8 | 18 | 24 |
| 16 Footplate of stapes | 12 | 24 | 24 |
| 17 Annular ligament | 0 | 0 | 24 |
| 18 Tendon of tensor tympani | 6 | 18 | 24 |
| 19 Stapedius muscle | 4 | 18 | 24 |
| 20 Anterior ligament of malleus | 6 | 15 | 24 |
| 21 Superior ligament of malleus | 9 | 11 | 24 |
| 22 Posterior ligament of incus | 10 | 12 | 24 |
| 23 Bony labyrinth of cochlea | 21 | 24 | 24 |
| 24 Interscalar septum of cochlea | 0 | 21 | 24 |
| 25 Modiolus of cochlea | 12 | 24 | 24 |
| 26 Vestibular aqueduct | 8 | 24 | 24 |
| 27 Cochlear aqueduct | 6 | 24 | 24 |
| 28 Facial nerve | 0 | 24 | 24 |
| 29 Geniculate ganglion | 2 | 23 | 24 |
| 30 Bony facial nerve canal | 20 | 24 | 24 |
| 31 Facial nerve in IAC | 5 | 24 | 24 |
| 32 Greater petrosal nerve | 5 | 24 | 24 |
| 33 Chorda tympani nerve | 3 | 6 | 24 |
| 34 Vestibulocochlear nerve | 9 | 24 | 24 |
| 35 Superior vestibular nerve | 0 | 24 | 24 |
| 36 Inferior vestibular nerve | 0 | 24 | 24 |
| 37 Cochlear nerve | 0 | 24 | 24 |
| 38 Smaller lesion in neck of malleus | 2 | 6 | 6 |
| 39 Bigger lesion in long process of incus | 6 | 6 | 6 |
| 40 Cochlea implant (overall) | 3 | 6 | 6 |
| 41 Electrodes of cochlea implant | 1 | 5 | 6 |
| 42 Clamp of middle ear hearing aid | 1 | 6 | 6 |
Of the 42 structures that were rated, 37 were discernible in all four specimens. The two laser-drilled lesions and implants (cochlear implant and its individual electrodes and the middle-ear FMT) were visible in only one specimen each. Therefore, the maximal summed score possible in our analysis was 918. This total includes a score of 888 from the 37 structures that were present in all four specimens evaluated by the three observers that could be assigned a maximal rating of two (37 × 4 × 3 × 2 = 888 points). In addition, five structures that were present in only one specimen contributed a score of 30 (5 × 3 × 2). Statistical analysis was performed by using the two-sided t test with the aid of SPSS statistical software (University of Chicago, Chicago, IL).
Results
Overall Image Quality
The summed score indicating the quality of structure visualization was 336 for MSCT as compared with 795 for VCT. The maximal score possible was 918. The assessment of anatomic structures was significantly higher with VCT (P < .001). No structures depicted by MSCT were rated better than those shown by VCT. MSCT and VCT findings in five structures (handle of malleus, head of malleus, body of incus, and the long and short processes of incus) were rated at the maximal score.
In most cases, observer ratings matched or varied by one point. The level of difference did not reach statistical significance. A descriptive comparison of selected structures follows.
Ossicular Chain
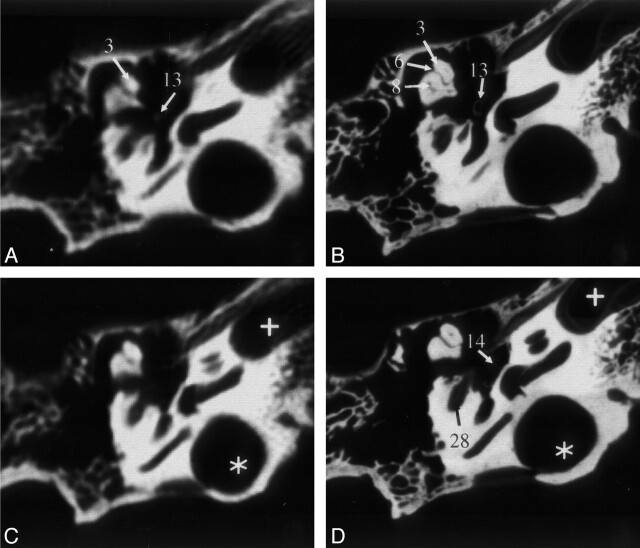
All macroscopically defined parts of the ossicular chain were clearly delineated by VCT. The most significant difference between MSCT and VCT findings was in the visualization of stapes. The assessment of the superstructure of stapes was difficult and unreliable by using MSCT. In comparison, VCT clearly showed the head, neck, both crura, and the footplate with sufficient contrast (Fig 2).
Fig 2.
Sections of the middle and inner ear (specimen 1) acquired by MSCT (A and C) and VCT (B and D). VCT data were reformatted to visually align the cut plane with the corresponding MSCT section. Owing to variable section thicknesses, perfect alignment was not possible. In the VCT dataset, more anatomic structures are visible and better delineated. Star indicates high jugular bulb; cross, carotid canal. See Table for numbered annotations.
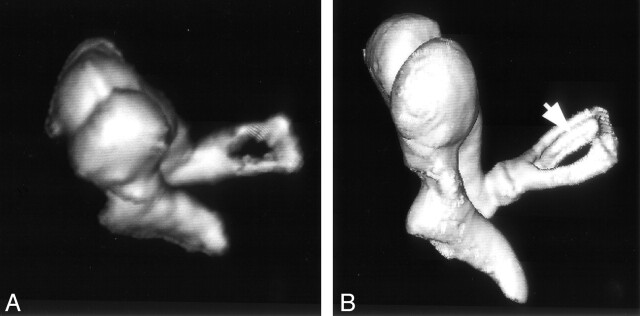
Even small anatomic details of the ossicular chain could be appreciated on the VCT scans. For example, the inner surface of the posterior crus of stapes contains a small indentation or groove that runs along its length. This groove is not demonstrated by MSCT (Fig 3A) owing to partial-volume effect. As can be seen in Figure 3B, VCT clearly demonstrates this anatomic detail.
Fig 3.
Volume-rendered image of the ossicular chain obtained from specimen 1 by MSCT (A) and VCT (B). The ossicular chain is shown from an anterior viewpoint. A thin, longitudinal groove along the length of the posterior crus of stapes (arrow) is delineated by VCT but not MSCT. To visualize the gap in stapes, A had to be acquired from a steeper angle than that of B because of the higher section thickness employed by MSCT.
Inner Ear
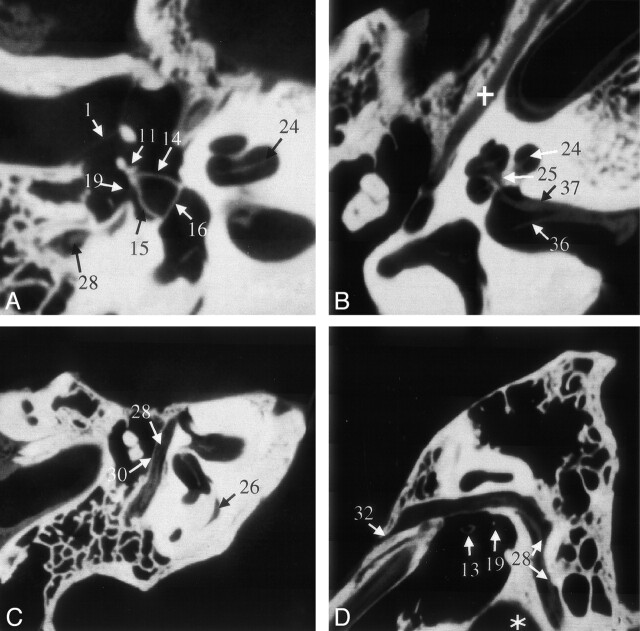
On VCT scans, not only the bony labyrinth of the inner ear could be visualized, but some of the internal anatomy of the cochlea could be discerned. For example, we could easily see the osseous spiral lamina of the cochlea on the VCT scans throughout the 2.5 turns of the cochlea (Fig 4A and B). This feature was not visible on MSCT scans. Furthermore, the thin bony covering of the superior semicircular canal, separating it from the middle cranial fossa, could be discerned as well.
Fig 4.
VCT reformations of specimen 1. A shows a reformation in the plane of the anterior and posterior crus of stapes and its footplate. B was acquired in a plane through the cochlea and IAC that clearly shows the modiolus; it also shows the bifurcation of cranial nerve VIII due to the air in the dissected specimen. The facial nerve and its canal are shown in the more horizontal section shown in C and more sagittal section shown in D. Part of the proximal vestibular aqueduct (26), a structure that can be traced throughout its length on these scans, is seen in C. Star indicates high jugular bulb; cross, tensor tympani muscle. See Table for numbered annotations.
Both the vestibular (Fig 4C) and the cochlear aqueduct could be followed throughout their length on VCT scans. On the MSCT scans, visualization of the oblique course of the vestibular aqueduct was somewhat difficult.
Facial Nerve
On VCT scans, the facial nerve could be directly imaged over its entire course (Fig 4C and D), and its branches could be individually discerned. We were able to distinguish the facial nerve from the vestibulocochlear nerve in the internal acoustic meatus (IAC) and follow it out of the IAC. In the tympanic segment of the facial nerve, the thin bony separation between the nerve and the tympanic cavity could be clearly seen on VCT scans (Fig 4C and D). With MSCT, it was not possible to see the nerve itself, although the facial canal was visualized.
Branching of the vestibulocochlear nerve in the IAC into vestibular and cochlear nerves could be identified (Fig 4B). Further branching of the vestibular nerve into its superior, inferior, and posterior divisions was also appreciated just before the insertion of these branches into the vestibule.
The cochlear nerve could be followed through the modiolus (Fig 4B). The MSCT scans did not allow such distinction between the two cranial nerves or their terminal branches.
Ossicular Chain Lesions and Implants
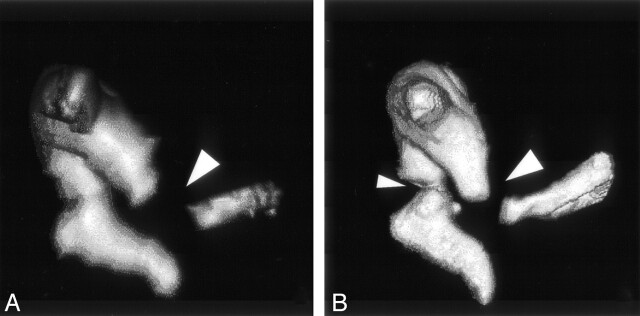
Of the two laser-induced lesions in the ossicular chain, only the bigger one could be diagnosed as a full gap in the ossicular chain on the basis of MSCT findings. The smaller lesion was not seen. In contrast, both lesions were seen by using VCT and could be clearly identified as gaps in the ossicular chain (Fig 5).
Fig 5.
Volume-rendered images of the ossicular chain obtained from specimen 2: MSCT (A) and VCT (B) datasets. The bigger lesion (large arrowheads) is seen on both scans, whereas the smaller lesion (small arrowhead) is appreciated on only the VCT scan. The lesion in the neck of malleus resulted in slight subluxation of the handle of malleus.
Metal artifacts, which routinely compromise visualization of implants on CT scans, were present on both VCT and MSCT scans. However, their extent and distribution were markedly different depending on imaging technique. Using MSCT, it was not possible to ascertain the relative position of the implant and the boundaries of the cochlea. Using VCT, individual electrodes of the cochlear implant were discernable (Fig 6).
Fig 6.
Reformations of MSCT (A) and VCT (B) datasets obtained from specimen 3 showing the cochlear implant. On the VCT image, contamination from the metal artifacts is considerably less than that on the MSCT image; the cochlea and individual electrodes of the implant can be clearly assessed. See Table for numbered annotations.
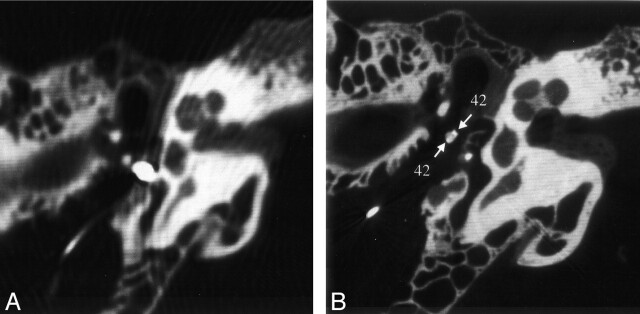
Metal artifacts also complicated the scanning of the middle-ear hearing aid. However, in contrast to the MSCT findings, the VCT depiction of the ossicular chain was not strongly affected by these artifacts. The quality of the data was good enough to reveal fixation of the clamp of the FMT on the long process of incus (Fig 7).
Fig 7.
Reformations of MSCT (A) and VCT (B) datasets obtained from specimen 4 showing the fixation of the middle-ear FMT hearing aid on the long process of incus. Metal artifacts of the iron coil render an assessment of adjacent structures impossible on the MSCT image. On the VCT image, the artifacts are reduced to clearly show the handles of the clamp around the long process of incus (arrows). See Table for numbered annotations.
Discussion
The main advantages of VCT over MSCT are its higher spatial resolution, isometric voxel size, and reduced metal- and beam-hardening artifacts. The theoretical voxel size of VCT at the isocenter is about 150 × 150 × 150 μm3. MSCT, by comparison, offered approximately 500 × 500 μm2 in-plane resolution and 500–1000 μm along the z-axis. This 74-fold difference in spatial resolution was immediately obvious when comparing the definition of various structures (Fig 2). Various object boundaries, which in MSCT are compromised by partial-volume effect, were much better delineated. Smaller and thinner anatomic structures were distinguishable with VCT. The effect is most visible when one browses through the sections along the z-axis where the difference in the resolution between MSCT and VCT findings is most pronounced. Owing to the isometric nature of VCT data, image quality was essentially unchanged regardless of the cut plane in the data stack. In contrast to the MSCT data, we could arbitrarily reformat the VCT data in any oblique plane while maintaining the same image quality.
In contrast to in vivo clinical CT (1) examinations, the nerves in the IAC are visible on our ex vivo MSCT scans (Fig 4B). The process of dissecting the temporal bone replaced CSF with air, thereby affording better contrast for visualization of nerves. While the visualization of the nerves during their course through the IAC is affected by the presence of air, the same is not true of the facial nerve and its branches in the middle ear where they were imaged directly. We believe that the superior visualization of nerves by using VCT is as much a merit of the higher spatial resolution as it is of the ex vivo presentation of the sample. Further experiments are needed to delineate these two effects.
The lower soft-tissue contrast offered by VCT did not significantly affect the imaging of temporal bone for two reasons. First, the temporal bone houses many high-contrast-resolution structures such as the various bony canals, the ossicular chain, and the bony labyrinth. Second, the higher spatial resolution of VCT can substitute for lower contrast resolution in structures such as the facial nerve. The facial nerve is a soft-tissue structure that is housed in a bony canal but separated from bone by a thin layer of soft tissue of different attenuation. With MSCT, an average attenuation value for the content of the facial nerve canal is obtained. In contrast, voxels used with VCT are small enough to image the small layer of soft tissue that separates nerve from bone, making it feasible to visualize the nerve separate from the bone. Nevertheless, it is conceivable that evaluation of inflammation, soft-tissue tumors, and disease affecting nonosseous structures in the temporal bone would be compromised by using VCT; this aspect is not fully explored by our current experiments.
With MSCT, the X-ray dose decreases as one increases the number of sections. This is because of the penumbra effect: a small amount of photon flux is wasted in the overlap between helical runs of the X-ray beam. The amount of over-beaming per section decreases with increasing number of sections. One can consider VCT as an extreme example of MSCT with 1024 sections instead of eight or 16. This minimizes the penumbra effect to less than 150 μ for the entire volumetric stack. This dose reduction is offset by lack of a detector-side collimation grid. Further work is needed to compare doses used for VCT versus MSCT to investigate optimal scanning parameters and image-quality tradeoffs.
Different mA and kV settings were used between the two system acquisitions, because optimal mA and kV settings depend on many factors, such as X-ray tube, detector quantum efficiency (DQE), collimation, and field of view. These parameters are different for MSCT and VCT. For example, helical pitch is not applicable to VCT, because all sections are acquired in one rotation. Also, the DQE of the two types of detector systems are very different. In the current experiment, we used different settings for MSCT and VCT. The parameter setting that delivered highest scan quality was used for each system.
In this study, we examined a small number of specimens, and three readers analyzed the data. This necessitated use of a summed score for comparison of structures. A disadvantage of this method is that it is an aggregate measure: no statistically significant assertion can be made about the quality of any single structure. In addition, the results of this comparison depend on the structures chosen. One can confound the results of the study by selecting structures that favor VCT over MSCT, or vice versa. Nevertheless, the large number of structures that were compared, and the uniformity of the outcome for such a large array of structures, increases our confidence in the final conclusion.
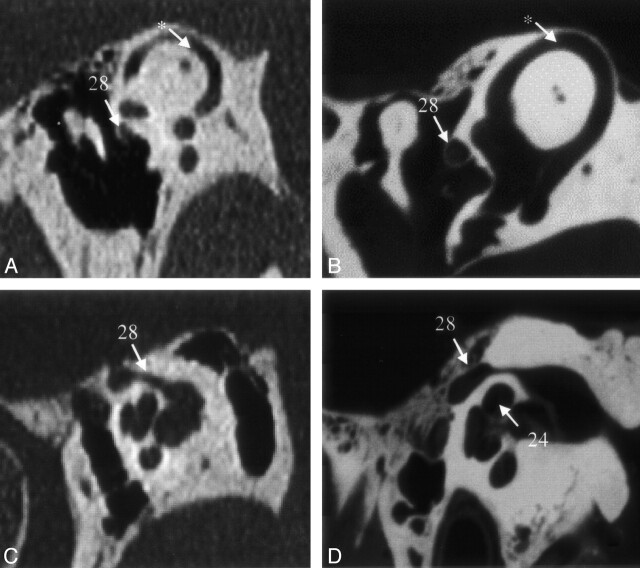
It should be noted that the MSCT examination, which used the routine clinical protocol, is not optimized for the ex vivo specimen, and scan quality was potentially suboptimal. Because of anisometric voxels inherent to the MSCT technique, the appearance of structures depends on scan plane; it is conceivable that MSCT scans can be slightly improved by a different presentation of the sample. Despite these limitations, the scan quality of VCT is significantly superior to that offered by MSCT. It is unlikely that even the optimized MSCT scans of the temporal bone (1) would provide scan quality comparable to that of VCT (Fig 8).
Fig 8.
MSCT scans (A and C) obtained in a patient undergoing routine temporal-bone CT are shown for the purpose of comparison with VCT scans (B and D) of specimen 1. These scans pertain to two different temporal bones that are roughly along the same reformation plane. A and B were acquired at a plane through the superior semicircular canal (*). The VCT scan (B) clearly shows the bony covering of the superior semicircular canal and the canal of the facial nerve. Any dehiscence in these structures would be much more appreciated on the VCT scans. C and D were acquired at the Poschl plane; C was obtained with a conventional radiographic technique suitable for study of the anterior wall of the cochlea, modiolus, and the facial nerve canal; the anatomy is depicted with much greater detail on D. See Table for numbered annotations.
Conclusion
Image quality of VCT in temporal-bone imaging is superior to that of MSCT. The high spatial resolution of VCT could lead to novel applications once a system is available for clinical use. For example, detailed imaging of the oval window niche, together with the incudo-stapedial joint (Figs 3 and 4A and D), could reveal the extent of otosclerosis (11) or other diseases affecting the functional integrity of the ossicular chain. Direct imaging of the facial nerve would provide higher safety in otosurgical planning, especially in malformations (12, 13). A dehiscence of the superior semicircular channel (Fig 8) or of the tympanic segment of the facial-nerve canal could be more reliably detected (Figs 4C and D and 8). Further, imaging of the superstructure of the cochlea would lead to new decision criteria for successful cochlear implantation (14) and detection of malformations (Fig 4C and D). VCT also has the potential to replace projective X-ray methods, such as Stenvers, in the postoperative evaluation of cochlear implants (15). Other potential applications are too numerous to enumerate.
Acknowledgments
The authors would like to thank Dr. P. Edic and J. McLeod for helping us with VCT scan acquisition; Dr. B. DeMan for discussions about the metal artifacts; Prof. Dr. B. P. Weber, for preparing the specimen; and Dr. T. Rodt, for 3D imaging of the ossicular chain.
Footnotes
Presented at the 38th annual meeting of the American Society of Neuroradiology, May 11–17, 2002; Vancouver, B.C.
References
- 1.Chakeres DW, Augustyn MA. Temporal Bone Imaging. In: Som PM, Curtin HD, (eds). Head and Neck Imaging, 4th ed. Mosby, St. Louis, MO.2003;1093–1108
- 2.Kalender WA. The use of flat-panel detector CT for imaging. Radiologe 2003;43:379–387 [DOI] [PubMed] [Google Scholar]
- 3.Chakeres DW. Clinical significance of partial volume averaging of the temporal bone. AJNR Am J Neuroradiol 1984;5:297–302 [PMC free article] [PubMed] [Google Scholar]
- 4.Ali QM, Ulrich C, Becker H. Three-dimensional CT of the middle ear and adjacent structures. Neuroradiology 1993;35:238–241 [DOI] [PubMed] [Google Scholar]
- 5.Jaffray DA, Siewerdsen JH. Cone-beam computed tomography with a flat-panel imager: initial performance characterization. Med Phys 2000;27:1311–1323 [DOI] [PubMed] [Google Scholar]
- 6.Stevens GM, Saunders R, Pelc NJ. Alignment of a volumetric tomography system. Med Phys 2001;28:1472–1481 [DOI] [PubMed] [Google Scholar]
- 7.Lenarz T, Weber BP, Issing PR, et al. Vibrant sound bridge system, a new kind hearing prosthesis for patients with sensorineural hearing loss: part II, audiological results. Laryngorhinootologie 2001;80:370–380 [DOI] [PubMed] [Google Scholar]
- 8.Husstedt HW, Prokop M, Dietrich B, Becker H. Low-dose high-resolution CT of the petrous bone. J Neuroradiol 2000;27:87–92 [PubMed] [Google Scholar]
- 9.Feldkamp LA, Davis LC, Kress JW. Practical cone-beam algorithm. J Opt Soc Am 1984;1:612–619 [Google Scholar]
- 10.Rodt T, Bartling S, Schmidt AM, Weber BP, Lenarz T, Becker H. Virtual endoscopy of the middle ear: experimental and clinical results of a standardised approach using multi-slice helical computed tomography. Eur Radiol 2002;12:1684–1692 [DOI] [PubMed] [Google Scholar]
- 11.Swartz JD, Mandell DW, Wolfson RJ, et al. Fenestral and cochlear otosclerosis: computed tomographic evaluation. Am J Otol 1985;6:476–481 [PubMed] [Google Scholar]
- 12.Atilla S, Akpek S, Uslu S, Ilgit ET, Isik S. Computed tomographic evaluation of surgically significant vascular variations related with the temporal bone. Eur J Radiol 1995;20:52–56 [DOI] [PubMed] [Google Scholar]
- 13.Fuse T, Tada Y, Aoyagi M, Sugai Y. CT detection of facial canal dehiscence and semicircular canal fistula: comparison with surgical findings. J Comput Assist Tomogr 1996;20:221–224 [DOI] [PubMed] [Google Scholar]
- 14.Woolford TJ, Roberts GR, Hartley C, Ramsden RT. Etiology of hearing loss and cochlear computed tomography: findings in preimplant assessment [Suppl]. Ann Otol Rhinol Laryngol 1995;166:201–206 [PubMed] [Google Scholar]
- 15.Shpizner BA, Holliday RA, Roland JT, Cohen NL, Waltzman SB, Shapiro WH. Postoperative imaging of the multichannel cochlear implant. AJNR Am J Neuroradiol 1995;16:1517–1524 [PMC free article] [PubMed] [Google Scholar]


