

Abstract
Summary: Diffusion tensor imaging with 1.8-mm isotropic resolution was performed to delineate structures of the brain stem. High-resolution single-shot imaging was achieved by the combination of a high-field magnet (3T) and the SENSitivity Encoding (or SENSE) parallel imaging technique. Various structures in the brain stem, such as the inferior olivary nuclei, deep cerebellar nuclei, some cranial nerves, and white matter tracts were identified, which have been difficult to appreciate by conventional MR techniques.
The brain stem, including the midbrain, pons, and medulla, concentrates structures of vital importance in a relatively small area. Remarkable anatomic elements include cranial nuclei, ascending and descending tracts, and reticular formation. Several nuclei involved in autonomic control—such as those responsible for respiratory function, cardiovascular regulation, sleep, and alertness—are included. At the level of the brain stem, the emergence of cranial nerves is also seen holding sensitive, motor, or autonomic information traffic from the target organs to and from respective nuclei.
There are two difficulties in studying brain stem anatomy by using MR imaging. The first is that many important structures are small yet present complex anatomy. Therefore, high spatial resolution is desirable. The second difficulty is that the various anatomic units do not exhibit enough contrast to enable their discrete identification. In this case, no matter how high the resolution, conspicuity of the structure cannot be achieved. When relaxation-based MR image contrast is used, many internal structures of the brain stem cannot be clearly delineated.
Diffusion-weighted (DW) imaging is a technique based on measurement of Brownian motion of water molecules in 3D space (1). When diffusion occurs uniformly in all directions, it is called isotropic. By contrast, when preference of water motion for one orientation is present, diffusion is called anisotropic. In the brain, water molecule displacement is made preferentially parallel rather than perpendicular to the axonal fibers, and therefore, white matter presents with higher anisotropy than that of gray matter. Diffusion tensor (DT) imaging uses a tensor model to characterize diffusion anisotropy, which allows detection of both orientation information and quantification of the referred anisotropy and related parameters (1–3). The mathematical representation of water diffusion also provides data for 3D fiber tracking (tractography) based on anisotropy (4–6). Tractography allows noninvasive in vivo evaluation of neuronal tracts and the appealing possibility of revealing neural association networks.
One of the unique aspects of DT imaging is that the amount of anatomic information and its imaging resolution have a linear relationship. This is partially due to the heterogeneity of many brain regions in terms of structural orientation yet homogeneity regarding their chemical composition, the latter leading to failure of relaxation-based contrast to provide anatomic detail. Conventional MR imaging can provide high contrast between gray and white matter because of its high sensitivity to myelin content. In the brain stem, however, gray matter and white matter are not easily differentiated.
The increased signal-to-noise ratio (SNR) provided by 3-T imaging can be used to achieve faster acquisition times or increase spatial resolution. A disadvantage of high field strength is increased susceptibility artifacts leading to image distortions, especially in the brain stem region, because of the close proximity to bony structures of the skull base. DT acquisition with the SENSitivity Encoding (SENSE) technique (7, 8) has been shown to reduce susceptibility artifacts and distortions. In this report, we combine high-field-strength DT imaging and SENSE to acquire high-spatial-resolution anatomic images of brain stem tracts.
Methods and Materials
Eight healthy subjects (mean age, 31.9 years; range, 23.8–45.9 years) underwent 3-T high-spatial-resolution brain stem imaging with SENSE acquisition. The protocol considered to be the most appropriate was performed in three healthy subjects (one woman and two men; 27.4–38 years of age) by use of the following parameters: single-shot echo planar (SS-EP) imaging; TR/TE, 5000/97 ms; field of view [FOV], 202 mm; isotropic resolution, 1.8 mm; 33 axial sections (1.8 mm thickness) parallel to the anterior comissure–posterior comissure (AC–PC) line aiming at the brain stem region. The imaging matrix was 112 × 109, which was zero-filled to 256 × 256. A maximum b value of 700 s/mm2 in 30 gradient directions (9) along with at least five DW images were acquired. The SENSE technique was used with a reduction factor (R) of 3.0 (7). For acquisition, an eight-element arrayed radio-frequency coil, converted to six channels to be compatible with the six-channel receiver, was used. Imaging time for each sequence was 3 minutes 30 seconds. Eight repetitions were performed to increase SNR.
Three-dimensional magnetization-prepared rapid acquisition gradient echo (3D-MPRAGE) images were obtained with the same section localization, number, and thickness as those of the DT images; TR/TE/flip angle, 14.69 ms/9.4 ms/8°; FOV, 202 mm; imaging time, 2 minutes 7 seconds; R, 2.
DT postprocessing was performed by using DtiMap with generation of fractional anisotropy (FA) and color-coded maps (10, 11). The color-coding assumes that the eigenvector associated with the largest eigenvalue represents the average main fiber orientation of a particular pixel. Colors were assigned as blue representing superior-inferior (SI) orientation; green, anteroposterior (AP); and red, laterolateral (LL). Tracts with oblique angles are represented by a mixture of colors. For instance, if a tract runs 45° between the rostral-caudal (blue) and anteroposterior (green) orientations, it appears as cyan (blue + green). For the 3D reconstruction, gray matter nuclei and cranial nerves were manually defined on a section-by-section basis. A group of white matter tracts that was previously identified (4), and another that was newly assigned in this report (medial and dorsal longitudinal fasciculi) were reconstructed by using fiber assignment by continuous tracking (FACT; 4, 12) and two region-of-interest approaches (13). Criteria used for the tract reconstruction, such as anisotropy threshold, anatomic landmarks and region-of-interest drawing, were the same as in our previous report (13). For the medial and dorsal longitudinal fasciculi, the tract was identified at the level of pons and medulla, where it can be discretely recognized and the trajectory between them was reconstructed by FACT.
Informed consent was obtained for each subject, and the protocol was approved by the institutional review board.
Results
A list of anatomic structures could be consistently identified among the subjects with the 1.8-mm isotropic DT images (Figs 1 and 2; Table) and are described below. Different compartments at the rostral spinal cord and caudal medulla level, corresponding to the ventral, lateral, and dorsolateral funiculi anteriorly, and the dorsal funiculus posteriorly, were identified as a discrete SI-oriented group of fibers (Fig 1 [panel I]). Assigned gray matter structures, dark-colored because of their low FA value content, included the ventral (b) (Fig 1 [panel I] ) and dorsal (c) (Fig 1 [panel I]) gray matter nuclei cranial to the ventral and dorsal horns of the spinal cord, a compartment that included the cuneate, gracile, and trigeminal nuclei (h) (Fig 1 [panels II and III]), the deep cerebellar nuclei (o) (Fig 1 [panel V])—in which area the dentate nucleus should account for the largest nucleus—and the substantia nigra (w) (Fig 2 [panel III]). The inferior olivary nucleus (g) (Fig 1 [panels II–IV]) was seen to have heterogeneous colors in this higher-resolution technique. The medial lemniscus, central tegmental tract (m) (Fig 1 [panel V]; Fig 2 [panel I]) and medial and dorsal longitudinal fasciculi (n) (Fig 1 [panel V]; Fig 2 [panels I and II]) could be appreciated more conspicuously at 3 T as two distinct compartments instead of only one, as it was seen in our previous reports in which a 1.5-T magnet was used (13). Cranial nerves V (trigeminal) (p) (Fig 2 [panel I]) and III (oculomotor) (t) (Fig 2 [panel II]) and optic tract (y) (Fig 2 [panel III]) were identified. On the same section of the trigeminal nerve, a consistently dark structure (q) (Fig 2 [panel I]) could be seen in all individuals, deeply located lateral to the medial lemniscus, central tegment and medial longitudinal fasciculus, apparently connected to the correspondent nerve, which was assigned to the trigeminal nuclei. Of note, in Figure 1 (panels I and II), asterisks mark a cyan blue structure that we tentatively assign to the pyramids running along an oblique (SI/AP) trajectory to reach the decussation and the lateral corticospinal tract.
Fig 1.
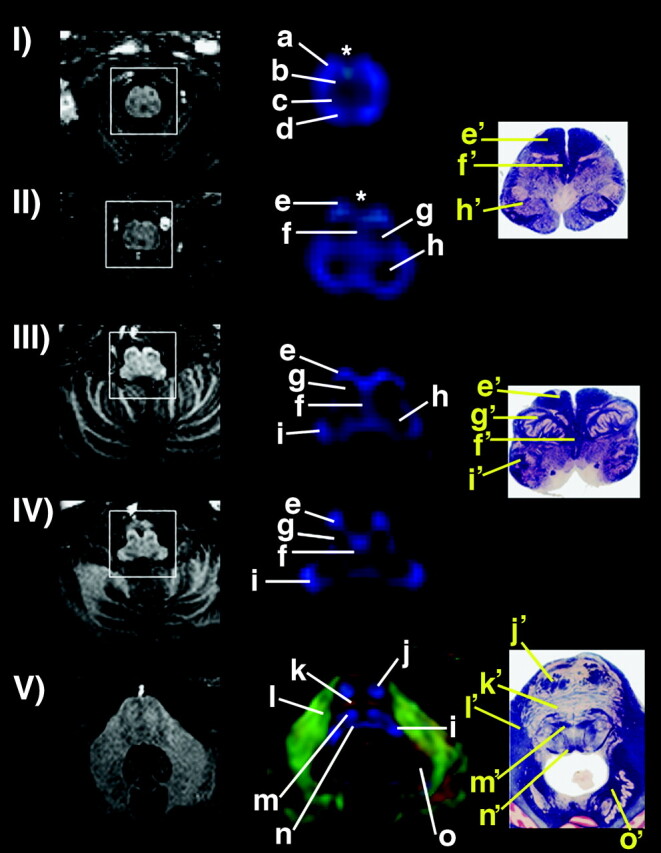
Left, sections of the MPRAGE sequence showing anatomic images at various levels of spinal cord, medulla, and caudal pons (I–V). Center, corresponding color-coded maps (magnified for detail in the center); right, corresponding anatomic sections. For the color-coded maps, blue shows SI orientation; green, AP; and red, LL. Asterisks show midline cyan blue structures in I and II, claimed as part of the pyramidal decussation. Assignment of anatomic structures is listed in the Table. Anatomic sections from Nolte (30). Used with permission.
Fig 2.
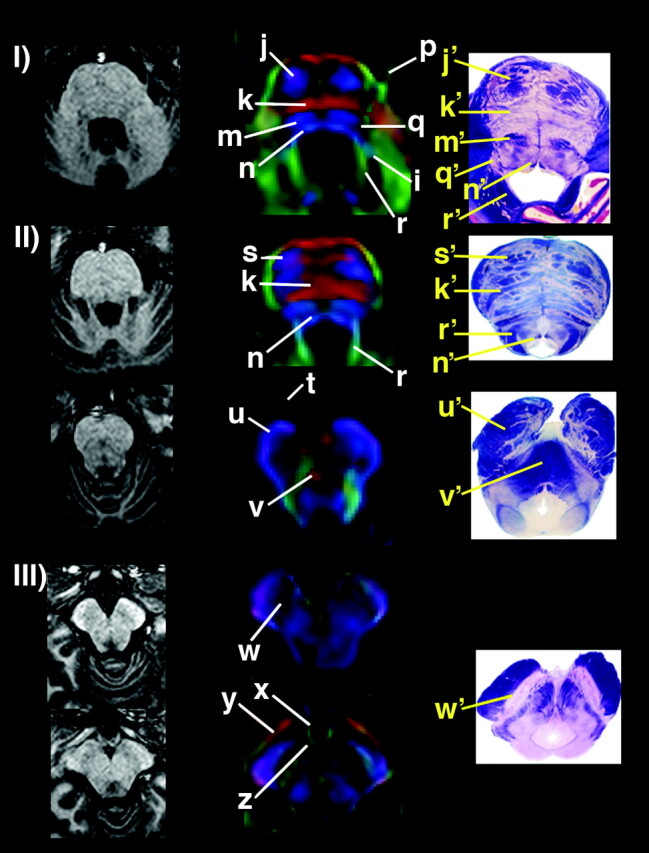
Left, sections of the MPRAGE sequence showing anatomic images at pons and mesencephalon (I–III). Center, corresponding color-coded maps (magnified for detail in the center). Right, corresponding anatomic sections. Color-coded maps present with same orientation as above. Assignment of anatomic structures is listed in the Table.
Assignment of anatomic structures with their location and fiber orientation
| Section Level | Anatomic Structure | Orientation | |
|---|---|---|---|
| a | Rostral spinal cord/caudal medulla | Ventral, lateral & dorsolateral funiculi | SI |
| b | Rostral spinal cord/caudal medulla | Ventral gray matter nuclei | Low FA |
| c | Rostral spinal cord/caudal medulla | Dorsal gray matter nuclei | Low FA |
| d | Rostral spinal cord/caudal medulla | Dorsal funiculus | SI |
| e | Rostral spinal cord/caudal medulla | Pyramid | SI/oblique |
| f | Medulla | Medial lemniscus | SI |
| g | Medulla | Inferior olivary nucleus | Low FA |
| h | Medulla | Cuneate, gracile & trigeminal nuclei | Low FA |
| i | Medulla | Inferior cerebellar peduncle | SI |
| j | Pons | Corticospinal tract | SI |
| k | Pons | Transverse pontine fibers | LL |
| l | Pons | Medial cerebellar peduncle | AP |
| m | Pons | Medial lemniscus & central tegmental tract | SI |
| n | Pons | Medial & dorsal longitudinal fasciculi | SI |
| o | Pons | Deep cerebellar nuclei | Low FA |
| p | Pons | Cranial nerve V (trigeminal) | AP |
| q | Pons | Trigeminal nuclei | Low FA |
| r | Pons | Superior cerebellar peduncle | AP |
| s | Pons | Corticospinal & corticopontine tracts | SI |
| t | Midbrain | Cranial nerve III (oculomotor) | AP |
| u | Midbrain | Cerebral peduncle | SI |
| v | Midbrain | Decussation of superior cerebellar peduncles | LL |
| w | Midbrain | Substancia nigra | Low FA |
| x | Midbrain | Tuberal hypothalamus | AP |
| y | Midbrain | Optic tract | AP/oblique |
| z | Midbrain | Mammillary body | Low FA |
Figure 3 shows 3D reconstruction of some white matter tracts, gray matter nuclei, and cranial nerves of interest. By using this approach, the 3D relationship between the medial and dorsal longitudinal fasciculus compartment—posteriorly located in relation to the corticospinal tract (CST) and medial lemniscus (ML) and anterior to the fourth ventricle—was compared with histologic findings and correctly assigned as such. The CST runs anteriorly; the ML has a course right posterior to the CST at the medulla oblongata level, running far posteriorly as it reaches the pons level. For more illustrative anatomic localization, deep cerebellar nuclei and the anterior and posterior horns of the spinal cord are shown.
Fig 3.

3D reconstruction of cranial nerves (blue, II, optic tracts; light blue, III, oculomotor; and green, V, trigeminal), projectional tracts (red, corticospinal tract; purple, medial lemniscus; and blue, medial and dorsal longitudinal fasciculi), and gray matter (pink, deep cerebellar nuclei; yellow, olivary nuclei; and brown, anterior and posterior horns of the spinal cord), allowing visualization of relationship among the assigned structures.
Discussion
DW images are highly sensitive to subject motion, and even brain pulsation causes severe phase shifts in the acquired signal intensity (14, 15). Single-shot imaging, in principle, is insensitive to the phase shift that often causes severe artifacts in any types of segmented k-space acquisition (eg, nonsingle-shot echo planar imaging [non-SS-EP] imaging). As a result, most of DT studies are based on SS-EP sequences. The resolution achieved by SS-EP imaging is inherently limited by the sample T2 and T2*, precluding high-spatial-resolution imaging. To achieve high-spatial-resolution DT imaging, there are two available approaches. One is segmented k-space imaging with a phase correction scheme (16–21), and the other is use of the SS-EP technique with parallel imaging (8). The former approach does not have any limitations in terms of spatial resolution, but complete removal of motion-related phase errors may be difficult, especially as the resolution increases. The latter approach is very robust against phase errors (8) but presents limitations regarding enhancement of resolution. In this study, we have adopted the latter approach and increased resolution was achieved by increasing SNR through reduction of TE, which was possible because of reduction of the length of the echo train by a factor of 3.0 in the SENSE scheme.
SENSE at 3 T allows performance of high-resolution imaging within a reasonable acquisition time. The drawback of the 3-T imaging is the larger amount of image distortions due to B0 field inhomogeneity. Although this problem was partially overcome by the SENSE technique, the amount of distortion is noticeably larger than that of 1.5-T imaging. The protocol based on 3-T imaging used in this study may not be suitable for studies that involve precise volumetry. This problem should be ameliorated in the future when parallel imaging with a higher order of reduction becomes available.
The results indicate that the high-resolution DT image obtained at 3 T with SENSE allowed identification of different compartments of the spinal cord, optic tract, cranial nerves III and V, inferior olivary nuclei, and dentate nuclei, in addition to providing more details of overall structures. Compared with our previous brain stem studies conducted at 1.5 T (14), the present study identified a higher number of structures, including some of the cranial nerves, provided higher resolution for the medial and dorsal longitudinal fasciculi, and spinal cord compartments, and even increased conspicuity of some of the nuclei, which would not be expected to benefit from such a white matter–dedicated technique.
Once anatomic structures of interest are identified, their quantitative MR parameters can be investigated, such as FA, apparent diffusion coefficient, or T2 by using coregistered MR imaging (13, 22). The high resolution provided by this method could yield detection of small lesions in the brain and disclose their relationship to adjacent structures, namely, white matter tracts, some gray matter nuclei, and some cranial nerves. Classic clinical scenarios that particularly involve the brain stem, as the ones with dorsal funiculus lesions, such as neurosyphilis (23), vitamin B12 deficiency (24), and Friedreich ataxia (25), might potentially benefit from this tool for both diagnosis and follow-up. The same can be expected for the anterior gray horn in amyotrophic lateral sclerosis (26), spinal muscular atrophy (27), and poliomyelitis (23), and for the olivary nucleus and deep cerebellar nuclei in autism (28). Involvement or invasion of some of the cranial nerves by tumors, such as schwannomas, meningiomas, pituitary tumors, craniopharingiomas, and optic gliomas, could potentially be studied in further detail.
Conclusion
High-spatial-resolution DT imaging at high field strength enables visualization and analysis of a higher number of structures, which is expected to be of importance for clinical application.
Acknowledgments
We would like to acknowledge Terri Brawner, Kathleen Kahl and Joe Gillen for technical support.
Footnotes
Supported by Grants P41RR15241 and R21EB000991.
References
- 1.Le Bihan D, Breton E, Lallemand D, et al. MR imaging of intravoxel incoherent motions: application to diffusion and perfusion in neurologic disorders. Radiology 1986;161:401–407 [DOI] [PubMed] [Google Scholar]
- 2.Mori S, Barker PB. Diffusion magnetic resonance imaging: its principle and applications. Anat Rec 1999;257:102–109 [DOI] [PubMed] [Google Scholar]
- 3.van Gelderen P, de Vleeschouwer MHM, DesPres D, et al. Water diffusion and acute stroke. Magn Reson Med 1994;31:154–163 [DOI] [PubMed] [Google Scholar]
- 4.Mori S, Crain BJ, Chacko VP, van Zijl PCM. Three-dimensional tracking of axonal projections in the brain by magnetic resonance imaging. Ann Neurol 1999;45:265–269 [DOI] [PubMed] [Google Scholar]
- 5.Bammer R, Acar B, Moseley ME. In vivo MR tractography using diffusion imaging. Eur J Radiol 2003;45:223–234 [DOI] [PubMed] [Google Scholar]
- 6.Conturo TE, Lori NF, Cull TS, et al. Tracking neuronal fiber pathways in the living human brain. Proc Natl Acad Sci U S A 1999;96:10422–10427 [DOI] [PMC free article] [PubMed] [Google Scholar]
- 7.Pruessmann KP, Weiger M, Scheidegger MB, Boesiger P. SENSE: sensitivity encoding for fast MRI. Magn Reson Med 1999;42:952–962 [PubMed] [Google Scholar]
- 8.Bammer R, Auer M, Keeling SL, et al. Diffusion tensor imaging using single-shot SENSE-EPI. Magn Reson Med 2002;48:128–136 [DOI] [PubMed] [Google Scholar]
- 9.Jones DK, Horsfield MA, Simmons A. Optimal strategies for measuring diffusion in anisotropic systems by magnetic resonance imaging. Magn Reson Med 1999;42:515–525 [PubMed] [Google Scholar]
- 10.Pierpaoli C, Basser PJ. Toward a quantitative assessment of diffusion anisotropy. Magn Reson Med 1996;36:893–906 [DOI] [PubMed] [Google Scholar]
- 11.Pajevic S, Pierpaoli C. Color schemes to represent the orientation of anisotropic tissues from diffusion tensor data: application to white matter fiber tract mapping in the human brain. Magn Reson Med 1999;42:526–540 [PubMed] [Google Scholar]
- 12.Xue R, van Zijl PC, Crain BJ, et al. In vivo three-dimensional reconstruction of rat brain axonal projections by diffusion tensor imaging. Magn Reson Med 1999;42:1123–1127 [DOI] [PubMed] [Google Scholar]
- 13.Stieltjes B, Kaufmann WE, van Zijl PCM, et al. Diffusion tensor imaging and axonal tracking in the human brainstem. Neuroimage 2001;14:723–735 [DOI] [PubMed] [Google Scholar]
- 14.Jiang H, Golay X, van Zijl PC, Mori S. Origin and minimization of residual motion-related artifacts in navigator-corrected segmented diffusion-weighted EPI of the human brain. Magn Reson Med 2002;47:818–822 [DOI] [PubMed] [Google Scholar]
- 15.Golay X, Jiang H, van Zijl PC, Mori S. High-resolution isotropic 3D diffusion tensor imaging of the human brain. Magn Reson Med 2002;47:837–843 [DOI] [PubMed] [Google Scholar]
- 16.Ordidge RJ, Helpern JA, Qing ZX, et al. Correction of motional artifacts in diffusion-weighted NMR images using navigator echoes. Magn Reson Imaging 1994;12:455–460 [DOI] [PubMed] [Google Scholar]
- 17.Norris DG, Börnert P, Reese T, Leibfritz D. On the application of ultra-fast RARE experiments. Magn Reson Med 1992;27:142–164 [DOI] [PubMed] [Google Scholar]
- 18.Butts K, de Crespigny A, Pauly JM, Moseley M. Diffusion-weighted interleaved echo-planar imaging with a pair of orthogonal navigator echoes. Magn Reson Med 1996;35:763–770 [DOI] [PubMed] [Google Scholar]
- 19.Anderson AW, Gore JC. Analysis and correction of motion artifacts in diffusion weighted imaging. Magn Reson Med 1994;32:379–387 [DOI] [PubMed] [Google Scholar]
- 20.Mori S, van Zijl PCM. A motion correction scheme by twin-echo navigation for diffusion weighted magnetic resonance imaging with multiple RF echo acquisition. Magn Reson Med 1998;40:511–516 [DOI] [PubMed] [Google Scholar]
- 21.Pipe JG, Farthing VG, Forbes KP. Multishot diffusion-weighted FSE using PROPELLER MRI. Magn Reson Med 2002;47:42–52 [DOI] [PubMed] [Google Scholar]
- 22.Mori S, Kaufmann WE, Davatzikos C, et al. Imaging cortical association tracts in the human brain using diffusion-tensor-based axonal tracking. Magn Reson Med 2002;47:215–223 [DOI] [PubMed] [Google Scholar]
- 23.Berger JR, Sabet A. Infectious myelopathies. Semin Neurol 2002;22:133–142 [DOI] [PubMed] [Google Scholar]
- 24.Bassi SS, Bulundwe KK, Greeff GP, et al. MRI of the spinal cord in myelopathy complicating vitamin B12 deficiency: two additional cases and a review of the literature. Neuroradiology 1999;41:271–274 [DOI] [PubMed] [Google Scholar]
- 25.Hou JG, Jankovic J. Movement disorders in Friedreich’s ataxia. J Neurol Sci 2003;206:59–64 [DOI] [PubMed] [Google Scholar]
- 26.McGeer PL, McGeer EG. Inflammatory processes in amyotrophic lateral sclerosis. Muscle Nerve 2002;26:459–470 [DOI] [PubMed] [Google Scholar]
- 27.Ozsarlak O, Schepens E, Parizel PM, et al. Hereditary neuromuscular diseases. Eur J Radiol 2001;40:184–197 [DOI] [PubMed] [Google Scholar]
- 28.Bauman M, Kemper TL. Histoanatomic observations of the brain in early infantile autism. Neurology 1985;35:866–874 [DOI] [PubMed] [Google Scholar]
- 29.Nolte J. The Human Brain. 5th edition. St Louis: Mosby Year Book;2003. .