

Abstract
BACKGROUND AND PURPOSE: Atrophy in the medial temporal lobe (MTL) structures depicted with brain imaging is one of the most accurate markers of Alzheimer disease (AD), but practical considerations have thus far limited their routine clinical use. The aim of this study was to explore the validity of a CT- and MR-based measure of MTL atrophy that would be feasible for routine clinical use.
METHODS: We acquired brain CT scans in the temporal lobe plane with thin sections in 42 patients with AD and in 29 control patients without dementia. We also acquired MR images (according to a 3D magnetization-prepared rapid gradient-echo protocol) in 28 patients with AD and in 28 control subjects without dementia. The radial width of the temporal horn (rWTH) of the lateral ventricle was measured with a precision caliper at the tip of the horn on CT scans or high-quality MR images. The validity of the rWTH variable was assessed by test-retest and interrater reliability, convergent and discriminant validity compared with progressively distant brain regions, and known-group validity (accuracy of the separation of patients with AD from control subjects). Convergent and discriminant validity compared with volumetric measures was tested in the patients who underwent MR imaging.
RESULTS: Intraclass correlation coefficients for inter- and intrarater reliability were between 0.94 and 0.98. On CT scans, Pearson’s correlation of the rWTH with the transverse width of the temporal horn was between 0.60 and 0.79; with Jobst’s minimum thickness of the MTL, between 0.63 and 0.78 (interuncal distance ∼0.50); and with an index of frontal atrophy, between 0.35 and 0.42. On MR images, the correlation with volumetric MR measures was 0.80 in the temporal horn, 0.74 in the hippocampus, 0.68 in the temporal lobe, 0.58 in the entorhinal cortex, and 0.49 in the frontal lobe. On CT scans (cutoff value for AD, >5.3 mm; age range of subjects, 50–90 y), the rWTH measure was a sensitive marker for AD in 39 of 42 patients with AD (sensitivity, 93%) and was a specific marker in 28 of the 29 control patients (specificity, 97%). On MR images (cutoff 3.6–6.7 mm; age range of subject, 50–90 y), the rWTH was a sensitive marker for AD in 21 of 28 patients with AD (sensitivity, 75%) and was a specific marker in 26 of 28 control subjects (specificity, 93%). The accuracy of other linear CT-based measures of MTL atrophy and linear and volumetric MR-based measures was lower. With specificity set to 95%, sensitivity ranged from 57% to 74% for CT-based measures and from 52% to 74% for MR-based measures.
CONCLUSION: The rWTH is an accurate marker of AD that could be used in routine clinical settings.
Alzheimer disease (AD), the most common form of dementia among the elderly, affects approximately 5% of the population over age 65 years. Despite increasingly significant knowledge about the pathophysiologic properties of AD, its diagnosis continues to rely largely on clinical judgment. Several biologic markers have been proposed to enhance diagnostic accuracy of AD (1), although none are currently able to provide diagnostic certainty. Improving diagnostic accuracy is becoming more important because of the widespread availability and expense of cholinesterase inhibitors, an effective treatment for AD.
Among the currently proposed markers for AD, imaging measures of regional atrophy appear most promising. MR measures of atrophy of medial temporal lobe (MTL) structures, such as in the hippocampus and the entorhinal cortex, have been shown to discriminate patients with AD from control subjects (2–4). Current methods, however, have considerable limitations. First, MR volumetric measurements must be performed by an experienced operator. Second, reference standards for normative volumetric measurements need to be established in each laboratory. Third, in some countries, the availability and cost of MR imaging limit its use such that CT often is the diagnostic method used routinely to evaluate patients for cognitive disturbances. For these reasons, a reliable CT marker of AD might be of considerable clinical utility.
Several investigators have tried to use CT measures to help in the diagnosis of AD (5). Various indices have been developed with different sensitivities and specificities. These indices are of two general types: 1) indicators of global or lobar atrophy, such as lateral ventricle size, third ventricle size, and bifrontal index; and 2) measures of atrophy within the MTL, such as the interuncal distance, the temporal horn size, and choroidal fissure size. Measures of MTL atrophy can better differentiate patients with AD from those without AD (5).
The minimum thickness of the MTL (mtMTL) is the most widely recognized linear CT measure (6). Jobst and colleagues (6) found that this measure of atrophy in the parahippocampal gyrus region separated patients with pathologically confirmed AD from control subjects without dementia with a sensitivity of 92% and a specificity of 95%. The technical requirements for this measure are simple, except that orientation of the CT scan must be −20° from the orbitomeatal line and the section thickness must be minimal (2 mm, for example). Jobst et al (7) later showed that the progression of MTL atrophy, thus measured, was a sensitive marker of cognitive deterioration in subjects with normal cognition at baseline. Similar findings have been reported by George and colleagues (8) and de Leon and colleagues (9) with ratings of enlargement of the choroidal-hippocampal fissure. Despite these promising initial results, neither CT nor MR measures have gained acceptance as aids to the clinical diagnosis of AD.
Multiple publications have reported enlargement of the temporal horns of the lateral ventricles in AD (10–15). Some of these authors have further suggested that it might be an accurate marker of the disease (14, 15). When measures of the temporal horn have been taken together with hippocampal measures (11, 12), the temporal horn measures have had greater accuracy in the differentiation of patients with mild and moderate AD from control subjects. More recently, Jack and colleagues (15) found that in patients with mild AD temporal horn enlargement over time correlates with disease progression nearly as much as hippocampal shrinkage. Recognizing that hippocampal atrophy may be an early anatomic change in AD and that the temporal horn of the lateral ventricle can be measured easily on CT scans, we believe temporal horn size to be a potential candidate marker.
The aim of the present study was to develop, with a CT dataset, a reliable accurate measure of temporal horn enlargement: the radial width of the temporal horn (rWTH). We sought to demonstrate how this measure might be helpful in the routine diagnosis of AD. Moreover, because this measure might also be obtained by use of MR imaging, which has even simpler technical requirements, we also tested the applicability of the rWTH measure on an MR dataset.
Methods
The study was reviewed and approved by the local ethics committee. Written informed consent was obtained from patients and control subjects or their primary caregivers after discussion of the risks and benefits of participation. No compensation was provided.
Patients
Patients were enrolled as part of an ongoing, prospective study of the natural history of AD and other dementias (The Mild Alzheimer Project). Clinical evaluation and CT scanning were performed in consecutive patients admitted to the inpatient ward or day hospital of the Alzheimer Unit of IRCCS S. Giovanni di Dio in 1997 (16). Enrollment was limited to patients with mild dementia, as denoted by a Mini-Mental State Examination (MMSE) score ≥18 (17, 18) and included patients with possible or probable AD.
The diagnosis of AD was made according to common research criteria (19) after a standardized clinical, instrumental, and neuropsychologic evaluation (12, 16). The clinical evaluation of each patient included ascertainment of personal and family history as well as physical, neurologic, and neuropsychologic examinations. A history of physical disease was confirmed by chart review, results of laboratory evaluations, and physical findings. History of ischemic heart disease, cancer, and cerebrovascular risk factors (hypertension and diabetes) were carefully evaluated for each patient. Global dementia severity was assessed with the Clinical Dementia Rating (CDR) scale (20).
Serum chemistries were routinely obtained, including thyroid function, serum vitamin B12 and folate levels, and a VDRL syphilis test, as well as electrocardiography, EEG, chest X-ray, and apolipoprotein E (ApoE) genotyping by polymerase chain reaction amplification and HhaI digestion (22).
CT scanning was performed within 1 week of admission. The diagnosis of AD was made without knowledge of the atrophy measures, although it did rely on both the radiologist’s report and visual inspection by the clinicians in charge (G.B.F., A.B., C.G., G.B., O.Z.) to exclude possible comorbid conditions, such as stroke or brain neoplasm. Atrophy and the presence of cerebrovascular disease were quantitatively rated after the diagnostic process was complete. Cerebral vascular disease was assessed by recording the presence of large-vessel infarction, lacunar infarction, and leukoaraiosis on CT scans. Severity of leukoaraiosis was determined by a standardized visual rating scale with three severity levels (22, 23): periventricular hypoattenuation confined to the frontal or occipital horns (score = 1), surrounding the lateral ventricles (score = 2), or extending to the cortex (score = 3). Frontotemporal, parietal, and occipital regions of each hemisphere were rated separately, resulting in scores ranging from 0 to 18.
A trained psychologist performed neuropsychologic assessment with a standard protocol, which included measures of attention (attentional matrices), frontal function and abstract thinking (Wisconsin card-sorting test and Raven’s progressive matrices), immediate memory (digit span, Corsi span), verbal and nonverbal learning (logical memory test, recall of Rey-Osterreith figure, unknown face recognition test), language production and comprehension (controlled oral word-association test, Boston naming test, token test), visuospatial constructional ability (copy of Rey-Osterreith figure), limb apraxia (De Renzi’s test), and buccofacial apraxia (De Renzi’s test; battery modified from Binetti et al) (24).
Consecutively enrolled patients with possible (n = 14) or probable (n = 28) AD who had undergone CT scanning with appropriate acquisition parameters were selected for the present study. Twenty-five patients (nine with possible AD, 16 with probable AD) enrolled into The Mild Alzheimer Project were excluded, because CT was acquired at the wrong orientation (usually at the orbitomeatal line). When compared with the 42 patients included in the present study (Table 1), those excluded were of similar age (range, 76 ± 8 years), sex distribution (women, 69%), educational status (range, 5.9 ± 3.1 years), and cognitive performance (MMSE, 20.8 ± 2.8; P > .30 for all comparisons).
TABLE 1:
Baseline characteristics of the CT study group
| Baseline Characteristics | Control Group (n = 29) | AD Group (n = 42) | P value* |
|---|---|---|---|
| Sociodemographics and anthropometrics | |||
| Mean age at observation ± SD (y) | 69 ± 9 | 76 ± 8 | .0007 |
| (range) | (51–82) | (57–90) | |
| Women | 19 (65%) | 33 (75%) | NS |
| Mean education ± SD (y) | 9.4 ± 4.9 | 6.0 ± 3.3 | .001 |
| (range) | (2–18) | (2–17) | |
| Mean head size on axial plane ± SD, cm2 | 136 ± 12 | 138 ± 12 | NS |
| (range) | (115–164) | (117–166) | |
| Dementia-related variables | |||
| MMSE score† | 27.0 ± 0.9 | 21.1 ± 2.3 | <.0001 |
| (range) | (23.4–27.4) | (18–27) | |
| CDR of 0/.5/1/2 or 3 | 29/0/0/0 | 0/18/24/0 | <.0001 |
| Mean disease duration ± SD (mo) | — | 37 ± 20 | |
| (range) | — | (9–96) | |
| ApoE ε4 allele‡ | 8/56 (14%) | 32/82 (39%) | .003 |
| Lacunes | 9 (33%) | 7 (17%) | NS |
| Mean leukoaraiosis score ± SD | 5.7 ± 5.0 | 6.9 ± 5.2 | NS |
| (range) | (0–17) | (0–16) | |
| Physical diseases | |||
| Ischemic heart disease | 3 (9%) | 6 (14%) | NS |
| Cancer | 3 (9%) | 6 (14%) | NS |
| Hypertension | 10 (35%) | 18 (41%) | NS |
| Diabetes mellitus | 1 (4%) | 2 (5%) | NS |
Control data came from 29 patients undergoing CT scanning at Ancelle della Carità Hospital for reasons other than memory disturbance or neurodegenerative disease. Control subjects underwent brain CT without contrast enhancement because of headache (n = 9), dizziness (n = 15), falls (n = 3), or cancer staging (n = 2). The reviewing radiologist (G.B.) reported that all control CT findings showed no evidence of disease. Four to 14 days after CT scanning was performed, each control subject was contacted by telephone and interviewed by a trained physician (C.G.). Information on sociodemographics, daily function, and physical diseases (ischemic heart disease, cancer, hypertension, and diabetes) was collected. Questions suitable to the CDR scale were asked to estimate global cognitive performance, and a telephone version of the MMSE was administered (25, 26). Compared with the in-person MMSE (maximum score, 30), the telephone version (maximum score, 22) does not include items that assess comprehension of verbal and written commands, copying of pentagons, or sentence writing. Conversion of the telephone MMSE to the in-person version was accomplished by the following equation: MMSE in-person = 1.0101 × MMSE telephone + 5.1632. This conversion equation has a precision of 72% (25). All control subjects scored 18/22 or higher on the telephone MMSE (corresponding to an in-person score of 23.4/30 or higher).
ApoE genotyping was not available for these control subjects. For the purpose of comparison, the frequency of the ε4 allele in the control subjects was assumed to be equal to that of people without dementia in the general Italian population (27).
CT Scan Acquisition and Measures
CT scans were acquired with the spiral scanner Prospeed S (General Electric, Fairfield, CT). Section orientation was parallel to the plane of the temporal lobe; that is, ∼20° caudal to the orbitomeatal line (6). Thin sections (time of 2 s, 120 kV, 160 mA, section thickness of 2 mm, no intersection gap) were taken along the breadth of the temporal lobe from the floor of the middle cranial fossa to the inferior aspect of the orbit. Thicker sections on the same plane (time of 2 s, 120 kV, 130 mA, section thickness of 5 mm, no intersection gap) covered the remainder of the brain from the inferior aspect of the cerebellum to the vertex of the cranium. All scanning was set to a matrix of 512 × 512. For the purposes of this report, all data were analyzed from 8 to 10 images in the temporal lobe region and 16 to 18 images rostral to the temporal region. No contrast agent was used.
In addition to the rWTH measure, we used two previously described measures of MTL atrophy: the transverse width of the temporal horn (tWTH) (8) and the mtMTL (definitions for all measures follow) (6). Other measures, which included the interuncal distance (28) and the frontal index (29), were taken by two raters (G.B.F., C.G.) on hard copies with a digital 0.01-mm-definition caliper (Series 500 Digimatic Absolute caliper; Mitutoyo, Telford, UK). Raters were blinded to clinical information. When right and left measurements were needed, each side was measured separately. To capture the asymmetry of the AD process, the side indicating greater atrophy also was recorded. Head size was determined by measurements of anteroposterior and transverse diameters. Evidence of validity of the rWTH was compared with that of the other two MTL atrophy measures.
Because the greatest proportion of hippocampal atrophy typical of AD occurs in the region of the hippocampal head (30), rWTH was defined as enlargement of the temporal horn owing to shrinkage of the hippocampus. Figure 1A shows the plane in which hippocampal atrophy is reflected as the point of greatest width of the temporal horn (31). To ensure accurate measurement of this area, the plane cuts through the midportion of the hippocampus through all of its length (Fig 1B). In this example, the plane of the image is toward the floor of the temporal horn and cuts the horn where its anteroposterior size is maximal. Variability in head orientation or normal anatomy may cause discordant measurements in different images for the right versus left temporal horn.
Fig 1.
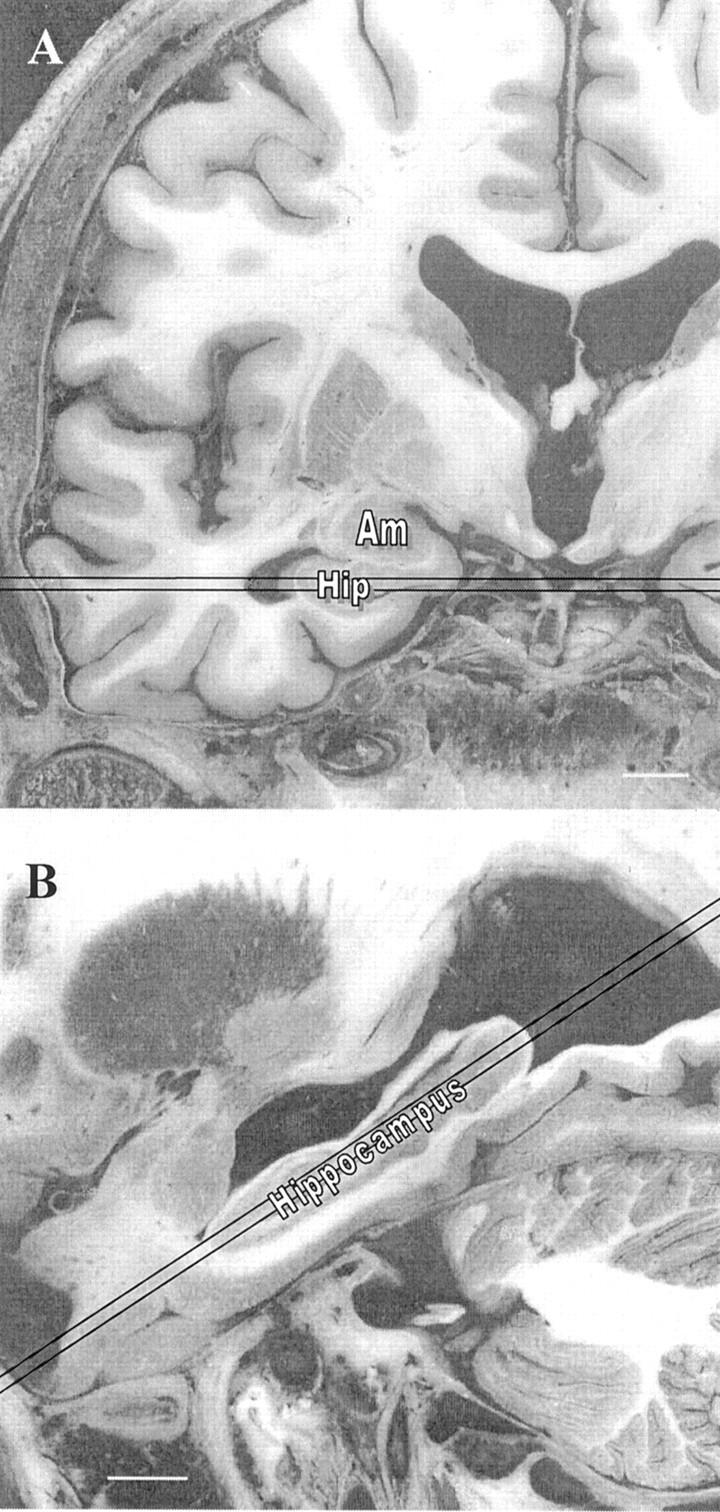
Gross pathologic coronal (A) and axial (B) images showing the 2-mm section where the rWTH should be measured. Note.—Am indicates amygdala; hip, hippocampus. Bar = 10 mm. Adapted from Duvernoy, 1998 (54).
Figure 2 shows section choices and measurements on CT scans. The measure was taken from one of the two or three sections in which 1) the temporal horn could be better appreciated throughout its anteroposterior extension (from the trigone of the lateral ventricle to the tip of the temporal horn) and 2) the tip of the temporal horn was largest. As noted, the correct section for each side may have been one to two scans apart because of angulation of the subjects’ head in the gantry or variations in temporal lobe anatomy. In many control subjects, a large portion of the temporal horn could not be seen, and only the tip of the temporal horn could be recognized. In this event, the scan chosen for measurements was between the most rostral and the most caudal in orientation, in which the most anterior part of the temporal horn still could be appreciated. When imaging the temporal horn with thin sections, partial volume averaging of CSF and brain volume rarely occurred, leaving well-defined edges for the linear measure. When partial volume averaging did occur, careful attention was paid to measure midway through the region of low attenuation surrounding the temporal horn.
Fig 2.
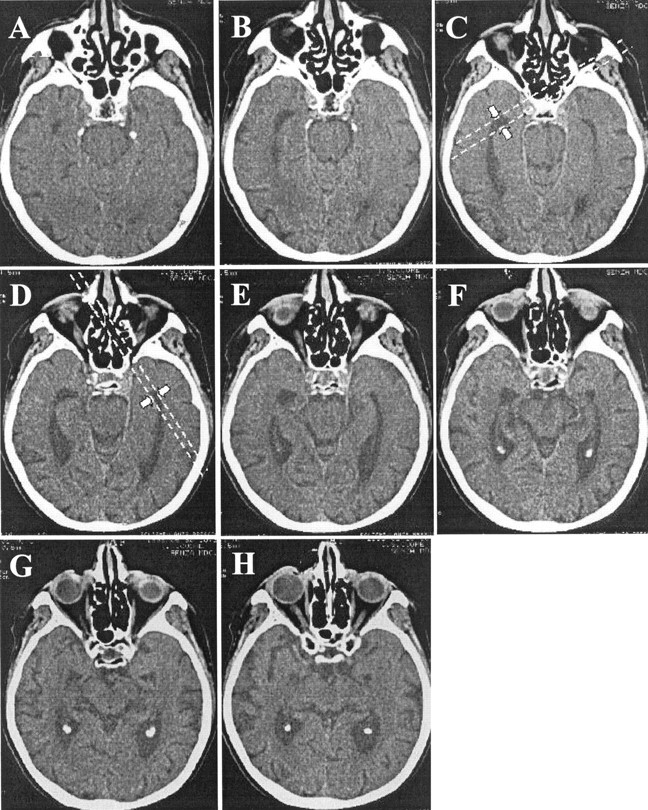
CT scans chosen for rWTH measures. Represented are eight contiguous 2-mm-thick sections spanning the whole caudal-to-rostral extension of the temporal horns of a patient with AD. The scans in which the right and left horns can be appreciated in their full length are C and D, and these are chosen for the measurements. Parallel lines are drawn tangentially to the tip of the temporal horns where the width is maximum (arrows).
Of note, the anterior and rostral parts of the temporal horn were not taken for measurements. This often appears on CT scans as a triangular cul-de-sac (Fig 2E and G [right] and Fig 2F and H [left]) with a caudal anatomic boundary in the upper aspect of the hippocampal head and the rostral boundary in the lower aspect of the amygdala (Fig 1A). Shrinkage of the hippocampal head also is reflected by dilatation of this region, but more extensive partial volume-averaging effects complicate the reliability of measurements in this area.
The tWTH measure, developed and tested by George and colleagues (8), was taken from the section in which 1) the temporal horn could be better appreciated throughout its anteroposterior extension and 2) the width of the temporal horn was largest, as determined by a coronal line that crossed the brain stem anteroior to the origin of the choroidal fissure. The image for the tWTH usually was the same image used to measure the rWTH. Sometimes the choroidal fissure could be appreciated one section apart (usually rostral) from that used for the tWTH. In this case, the former section was used to interpolate the anteroposterior level to be used for the tWTH.
The mtMTL measure was taken from the section in which: 1) the temporal horn could be better appreciated throughout its anteroposterior extension and 2) the MTL, limited to the portion between the anterior and posterior aspects of the brain stem, was thinnest. The image for the mtMTL often was the same as that used to measure the tWTH and the rWTH. Careful choice of the image was mandatory, however, because overly rostral measurements largely underestimate the mtMTL measure and those overly caudal largely overestimate the mtMTL measure (6).
Interuncal distance was measured at the level of the suprasellar cistern where the distance between the unci of the temporal lobes was maximal (28). Of note, unlike the original description of this method (28) and work previously reported by our laboratory (12), this measure was taken at an orientation different from that of the orbitomeatal line.
The frontal index was a lateralized version of the bifrontal index (29). Within each hemisphere, the image chosen for measurement had the largest distance between the midsagittal plane and the tip of the frontal horn. Two measures were taken: 1) the maximum distance between the midsagittal line and the tip of the frontal horn, and 2) the distance between the midsagittal line and the inner aspect of the calvarium. Different sections could be used for the right and left measurements. The frontal index was defined as (distance 1/distance 2) × 100.
Cerebral area was used as a proxy of head size (4, 32). The transverse and sagittal widths of the intracranial area were measured on the scan in which the body of the lateral ventricles could be fully appreciated. The transverse width was taken as the maximum distance between the inner aspects of the cranial bone. The sagittal width was taken on the midsagittal line. To avoid underestimation due to the internal occipital protuberance and frontal crest, we computed the measure as the difference between the maximum distance between the outer aspects of the cranial bone and frontal and occipital bone thickness. Frontal bone thickness was computed as the average of two measurements taken to the right and left of the frontal crest (about 15−20 mm from the midline). Occipital bone thickness was computed in a similar way, with measurements taken to the right and left of the internal occipital protuberance. Cerebral area was computed by approximating the intracranial area to an ellipse, with the following equation: [(sagittal width/2) - (transverse width/2)] × 3.14.
MR Image Acquisition and Measures
The MR images obtained in 28 patients with AD and in 28 control subjects who had been enrolled in a study on linear measures of atrophy were reanalyzed. The clinical features of patients with AD and control subjects and the method of MR acquisition have been described (33–35) and will be only briefly summarized here. These patients had probable AD with mild or moderate dementia severity. MR patients underwent an assessment protocol similar to that of patients described in the CT section, except that the neuropsychologic battery was less extensive (34), and information on physical health was not collected.
Control subjects were the patients’ relatives (mostly spouses) without detectable cognitive deficit. The in-person version of the MMSE was administered. ApoE phenotyping was performed on patients and control subjects with isoelectric focusing on delipidated plasma samples (36).
Three-dimensional gradient-echo MR imaging was performed by using a 1.5-T Magnetom unit (Siemens, Ehrlangen, Germany) with a standard head coil. Acquisition parameters were 10/4/300 (TR/TE/TI); flip angle, 10°; field of view, 250 mm; acquisition, 2; matrix, 160 × 256; section thickness, 1.33 mm; pixel spacing, 0.98 mm; sections, 128. Total acquisition time was 7 minutes 40 seconds. Linear and volumetric measures were taken (12, 35).
The rWTH was taken on reconstructed, 2-mm-thick sections oriented at the temporal lobe plane on paper printouts obtained from a high-quality (1200 dots per inch) laser printer. The measure was taken with a caliper, as described for the CT-based measure. Other linear measures of MTL atrophy (width of the temporal horn, width of the choroid fissure, and height of the hippocampal formation) were taken on coronal images (section thickness, 1.3 mm) roughly perpendicular to the temporal lobe plane (12). The interuncal distance (28) was taken in a plane parallel to the orbitomeatal line. In the same section, the width of the interhemispheric fissure was taken and defined as the largest distance between the mesial aspects of the cerebral cortex in the interhemispheric fissure (12). We used semiautomated quantitation after operator-guided removal of the calvarium to calculate the volumes of the temporal and frontal lobes and temporal horn (35, 37).
Intracranial structures were defined by following along the dura mater of each image presented at 3× magnification on a SUN workstation equipped with QUANTA software (37). Brain matter was segmented from CSF by mathematical modeling of underlying pixel signal intensity distributions and by determining a signal intensity threshold that optimized tissue segmentation (37). After segmentation was complete, the operator returned to the image for regional analysis according to published protocols (38). Manual tracing was used to take the volumes of the hippocampus and entorhinal cortex by following standard protocols (39, 40). The hippocampus was considered as the dentate gyrus, hippocampus proper, and the subicular complex. The first section was measured at the point at which the hippocampus appeared below the amygdala, and the last section was measured where the crura of the fornices departed from the lateral wall of the lateral ventricles. For the entorhinal cortex, the first measured section was taken after the appearance of the lumen insula, where the temporal lobe was visibly attached to the rest of the brain when from an anterior direction. The last section was measured at the point at which the uncus and gyrus intralimbicus could no longer be visualized.
Statistical Analysis
The t test for independent samples was used to assess mean differences in continuous variables between the AD and control groups. Proportional differences were tested with the chi-square test. The critical value for statistical significance was set at P < .05 for all tests. The association between continuous variables was assessed with Pearson’s r and 95% confidence intervals (CI). We explored the associations of age, education, and head size to atrophy measures in control subjects with locally weighted regression (41) and with linear regression when the relationship was linear. Several indicators of validity for the rWTH were addressed.
We used test-retest reliability of the rWTH, interrater reliability, convergent and discriminant validity with other atrophy measures, and known-group validity to validate the measure. We also tested its validity on MR images through convergent and discriminant validity with other linear and volumetric measures of atrophy and known-group validity in a dataset used for previous studies (33).
Test-retest and interrater reliability refer to the accuracy of repeatedly measuring the rWTH of any given subject by the same rater or by different raters. We used the intraclass correlation coefficient (42) as the index of agreement. Values >0.80 are considered to indicate good agreement. To compare the reliability of the rWTH with that of other similar measures (6), the mean difference and the standardized difference between repeated measurements also were computed. This index was computed by expressing the test measures as z scores (having a mean of 0 and SD of 1), the retest and second rater measure as a z score function of the test measure, and then subtracting the z scores of test and retest, and of test and second-rater measures. The resulting standardized difference is a measure of agreement that can be used to compare different measures.
Convergent validity is defined as the ability of a test to agree with other tests tapping the same dimension, and discriminant validity is defined as the ability not to agree with other tests tapping different dimensions (43). For rWTH, convergent validity can be assessed by agreement with measures of the temporal horn and other MTL structures, whereas discriminant validity can be assessed by disagreement with measures of non-MTL structures. If good discriminant validity exists, one would expect decreasing correlations between the rWTH and other brain structures as the anatomic distance from the temporal horn increases. Conversely, the correlation with homolateral structures should be higher than that with contralateral structures.
Known-group validity is defined as the ability of a test to separate individuals who are known to differ with regard to the criterion variable that the test is believed to reflect. For of a measure of MTL atrophy such as the rWTH, we believe that comparing patients with AD who have known disease affecting the MTL with healthy control subjects who have a presumably unaffected MTL is appropriate for this measure. The higher the proportion of patients with AD (sensitivity) and healthy control subjects (specificity) who were correctly identified, the greater the validity of the rWTH. The effect of age on atrophy measures was accounted for by transforming the rWTH and other measures of MTL atrophy into age-specific, standardized values (W scores) (6). The W score was defined as the standardized (having a mean of 0 and SD of 1) ratio of the observed to the expected value (3) according to the following equation—(observed value–expected age-specific value in control subjects)/SD of residuals in control subjects—where expected age-specific values and residuals in control subjects were computed by linear regression analysis.
W scores thus denote the departure of each individual value from the expected value of the reference distribution based on control subjects. Assuming a normal distribution, W scores less than 0 indicate atrophy below the 50th percentile of the age-specific distribution; less than −1.65, below the 5th percentile; and less than −1.96, below the 2.5th percentile.
The measure of known-group validity was sensitivity (with 95% CI) (41) for AD with a specificity set a priori at 95% (ie, a fixed 5% of control subjects were allowed to be wrongly identified as patients with AD). W scores were fitted to separate gaussian models in patients with AD and control subjects, and sensitivity was defined as the area under the curve of the AD patient distribution that fell below the value of W of −1.96 (12). W scores were computed separately for right, left, and largest or smallest measures. The transformation into W scores allowed us to compare the efficiency of measures with different ranges and units of measure to separate patients with AD from control subjects.
Of note, the sensitivity figures obtained from this study cannot be compared directly with the accuracy rates reported in other studies. Accuracy is the ratio of all correctly classified individuals to the total number of individuals and, as such, is a weighted mean of sensitivity and specificity. Accuracy measures, therefore, reflect greater weight attributable to the group that has the most members. As such, accuracy is not a sufficiently informative index of diagnostic classification, because different clinical conditions may have different demands on sensitivity or specificity. For example, the clinical priorities for detection of AD are, first, to exclude normality with high specificity and, second, to detect AD with the highest possible sensitivity. For this reason, in the present study we set a fixed and high specificity value (95%) to detect control subjects and computed the sensitivity value for AD that followed.
Results
CT Study Group
Demographic variables of subjects enrolled in the CT group are summarized in Table 1. Patients with AD were significantly older than were control subjects and had significantly fewer years of education. The MMSE and CDR indicated normal cognitive performance in control subjects and mild dementia in patients with AD, and the average disease duration was consistent with the level of cognitive performance. In addition, the Apo ε4 allele was significantly more prevalent in patients with AD than in control subjects. Neither group had evidence of significant brain infarction on CT scans. However, nine control subjects (33%) and seven patients with AD (17%) had single lacunar infarcts. Patients with AD had greater mean leukoaraiosis scores than did control subjects, although these differences did not reach significance. Physical diseases were equally represented in the two groups.
The effects of age, sex, and head size on atrophy measures were assessed independently for control subjects. Only the left tWTH correlated with age (rWTH: r = −0.03 for the right and 0.25 for the left, P = >.19; mtMTL: r = −0.09 for the right and 0.19 for the left, P = >.34; tWTH: r = 0.20 for the right, P = .31, and 0.38 for the left, P = .04). Sex-related differences were not significant for any measure (t < 1.2, P = .26). Only the left rWTH (r = 0.40, P = .03) and the right mtMTL (r = 0.39, P = .04) correlated with the measure of head size.
On the basis of these data, we chose to carry out two parallel analyses, one taking into account the effect of age and the other taking into account both age and head size. Age-adjusted values are presented in the tables and figures, whereas differences in the results after adjustment for age and head size are described separately at the end of this section.
The reproducibility of the measures was compared between and within raters (interrater and test-retest reliability). To assure accurate estimates of reliability, the dataset was divided into two parts: a training set and a test set. For the training set, a random sample of 10 patients and 10 control subjects was analyzed by two blinded raters (G.B.F., C.G.). Analysis of the discordant individual values allowed detection of inconsistencies to standardize the analytic procedure. Review of inconsistent values revealed differences related mainly to the rater’s choice of image to analyze for the rWTH and tWTH, and to partial volume effects for the mtMTL. After consensus was reached regarding standardized rules for the various measurements, repeat blinded analysis was performed on an independent sample of 20 patients with AD (mean age, 76 ± 8 years; 86% women; mean education, 6 ± 4 years; mean MMSE score, 21.6 ± 2.6) and 20 control subjects (mean age, 70 ± 8 years; 65% women; mean education, 9 ± 5 years; mean MMSE score, 27.1 ± 7.0).
Analysis of reliability measures with intraclass correlation coefficients is summarized in Table 2. Interrater reliabilities for the rWTH measures were quite good, as were interrater reliabilities for the tWTH measures. Interrater reliabilities for the mtMTL measures were generally modest. Test-retest analysis (Table 2) was carried out after 2 weeks on second-wave subjects by one of the two raters (C.G.), again with satisfactory results for the rWTH measures. The mean standardized difference between measures was generally small.
TABLE 2:
Test-Retest and Interrater Reliability Versus Other Linear Measures of MTL Atrophy in 20 Patients with AD and 20 Control Subjects in the CT Group
| Mean Difference Between Measurements |
Intraclass Correlation | ||||||||
|---|---|---|---|---|---|---|---|---|---|
| Crude Values (mm) Test |
Crude (mm) |
Standardized (z) |
Coefficient |
||||||
| 1st Rater, Test | 1st Rater, Retest | 2nd Rater | Within Rater | Between Raters | Within Rater | Between Raters | Within Rater | Between Raters | |
| Mean radial width of the temporal horn ± SD | |||||||||
| Right | 4.6 ± 3.0 | 4.4 ± 2.9 | 4.5 ± 2.7 | 0.21 ± .67 | −0.20 ± 0.77 | 0.07 ± 0.22 | −0.09 ± 0.25 | 0.97 | 0.96 |
| Left | 4.0 ± 2.8 | 3.9 ± 2.7 | 4.1 ± 2.7 | 0.11 ± .48 | −0.19 ± 0.65 | 0.04 ± 0.17 | −0.05 ± 0.23 | 0.98 | 0.95 |
| Largest | 5.1 ± 3.0 | 4.9 ± 2.8 | 5.2 ± 3.0 | 0.25 ± .56 | −0.29 ± 0.81 | 0.09 ± 0.19 | −0.12 ± 0.26 | 0.98 | 0.94 |
| Mean transverse widthof the temporal horn ± SD | |||||||||
| Right | 3.6 ± 1.5 | 3.7 ± 1.6 | 3.7 ± 1.5 | −0.09 ± .34 | −0.05 ± 0.59 | −0.06 ± 0.23 | −0.03 ± 0.41 | 0.97 | 0.93 |
| Left | 4.7 ± 2.5 | 4.8 ± 2.5 | 4.8 ± 2.3 | −0.14 ± .46 | −0.16 ± 0.58 | −0.05 ± 0.18 | −0.06 ± 0.23 | 0.98 | 0.97 |
| Largest | 5.1 ± 2.4 | 5.2 ± 2.2 | 5.3 ± 2.3 | −0.09 ± .42 | −0.18 ± 0.64 | −0.04 ± 0.18 | −0.08 ± 0.27 | 0.98 | 0.96 |
| Mean minimum thickness of the MLT ± SD | |||||||||
| Right | 13.5 ± 3.3 | 14.2 ± 3.0 | 14.0 ± 4.1 | −0.71 ± 2.36 | −0.51 ± 2.47 | −0.22 ± 0.72 | −0.16 ± 0.76 | 0.71 | 0.73 |
| Left | 14.1 ± 3.4 | 14.3 ± 2.7 | 14.4 ± 3.9 | −0.20 ± 2.43 | −0.36 ± 2.68 | −0.06 ± 0.71 | −0.10 ± 0.78 | 0.69 | 0.66 |
| Smallest | 12.9 ± 3.3 | 13.4 ± 2.7 | 13.3 ± 4.1 | −0.43 ± 2.20 | −0.39 ± 2.42 | −0.13 ± 0.67 | −0.12 ± 0.73 | 0.74 | 0.78 |
Note.—Standardized (z) differences are computed by considering control subjects as the reference group.
As expected with a valid measure, correlations between the rWTH and other brain measures decreased with increasing distance from the medial temporal regions, being highest with the tWTH and lowest for the frontal index (Table 3). Moreover, the correlation was generally higher between homolateral regions than between contralateral regions.
TABLE 3:
Convergent and Discriminant Validity in 42 Patients with AD and 29 Control Subjects in the CT Group
| Volumetric Measures | Pearson’s r (95% confidence interval), rWTH |
|||
|---|---|---|---|---|
| Right | Left | Largest | ||
| Transverse width of the temporal horn | HL | 0.74 (0.61–0.83) | 0.79 (0.68–0.86) | 0.76 (0.64–0.84) |
| CL | 0.60 (0.43–0.73) | 0.74 (0.61–0.83) | ||
| Minimum thickness of the medial temporal lobe | HL | −0.71 (−0.81–0.57) | −0.69 (−0.80–−0.54) | −0.78 (−0.86–−0.67) |
| CL | −0.63 (−0.75–−0.47) | −0.68 (−0.79–−0.53) | ||
| Interuncal distance | 0.49 (0.29–0.65) | 0.50 (0.30–0.66) | 0.48 (0.28–0.64) | |
| Frontal index | HL | 0.42 (0.21–0.60) | 0.40 (0.18–0.58) | 0.40 (0.18–0.58) |
| CL | 0.42 (0.21–0.60) | 0.35 (0.13–0.54) | ||
Note.—HL indicates homolateral; CL, contralateral.
All measures of known-group validity differed significantly between patients with AD and control subjects (P < .0005 for all comparisons; Table 4). Converting crude values into W scores, however, revealed that age-corrected rWTH measures for patients with AD were 3.4−4.6 SD greater than those for control subjects, whereas other atrophy measures were closer to the control distribution (1.9−2.7 SD). This observation accounts for the greater sensitivity of the rWTH to separate patients with AD from control subjects. Although the sensitivity of the tWTH and mtMTL measures was between 57% and 74%, the sensitivity of the rWTH was between 83% and 93%. Figure 3 shows that the cutoff for the largest rWTH was relatively independent of age (5.10 mm at 50 years and 5.35 at 90 years). The largest rWTH (∼5.3 mm [AD, >5.3 mm; normal, <5.3 mm]) correctly classified 39 of 42 patients with AD and 28 of 29 control subjects (sensitivity of 93% and specificity of 97%) over the age range of 50−90 years. The slightly higher figures of this computation compared with those in Table 4 (95% and 95%) are attributable to the latter being computed with W scores rather than with crude values. Accuracy figures were remarkably smaller for the other two measures. Cutoff values of the largest tWTH of 2.51−4.51 mm were able to separate AD with accuracy figures of 64% and 95%, and cutoff values of the mtMTL of 20.0−22.0 mm had accuracy figures of 74% and 95%. The cutoff values of these latter two measures were remarkably age-dependent.
TABLE 4:
Comparison of Known-Group Validity (Discrimination of 42 Patients with AD from 29 Control Subjects) with Other Linear CT-Based Measures of MTL Lobe Atrophy in CT Group
| Control Group |
AD Group |
Sensitivity (95% CI)* | ||
|---|---|---|---|---|
| Mean Crude Measure ± SD (mm) | Mean Crude Measure ± SD (mm) | Mean W-score ± SD | ||
| Radial width of the temporal horn | ||||
| Right | 2.9 ± 1.4 | 7.8 ± 3.0 | 3.6 ± 2.2 | 86% (71%–94%) |
| Left | 2.4 ± 1.3 | 7.8 ± 3.2 | 4.1 ± 2.4 | 83% (68%–92%) |
| Largest | 3.2 ± 1.2 | 9.1 ± 3.0 | 4.7 ± 2.4 | 93% (80%–98%) |
| Transverse width of the temporal horn | ||||
| Right | 1.0 ± 1.1 | 3.7 ± 1.9 | 2.2 ± 1.7 | 62% (46%–76%) |
| Left | 1.2 ± 1.3 | 4.3 ± 2.4 | 2.3 ± 1.9 | 57% (41%–72%) |
| Largest | 1.5 ± 1.3 | 4.7 ± 2.3 | 2.4 ± 1.9 | 64% (48%–78%) |
| Minimum thickness of the medial temporal lobe | ||||
| Right | 17.4 ± 2.3 | 10.9 ± 3.4 | −2.7 ± 1.4 | 74% (58%–86%) |
| Left | 17.0 ± 3.1 | 11.6 ± 3.6 | −1.9 ± 1.2 | 57% (41%–72%) |
| Smallest | 16.4 ± 2.8 | 10.2 ± 3.3 | −2.4 ± 1.2 | 74% (58%–86%) |
Note.—P < .001 for difference between groups on t test for all measures. W scores are age-standardized values; that is, the number of SD away from the age-specific atrophy value of control subjects (W scores in control subjects, 0.0 ± 1.0). Greater absolute values indicate greater atrophy.
Values computed by modeling W scores of patients with AD and control subjects with specificity set at 95%.
Fig 3.

Known-group validity of CT- (left) and MR-based (right) rWTH measures compared with that of other CT- and MR-based linear and volumetric measures of MTL atrophy in patients with AD (open circles) and control subjects (solid circles). Solid lines represent regression lines of the measures on age in control subjects. Dotted lines represent age-specific cutoffs that correctly classify 95% of control subjects.
Repeat analysis of known-group validity was done after adjustment for both age and head size. Sensitivity figures changed from −2% to +1% for the three rWTH measures, from −1% to +4% for the transverse WTH, and from −6% to −1% for the mtMTL. The rWTH measures were least affected when head size was a factor.
MR Imaging Study Group
Subject demographics for this comparison are summarized in Table 5. Subjects enrolled in the MR imaging group were similar to those enrolled in the CT validation study, except that educational status in the MR study group did not differ significantly between the AD and non-AD groups. The severity of dementia as measured by MMSE (mean score, 21) was similar to that of the CT group, but the range of severity was broader for the MR group. This can be appreciated by both the greater SD of the MMSE and by the wider CDR score distribution in the MR group. None of the patients had focal lesions on MR images, although some images showed slightly hyperintense punctate white matter.
TABLE 5:
Baseline Characteristics of the MR Study Group
| Baseline Characteristics | Control Group (n = 28) | AD Group (n = 28) | P value* |
|---|---|---|---|
| Sociodemographics and anthropometrics | |||
| Mean age at observation ± SD (y) | 69 ± 8 | 74 ± 9 | .05 |
| (range) | (54–83) | (53–86) | |
| Women | 19 (68%) | 22 (79%) | NS |
| Mean education ± SD (y) | 8 ± 3 | 7 ± 4 | NS |
| (range) | (5–19) | (2–18) | |
| Dementia-related variables | |||
| MMSE score ± SD | 29.2 ± 1.5 | 20.5 ± 4.2 | <.0001 |
| (range) | (25–30) | (12–27) | |
| CDR 0/.5/1/2 or 3 | 28/0/0/0 | 0/8/12/8 | <.0001 |
| Mean disease duration ± SD (mo) | — | 42 ± 26 | — |
| (range) | (9–120) | ||
| ApoE ε4 allele† | 6/52 (12%) | 17/52 (33%) | .02 |
t test for independent samples or chi-square test.
Genotyping available for 26 patients with AD and 26 control subjects.
In the analysis of convergent and discriminant validity, most MTL measures correlated significantly with age in control patients. The correlations of the right and left rWTH with age were 0.53 and 0.44, respectively (P < .02). The other linear measures that had the highest correlation with age were the left and right width of the temporal horn (r = 0.58 [right] and 0.55 [left], P < .003), and the volumetric measure with the highest correlation was the left hippocampus (r = 0.66, P < .0005).
Table 6 summarizes correlations between rWTH measures and the other atrophy measures. The three blocks of linear, semiautomated, and manually traced measures are presented separately because of their different degrees of accuracy. Correlations between rWTH measures decreased significantly with increasing distance from the temporal horn or hippocampal regions in all three blocks. In particular, the correlation was relatively high with the two measures of temporal horn size—between 0.59 and 0.83 with the temporal horn width (linear) and between 0.58 and 0.80 with the temporal horn volume—whereas it was as low as 0.07−0.15 with the interhemispheric fissure width, a poor and distant (frontal) measure of atrophy. Correlations with hippocampal volumes also were relatively high (0.59−0.74), but correlations were lower with the entorhinal cortex (0.50−0.58). Moreover, similar to the results of the CT-based measures, the homolateral measures correlated more closely than did contralateral measures, although the effect was less marked than with the CT-based measures.
TABLE 6:
Convergent and Discriminant Validity in 28 Patients with AD and 28 Control Subjects in MR Group
| Atrophy Measures | Pearson’s r (95% CI), rWTH |
|||
|---|---|---|---|---|
| Right | Left | Largest | ||
| Linear measures on coronal images | HL | |||
| Temporal horn | 0.73 (0.58–0.83) | 0.74 (0.59–0.84) | 0.83 (0.73–0.90) | |
| Width | CL | 0.78 (0.65–0.87) | 0.59 (0.39–0.74) | |
| Choroid fissure | HL | 0.47 (0.24–0.65) | 0.58 (0.37–0.73) | 0.53 (0.31–0.70) |
| Width | CL | 0.46 (0.22–0.64) | 0.41 (0.16–0.61) | |
| Hippocampal | HL | −0.57 (−0.72–−0.36) | −0.46 (−0.64–−0.22) | −0.47 (−0.65–−0.24) |
| Height | CL | −0.48 (−0.66–−0.25) | −0.48 (−0.66–−0.25) | |
| Interuncal distance | 0.44 (0.20–0.63) | 0.43 (0.19–0.62) | 0.40 (0.15–0.60) | |
| Interhemispheric fissure width | 0.16 (−0.11–0.41) | 0.07 (−0.20–0.33) | 0.15 (−0.12–0.40) | |
| Semiautomated volumetric measures | ||||
| Temporal horn | HL | 0.79 (0.67–0.87) | 0.77 (0.64–0.86) | 0.80 (0.68–0.88) |
| CL | 0.79 (0.67–0.87) | 0.58 (0.37–0.73) | ||
| Temporal lobe | HL | −0.62 (−0.76–0.43) | −0.60 (−0.75–−0.40) | −0.68 (0.51–0.80) |
| CL | −0.65 (−0.78–−0.47) | −0.50 (−0.67–−0.27) | ||
| Frontal lobe | HL | −0.50 (−0.67–−0.27) | −0.44 (−0.63–−0.20) | −0.49 (0.26–0.67) |
| CL | −0.54 (−0.70–−0.32) | −0.40 (−0.60–−0.15) | ||
| Manually traced volumetric measures | ||||
| Hippocampus | HL | −0.69 (−0.81–−0.52) | −0.66 (−0.79–−0.48) | −0.74 (−0.84–−0.59) |
| CL | −0.69 (−0.81–−0.52) | −0.59 (−0.74–−0.39) | ||
| Entorhinal cortex | HL | −0.56 (−0.72–−0.35) | −0.50 (−0.67–−0.27) | −0.58 (−0.73–−0.37) |
| CL | −0.50 (−0.67–−0.27) | −0.52 (−0.69–−0.30) | ||
Note.—HL indicates homolateral; CL, contralateral.
For the known-group validity analysis, Table 7 shows that the accuracy of the rWTH taken on MR images was lower than that of the corresponding CT measure. When specificity was set at 95%, the highest sensitivity to detect AD was 76%, achieved by the right rWTH. The largest rWTH was only modestly lower (73%). Of note, the sensitivity of hippocampal volume was comparable with that of the rWTH (71%). Figure 3 shows that the rWTH could correctly classify 21 of 28 patients with AD and 26 of 28 control subjects (sensitivity of 75% and specificity of 93%) by using a cutoff between 3.6 mm at age 50 years and a cutoff of 6.7 mm at age 90 years and no statistical modeling of the data. Table 7 and Figure 3 also show that the accuracy of the rWTH compared favorably with other measures of MTL atrophy known to be sensitive to AD (coronal width of the temporal horn and hippocampal volume) (3, 12, 45).
TABLE 7:
Comparison of Known-Group Validity (Discrimination of 28 Patients with AD from 28 Control Subjects) with Linear and Volumetric MR-Based Measures of MTL Atrophy in the MR Group
| Control Group |
AD Group |
Sensitivity (95% CI)* | ||
|---|---|---|---|---|
| Mean Crude Measure ± SD (mm) | Mean Crude Measure ± SD (mm) | Mean W-score ± SD | ||
| Radial width of the temporal horn (mm) | ||||
| Right | 3.7 ± 1.1 | 6.7 ± 2.0 | 3.0 ± 1.9 | 76% (56%–89%) |
| Left | 3.3 ± 1.5 | 5.8 ± 2.5 | 1.7 ± 1.6 | 51% (32%–70%) |
| Largest | 4.1 ± 1.2 | 7.2 ± 2.1 | 2.7 ± 1.7 | 73% (53%–87%) |
| Coronal width of the temporal horn (mm) | ||||
| Right | 3.0 ± 1.2 | 5.3 ± 2.3 | 2.4 ± 2.3 | 63% (43%–80%) |
| Left | 3.2 ± 1.1 | 6.1 ± 2.3 | 3.4 ± 2.7 | 74% (54%–88%) |
| Largest | 3.4 ± 1.2 | 6.5 ± 2.3 | 2.7 ± 2.1 | 69% (49%–84%) |
| Hippocampal volume (mm3) | ||||
| Right | 1951 ± 335 | 1309 ± 361 | 1.7 ± 1.2 | 52% (33%–71%) |
| Left | 1797 ± 288 | 1263 ± 344 | 1.7 ± 1.0 | 52% (33%–71%) |
| Smallest | 1774 ± 282 | 1191 ± 336 | 2.3 ± 1.2 | 71% (51%–86%) |
Note.—P < .0005 for difference between groups on t test for all measures. W scores are age-standardized values, that is, the number of SD away from the age-specific atrophy value of control subjects (control W scores, 0 ± 1.0). Greater absolute values indicate greater atrophy.
Values computed by modeling W scores of Patients with AD and control subjects with specificity set at 95%.
The analysis of known-group validity was rerun after adjustment for both age and head size. Sensitivity figures changed from −1% to +1% for the three rWTH measures, from −2% to +2% for the coronal WTH, and from −3% to 1% for hippocampal volume.
Discussion
These results suggest that CT measurement of rWTH is a feasible, reliable, and sensitive marker of brain changes associated with AD. Values of the largest (between the right and left) rWTH >5.3 mm can differentiate patients with AD of mild severity from control subjects without dementia with 93% sensitivity and 97% specificity in subjects ranging from 50−90 years old. The discriminative power of the rWTH taken on hard-copy printouts of reconstructed MR images is somewhat lower (76% sensitivity and 95% specificity).
Our data must be viewed in light of research that has had fewer positive results. Studies have reported sensitivities varying from 33% to 82% with specificity set at 95%. Further review, however, suggests that much of the variation in these results reflect different image-acquisition or measurement protocols (10–14). For example, a CT study by Soininen et al (10) used a standard image orientation and 8-mm-thick section images. Reports of MR studies also have tended to use thick-section imaging (11, 13, 14). Studies using relatively thin-section imaging (12, 44) have shown consistently superior sensitivities, ranging from 74% to 82%. Moreover, the brain structure measured also appears important. Other linear measures, such as hippocampal height or the width of the choroid fissure, have had lower sensitivity (11), confirming the unique utility of temporal horn measures. Finally, in a single longitudinal study, Jack and colleagues (15) have shown that the rate of temporal horn enlargement is nearly identical to that of hippocampal atrophy, suggesting that temporal horn measures also may be used for longitudinal assessments.
The image-acquisition and measurement protocols used in the present study were designed to reduce two major sources of error. First, partial-volume effect is reduced by acquiring the image on a plane parallel to the hippocampus and by the use of thin (2-mm thick) imaging sections. Second, we chose a measure that best approximates the hippocampus, an area of the brain affected early and severely in AD (45). Moreover, our chosen measure specifically reflects changes in the head of the hippocampus. Because the transverse section of the hippocampal head is larger than that of the body and tail, proportional shrinkage of the hippocampus is more likely to be detected by measures of its head. Hippocampal atrophy, however, may not be proportional throughout. Regional analysis of MR imaging data show that AD-associated shrinkage of the hippocampal head is about twice that of the body or tail, supporting use of this measurement as a marker for early AD-associated brain changes (31).
Our failure to reproduce previous findings with the mtMTL measure deserves mention. The mtMTL was originally proposed by Jobst and colleagues (6) to be an accurate (92% sensitive and 95% specific) brain measure useful in distinguishing patients with AD from age-matched subjects without dementia. Measurement of mtMTL also was reported to be quite reliable (6). Unfortunately, Jobst et al (6) used the mean difference between the test and retest measures to assess reliability. Without a systematic measurement error, the differences between repeated measures tended to zero; therefore, the variability of the differences would more accurately indicate reproducibility. Examining the SD of the variance is, therefore, a better measure. The SD of the difference was relatively large in the Jobst study, suggesting that the measure may be less reliable than originally proposed (6). In the present study, we addressed the reproducibility of the mtMTL by standardized variability of the difference between measurements. We found the standardized variability of the difference of the mtMTL to be much higher than that of the rWTH, and this variability was mirrored by lower intraclass correlation values, a more accepted measure of agreement (42). We believe that lower reliability of the mtMTL measure explains the reduced accuracy of this measure in our study.
Although we have provided some indicators of the validity of the rWTH, several issues still must be addressed. First, the number of control subjects that we used to set age-specific norms is relatively low. The low number may explain the failure to detect some expected relationships consistently on CT scans, such as those of age and head size. It may also explain the correlation of rWTH with age on MR images and the lack of correlation of this measure with age on CT scans. Moreover, the age range of the control subjects did not cover the whole age range of those in the AD group. This led to the use of extrapolation to compute age-specific normative values for CT measures in the age range of 82−90 years (Fig 3). This method may be valid in older individuals; however, because age-related atrophy of the MTL has been reported to increase linearly with age (4, 6, 38, 46). Further work will be needed to expand the age range of the normative database.
Although not directly addressed in this study, we believe that the measurement of the rWTH may prove clinically valuable for early diagnosis of AD. This belief stems from two major sources. First, imaging (mainly with CT) is generally available and inexpensive, and measurement of the rWTH is relatively simple (it can be performed directly from the imaging console). Second, recent evidence suggests that current therapies for AD improve cognition (47, 48), enhance activities of daily living (49), reduce the incidence of unwanted behaviors (50), and may even modify disease progression (51). Treatment is expensive, however, and prescription of these medications without careful evaluation is unwarranted. Anatomic brain imaging as part of early detection of AD not only excludes other causes of cognitive impairment (52) but also may add to physician confidence when making the diagnosis (53). Although no anatomic measure can verify the presence of AD, brain changes consistent with the disease can convey important information early in the course of the illness when confidence in the diagnosis is less than certain. Although our results suggest that the rWTH measurement is reliable and possibly beneficial for detection of AD, its cost-benefit ratio still must be formally studied.
Acknowledgments
We thank Drs. Federica Aleotti, Lorena Bresciani, Samantha Galluzzi, and Maria Chiara Ubezio for their help with image management and literature searches. Our thanks also to Drs. Giulia Lussignoli and Alessandra Pezzini, who helped with the organization of The Mild Alzheimer Project, and to Dr. Alberto Orlandini, Poliambulanza Hospital, and Mr. Ricca, Ancelle della Carità Hospital, who helped in the image-acquisition phase.
Footnotes
Supported in part by grants from the IRCCS San Giovanni di Dio-FBF, Brescia, Italy.
Presented at the 52nd annual meeting of the American Academy of Neurology, San Diego, April 2000.
References
- 1.Radebaugh TS, Khachaturian S, eds. Report of the Working Group on Biological Markers of Alzheimer’s Disease. Chicago: Ronald and Nancy Reagan Research Institute–Alzheimer’s Association; 1997
- 2.Juottonen K, Laakso MP, Partanen K, Soininen H. Comparative MRI analysis of the entorhinal cortex and hippocampus in diagnosing Alzheimer’s disease. AJNR Am J Neuroradiol 1999;20:139–144 [PubMed] [Google Scholar]
- 3.Jack CR, Petersen RC, Cheng Xu Y, et al. Medial temporal atrophy on MRI in normal aging and very mild Alzheimer’s disease. Neurology 1997;49:786–794 [DOI] [PMC free article] [PubMed] [Google Scholar]
- 4.Laakso MP, Soininen H, Partanen K, et al. MRI of the hippocampus in Alzheimer’s disease: sensitivity, specificity, and analysis of the incorrectly classified subjects. Neurobiol Aging 1998;19:23–31 [DOI] [PubMed] [Google Scholar]
- 5.DeCarli C, Kaye JA, Horwitz B, Rapoport SI. Critical analysis of the use of computer-assisted transverse axial tomography to study human brain in aging and dementia of the Alzheimer type. Neurology 1990;40:872–883 [DOI] [PubMed] [Google Scholar]
- 6.Jobst KA, Smith AD, Szatmari M, et al. Detection in life of confirmed Alzheimer’s disease using a simple measurement of medial temporal lobe atrophy by computed tomography. Lancet 1992;340:1179–1183 [DOI] [PubMed] [Google Scholar]
- 7.Jobst KA, Smith AD, Szatmari M, et al. Rapidly progressing atrophy of medial temporal lobe in Alzheimer’s disease. Lancet 1994;343:829–830 [DOI] [PubMed] [Google Scholar]
- 8.George AE, de Leon MJ, Stylopoulos LA, et al. CT diagnostic features of Alzheimer disease: importance of the choroidal/hippocampal fissure complex. AJNR Am J Neuroradiol 1990;11:101–107 [PMC free article] [PubMed] [Google Scholar]
- 9.de Leon MJ, Golomb J, George AE, et al. The radiologic prediction of Alzheimer disease: the atrophic hippocampal formation. AJNR Am J Neuroradiol 1993;14:897–906 [PMC free article] [PubMed] [Google Scholar]
- 10.Soininen H, Puranen M, Riekkinen PJ. Computed tomography findings in senile dementia and normal aging. J Neurol Neurosurg Psychiatry 1982;45:50–54 [DOI] [PMC free article] [PubMed] [Google Scholar]
- 11.Scheltens PH, Leys D, Barkhof F, et al. Atrophy of medial temporal lobes on MRI in “probable” Alzheimer’s disease and normal ageing: diagnostic value and neuropsychological correlates. J Neurol Neurosurg Psychiatry 1992;55:967–972 [DOI] [PMC free article] [PubMed] [Google Scholar]
- 12.Frisoni GB, Beltramello A, Weiss C, Geroldi C, Bianchetti A, Trabucchi M. Linear measures of atrophy in mild Alzheimer disease. AJNR Am J Neuroradiol 1996;17:913–923 [PMC free article] [PubMed] [Google Scholar]
- 13.Erkinjuntti T, Lee DH, Gao F, et al. Temporal lobe atrophy on magnetic resonance imaging in the diagnosis of early Alzheimer’s disease. Arch Neurol 1993;50:305–310 [DOI] [PubMed] [Google Scholar]
- 14.DeCarli C, Murphy DG, McIntosh AR, Teichberg D, Schapiro MB, Horowitz B. Discriminant analysis of MRI measures as a method to determine the presence of dementia of the Alzheimer type. Psychiatry Res 1995;57:119–130 [DOI] [PubMed] [Google Scholar]
- 15.Jack CR Jr, Petersen RC, Xu Y, et al. Rate of medial temporal lobe atrophy in typical aging and Alzheimer’s disease. Neurology 1998;51:993–999 [DOI] [PMC free article] [PubMed] [Google Scholar]
- 16.Zanetti O, Geroldi C, Frisoni GB, Bianchetti A, Trabucchi M. Contrasting results between caregiver’s report and direct assessment of activities of daily living in patients affected by mild and very mild dementia: the contribution of the caregiver’s personal characteristics. J Am Geriatr Soc 1999;47:196–202 [DOI] [PubMed] [Google Scholar]
- 17.Folstein MF, Folstein SE, McHugh PR. “Mini-mental state.” A practical method for grading the cognitive state of patients for the clinician. J Psychiatr Res 1975;12:189–198 [DOI] [PubMed] [Google Scholar]
- 18.Magni E, Binetti G, Bianchetti A, Rozzini R, Trabucchi M. Mini-mental state examination: a normative study in an Italian elderly population. Eur J Neurol 1996;3:198–202 [DOI] [PubMed] [Google Scholar]
- 19.McKhann G, Drachman D, Folstein MF, Katzman R, Price D, Stadlan EM. Clinical diagnosis of Alzheimer’s disease: report of the NINCDS-ADRDA Work Group. Neurology 1984;34:939–944 [DOI] [PubMed] [Google Scholar]
- 20.Dooneief G, Marder K, Tang MX, Stern Y. The Clinical Dementia Rating scale: community-based validation of “profound” and “terminal” stages. Neurology 1996;46:1746–1749 [DOI] [PubMed] [Google Scholar]
- 21.Saunders AM, Strittmatter WJ, Schmechel D, et al. Association of apolipoprotein E allele ε4 with late-onset familial and sporadic Alzheimer’s disease. Neurology 1993;43:1467–1472 [DOI] [PubMed] [Google Scholar]
- 22.Frisoni GB, Beltramello A, Binetti G, et al. Computed tomography in the detection of the vascular component in dementia. Gerontology 1995;41:121–128 [DOI] [PubMed] [Google Scholar]
- 23.van Swieten JC, Hijdra A, Koudstaal PJ, van Gijn J. Grading white matter lesions on CT and MRI: a simple scale. J Neurol Neurosurg Psychiatry 1990;53:1080–1083 [DOI] [PMC free article] [PubMed] [Google Scholar]
- 24.Binetti G, Magni E, Padovani A, Cappa SF, Bianchetti A, Trabucchi M. Neuropsychological heterogeneity in mild Alzheimer’s disease. Dementia 1993;4:321–326 [DOI] [PubMed] [Google Scholar]
- 25.Metitieri T, Geroldi C, Pezzini A, Frisoni GB, Bianchetti A, Trabucchi M. The ITEL-MMSE: an Italian telephone version of the MMSE. Int J Geriatr Psychiatry 2001;16:167–168 [DOI] [PubMed] [Google Scholar]
- 26.Ferrucci L, Del Lungo I, Guralnik JM, et al. Is the telephone interview for cognitive status a valid alternative in persons who cannot be evaluated by the Mini Mental State Examination? Aging 1998;10:332–338 [DOI] [PubMed] [Google Scholar]
- 27.Frisoni GB, Govoni S, Trabucchi M, Franceschini G. Apolipoprotein E e4 allele and risk of dementia. JAMA 1995;273:375–3767880298 [Google Scholar]
- 28.Dahlbeck SW, McCluney KW, Yeakley JW, Fenstermacher MJ, Bonmati C, Van Horn G. The interuncal distance: a new RM measurement for the hippocampal atrophy in Alzheimer’s disease. AJNR Am J Neuroradiol 1991;12:931–932 [PMC free article] [PubMed] [Google Scholar]
- 29.Barr AN, Heinze WJ, Dobben GD, Valvassori GE, Sugar O. Bicaudate index in computed tomography of Huntington’s disease and cerebral atrophy. Neurology 1978;28:1196–1200 [DOI] [PubMed] [Google Scholar]
- 30.Laakso M, Frisoni GB, Kononen M, et al. Hippocampus and entorhinal cortex in frontotemporal dementia. A qualitative MRI study. Biol Psychiatry 2000;47:1056–1063 [DOI] [PubMed] [Google Scholar]
- 31.Duvernoy HM, ed. The Human Hippocampus. Functional Anatomy, Vascularization and Serial Sections with MRI 2nd ed. Berlin: Springer; 1998
- 32.Free SL, Bergin PS, Fish DR, Cook MJ, Shorvon SD, Stevens JM. Methods for normalization of hippocampal volumes measured with MR. AJNR Am J Neuroradiol 1995;16:637–643 [PMC free article] [PubMed] [Google Scholar]
- 33.Frisoni GB, Laakso MP, Beltramello A, et al. Hippocampal and entorhinal cortex atrophy in frontotemporal dementia and Alzheimer’s disease. Neurology 1999;52:91–100 [DOI] [PubMed] [Google Scholar]
- 34.Frisoni GB, Beltramello A, Geroldi C, Weiss C, Bianchetti A, Trabucchi M. Brain atrophy in frontotemporal dementia. J Neurol Neurosurg Psychiatry 1996;61:157–165 [DOI] [PMC free article] [PubMed] [Google Scholar]
- 35.Geroldi C, Pihlajamaki M, Laakso MP, et al. APOE-ε4 is associated with less frontal and more medial temporal lobe atrophy in AD. Neurology 1999;53:1825–1832 [DOI] [PubMed] [Google Scholar]
- 36.Frisoni GB, Govoni S, Geroldi C, et al. Gene dose of the ε4 allele of apolipoprotein E and disease progression in sporadic late-onset Alzheimer’s disease. Ann Neurol 1995;37:596–604 [DOI] [PubMed] [Google Scholar]
- 37.DeCarli C, Maisog J, Murphy DG, Teichberg D, Rapoport SI, Horwitz B. Method for quantification of brain, ventricular, and subarachnoid CSF volumes from MR images. J Comput Assist Tomogr 1992;16:274–284 [DOI] [PubMed] [Google Scholar]
- 38.DeCarli C, Murphy DGM, Gillette JA, et al. Lack of age-related differences in temporal lobe volume of very healthy adults. AJNR Am J Neuroradiol 1994;15:689–696 [PMC free article] [PubMed] [Google Scholar]
- 39.Laakso MP, Partanen K, Riekkinen P, et al. Hippocampal volumes in Alzheimer’s disease, Parkinson’s disease with and without dementia, and in vascular dementia: an MRI study. Neurology 1996;46:678–681 [DOI] [PubMed] [Google Scholar]
- 40.Insausti R, Juottonen K, Soininen H, et al. MR volumetric analysis of the human entorhinal, perirhinal, and temporopolar cortices. AJNR Am J Neuroradiol 1998;19:659–671 [PMC free article] [PubMed] [Google Scholar]
- 41.Hastie T, Tibshirani R, eds. Generalized Additive Models. London: Chapman & Hall; 1990
- 42.Ebel RL. Estimation of the reliability of ratings. Psychometrika 1951;16:407–424 [Google Scholar]
- 43.Spector PE, ed. Summated Rating Scale Construction: an Introduction (Quantitative Applications in the Social Sciences). London: Sage Publications; 1992
- 44.Frisoni GB, Beltramello A, Bianchetti A, Trabucchi M. Hippocampal atrophy as detected by width of the temporal horn is greater in Alzheimer’s dementia than non-dementing cognitive impairment. AJNR Am J Neuroradiol 1997;18:1192–1193 [PMC free article] [PubMed] [Google Scholar]
- 45.Braak H, Braak E. Morphological criteria for the recognition of Alzheimer’s disease and the distribution pattern of cortical changes related to this disorder. Neurobiol Aging 1994;15:355–356 [DOI] [PubMed] [Google Scholar]
- 46.Bigler ED, Blatter DD, Anderson CV, et al. Hippocampal volume in normal aging and traumatic brain injury. AJNR Am J Neuroradiol 1997;18:11–23 [PMC free article] [PubMed] [Google Scholar]
- 47.Rosler M, Anand R, Cicin-Sain A, et al. Efficacy and safety of rivastigmine in patients with Alzheimer’s disease: international randomised controlled trial. BMJ 1999;318:633–640 [DOI] [PMC free article] [PubMed] [Google Scholar]
- 48.Rogers SL, Farlow MR, Doody RS, Mohs R, Friedhoff LT, for the Donepezil Study Group. A 24-week, double-blind, placebo-controlled trial of donepezil in patients with Alzheimer’s disease. Neurology 1998;50:136–145 [DOI] [PubMed] [Google Scholar]
- 49.Feldman H, Gauthier S, Hecker J, Vellas B, Subbiah P, and the Donepezil MSAD Study Group. Benefits of donepezil on global function, behavior, cognition, and ADLs in patients with moderate-to-severe Alzheimer’s disease (abstr). Neurology 2000;54(Suppl 3):A469 [Google Scholar]
- 50.Cummings J, Anand R, Koumaras B, Hartman R. Rivastigmine provides behavioral benefits to Alzheimer’s disease patients residing in a nursing home: findings from a 26-week trial (abstr). Neurology 2000;54(Suppl 3):A468 [Google Scholar]
- 51.Sano M, Ernesto C, Thomas RG et al., for the members of the Alzheimer’s Disease Cooperative Study. A controlled trial of selegiline, alpha-tocopherol, or both as treatment for Alzheimer’s disease. N Engl J Med 1997;336:1216–1222 [DOI] [PubMed] [Google Scholar]
- 52.Chui H, Zhang Q. Evaluation of dementia: a systematic study of the usefulness of the American Academy of Neurology’s practice parameters. Neurology 1997;49:925–935 [DOI] [PubMed] [Google Scholar]
- 53.Wahlund LO, Julin P, Johansson SE, Scheltens P. Visual rating and volumetry of the medial temporal lobe on magnetic resonance imaging in dementia. A comparative study. J Neurol Neurosurg Psychiatry 2000;69:630–635 [DOI] [PMC free article] [PubMed] [Google Scholar]