

Abstract
BACKGROUND AND PURPOSE: Intravascular and parenchymal enhancement have been detected with contrast-enhanced T1-weighted MR imaging in patients with ischemic stroke. Diffusion-weighted MR imaging depicts infarct within minutes after the onset of symptoms. The aims of this study were to study the different MR enhancement findings during the first week after stroke and to ascertain whether the presence of intravascular enhancement over a larger area than the infarct on diffusion-weighted images on day 1 is able to predict substantial infarct growth during the first week.
METHODS: Forty-eight patients were imaged on the first and second days and again 1 week after the onset of ischemic stroke. T1-weighted spin-echo imaging was performed before and after a 0.2 mmol/kg bolus of gadolinium chelate. Diffusion-weighted imaging was performed at the same slice positions. Enhancement findings were categorized as intravascular and parenchymal, with further categorization of parenchymal enhancement as cortical, subcortical, and deep; these findings were then compared with diffusion-weighted imaging findings.
RESULTS: Intravascular enhancement in the infarcted area was detected on day 1 in 78% of the cases, on day 2 in 78% of the cases, and at 1 week in 30% of the cases. Parenchymal enhancement was detected in 26%, 56%, and 100% of the cases, respectively. Intravascular enhancement over a larger area than the infarct on diffusion-weighted images on day 1 was not associated with the extent of infarct growth.
CONCLUSION: Detection of different patterns of contrast enhancement can help in determining the age of infarct. Parenchymal enhancement may be intense and can cause diagnostic uncertainty in cases in which the clinical history is obscure.
Ischemic stroke is a prominent cause of death and disability in industrialized countries. The acute phase of stroke has been studied intensely, because treatment should be given as soon as possible after the onset of symptoms. In published reports of acute stroke trials, CT has been used to exclude hemorrhage and extensive ischemic changes (1–3). Use of contrast medium with CT in the acute phase of stroke has not generally been useful (4). MR imaging is more sensitive than CT in detecting ischemic changes (5, 6). Moreover, T2-weighted imaging is more sensitive than T1-weighted imaging in detecting ischemic changes, and administration of paramagnetic gadolinium chelates (7) before T1-weighted imaging can provide valuable information (8).
Elster and Moody (9) reported two patterns of MR contrast enhancement in the acute phase of ischemic stroke: intravascular enhancement and meningeal enhancement. After the first few days, there is a well-known phase of parenchymal contrast enhancement caused by leakage of contrast material across the disrupted blood-brain barrier. These sometimes bizarre parenchymal enhancement findings in patients with symptoms not typical of ischemia can be difficult to interpret without knowledge of the different patterns of contrast enhancement within ischemic lesions.
Diffusion- and perfusion-weighted MR imaging techniques have improved our knowledge of acute cerebral ischemia (10, 11). Comparing the findings provided by these new MR imaging methods with those furnished by more conventional ones may help address the question of whether there is a need to perform conventional MR imaging in patients with acute ischemic stroke.
The aims of the present study were to examine the different patterns of contrast enhancement on sequentially performed T1-weighted imaging studies during the first week after onset of stroke and to determine whether infarct growth can be predicted in the acute phase by the presence of intravascular enhancement over a larger area of tissue than that already seen as infarcted on diffusion-weighted images.
Methods
Patients and Study Design
A total of 57 patients (32 men and 25 women; age range, 48–89 years; mean age, 71 years) underwent diffusion- and perfusion-weighted and conventional MR imaging three times during the first week after onset of stroke. The diffusion- and perfusion-weighted imaging findings have been reported previously (12). Informed consent was obtained from the patient or the patient's relatives. The study design was approved by the ethics committee of our institution.
Inclusion criteria were 1) supratentorial ischemic symptoms (hemiparesis/hemiplegia and/or aphasia/dysphasia) no older than 24 hours at the time of the first MR examination, 2) no hemorrhage or other nonischemic explanation for the symptoms detected on CT scans obtained as part of the routine diagnostic workup, and 3) the patient was stable enough to undergo MR imaging safely and had no contraindications to this procedure. The time of onset of symptoms was determined from the best available clinical history.
Nine patients were excluded from the final analysis owing to unsatisfactory quality of the images: in these patients, no interpretable T1-weighted images could be obtained in any imaging session because of patient movement or difficulties in safely obtaining complete imaging studies (enhanced T1-weighted images were obtained last in each MR imaging session). The final study population thus consisted of 48 patients (28 men and 20 women; age range, 48–89 years; mean age, 71 years). No patient underwent thrombolysis, but two patients received intravenous heparinoid.
Imaging
The first MR examination was performed on the day of admission, 10.5 ± 5.7 (mean ± SD) hours after the onset of symptoms; the second MR examination was performed on the next day, 31.9 ± 7.6 hours after the onset of symptoms; and the third MR examination was performed 7 days ± 7.5 hours after the onset of symptoms. All patients were imaged with the same 1.5-T whole-body scanner by using a head coil with standard restraints. Each MR examination included diffusion- and perfusion-weighted sequences and conventional T1-, T2-, and proton density–weighted sequences. Total imaging time was approximately 20 minutes.
Noncontrast and contrast-enhanced T1-weighted images were obtained using the same spin-echo sequence. Nineteen axial slices tilted along the orbitomeatal line covering the whole supratentorial brain were obtained with a slice thickness of 5 mm and an interslice gap of 1.5 mm. Other imaging parameters were 600/14/1 (TR/TE/excitations), 260-mm field of view, 192 × 256 matrix, and a scan time of 1 minute 58 seconds. The images were printed on film and saved on magneto-optic disks.
Noncontrast T1-weighted images were obtained before the perfusion-weighted images. Contrast-enhanced T1-weighted images were obtained after the perfusion-weighted images by using the contrast medium administered for perfusion-weighted imaging. A 0.2 mmol/kg dose of gadopentetate dimeglumine was injected at a speed of 5 mL/s into an antecubital vein by using an MR-compatible power injector (Spectris, Medrad, Pittsburgh, PA). The contrast-enhanced T1-weighted examination was started approximately 3 to 5 minutes after injection of the contrast medium.
Diffusion-weighted imaging was performed with an echo-planar spin-echo technique. Nineteen axial slices identical to those used for T1-weighted imaging were scanned. Imaging parameters were 4000/103, 96 × 128 matrix interpolated to 256 × 256, and an acquisition time of 20 seconds. A T2-weighted reference image (b value = 0 s/mm2) and three diffusion-weighted images with orthogonally applied diffusion gradients (b value = 1000 s/mm2) were collected. To minimize the effects of diffusion anisotropy, trace images (trace of the diffusion tensor) were generated by calculating the average of the three diffusion-weighted images. Volumes of decreased diffusion were measured by drawing regions of interest around the lesions on trace images and then multiplying the lesion area by the slice thickness and interslice gap thickness.
Image Interpretation
Contrast-enhanced T1-weighted images were interpreted independently by a resident in radiology and an experienced neuroradiologist. In the case of disagreement, consensus was reached and recorded. Because the primary aim of the study was to evaluate different patterns of contrast enhancement of true ischemic lesions but not the sensitivity of the imaging method, the interpreters were allowed to be aware of the diffusion-weighted imaging findings. The enhancement findings were categorized as intravascular and parenchymal enhancement. Parenchymal enhancement was further divided into cortical, subcortical, and deep parenchymal patterns, and their presence was recorded. The extent of parenchymal enhancement in each pattern was assessed semiquantitatively as no enhancement, mild enhancement, moderate enhancement, and intense enhancement. To avoid interpreting microhemorrhage, cortical laminar necrosis, or other noncontrast causes of high signal intensity as enhancement, noncontrast T1-weighted images were reviewed at the time of image interpretation. If intravascular enhancement was present on the first day, it was determined whether it covered a larger area than the infarct detected on diffusion-weighted images.
Statistical Analysis
Recorded findings were analyzed by using a statistical software package for personal computers (SPSS PC Win 9.0, Chicago, IL). Frequencies of different patterns of contrast enhancement were calculated. The patients were divided into two groups according to the amount of infarct growth on diffusion-weighted images: patients whose infarcts grew 50% or more during 1 week (group 1) and patients whose infarcts remained stable or grew less than 50% (group 2). A χ2 test was used to determine whether the presence or absence of intravascular enhancement over a larger area of tissue than the infarct detected by diffusion-weighted imaging on the first day predicted the infarct growth by 50% or more. The Mann-Whitney U test was used to identify a possible association between the dichotomized enhancement finding and the final infarct size (not a normally distributed continuous variable).
Results
All patients had lesions with high signal intensity on diffusion-weighted images, which confirmed the presence of infarcted brain tissue. Contrast-enhanced T1-weighted images of satisfactory quality were obtained from 46 patients on the first day, from 45 patients on the second day, and from 44 patients 1 week after stroke. On the first and second days, the reason for failure was that the patient moved or was too unstable to undergo a complete MR imaging examination. At 1 week, two patients had died and two patients refused further imaging.
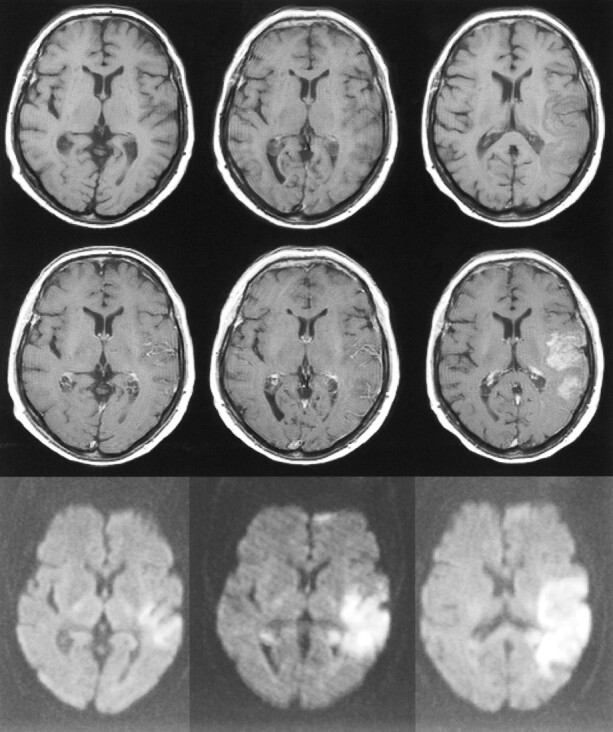
The vascular territory of the ischemic lesion was determined by reviewing diffusion-weighted images. In four patients (8%), there was ischemia only in the territory of deep perforating terminal arteries; in 28 patients (58%), there was ischemia only in cortical and/or subcortical areas; and in 16 cases (33%), ischemia was seen in both deep and cortical/subcortical areas. In 45 cases, ischemia was located in the territory of the middle cerebral artery. In the other three cases, the territory of the posterior cerebral artery was affected. The frequency with which intravascular or parenchymal enhancement was found at the three MR imaging time points is presented in Table 1.
TABLE 1:
Patterns of contrast enhancement during the first week after stroke onset
Intravascular Enhancement
Intravascular enhancement was a relatively common finding on the first and second days (Table 1> and Fig 1). The final infarct size as measured on diffusion-weighted images at 1 week was significantly larger in patients with intravascular enhancement on the first day (mean, 92 cm3; range, 3–380 cm3, n = 33) than in patients without detectable intravascular enhancement (mean, 5 cm3; range, 0.2–23 cm3; n = 10) (P < .001, Mann-Whitney U test). On the first day, in 16 (35%) of 46 cases, intravascular enhancement covered a larger area than that which appeared ischemic on diffusion-weighted images. The presence of intravascular enhancement outside the infarcted core region was not significantly associated with infarct growth of 50% or more (χ2 test). In the four patients who had infarcts only in the territory of deep perforating arteries, no intravascular enhancement was seen.
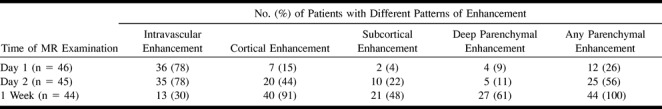
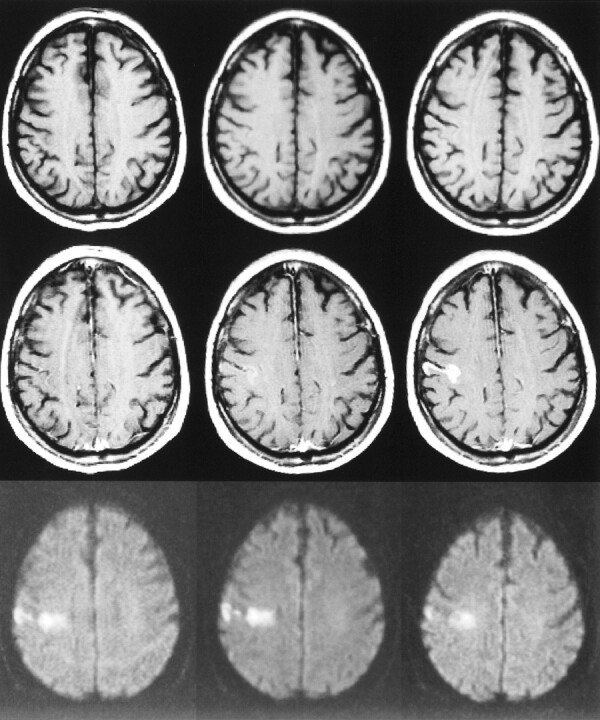
fig 1.
75-year-old woman with dysphasia and weakness in the right arm. The first MR examination (left column) was performed 8 hours after the onset of symptoms, the second MR examination (middle column) was performed on the second day, and the third MR examination (right column) 1 week after stroke. The slice positions are not exactly the same but this does not change the interpretation.
Top row, Unenhanced T1-weighted images (600/14/1) show progressing low signal mass effect of the infarcted tissue.
Middle row, Contrast-enhanced T1-weighted images (600/14/1) show intravascular enhancement over the infarct on the first and second days and moderate cortical and subcortical enhancement 1 week after stroke.
Bottom row, Diffusion-weighted trace images (4000/103/1, in raw image acquisition) show the extent of infarcted tissue as areas of increased signal intensity (bright) in the territory of the left middle cerebral artery.
Parenchymal Enhancement
The frequency with which different patterns of parenchymal enhancement were seen is presented in Table 1. Table 2 shows the different intensity categories (mild, moderate, intense) of parenchymal enhancement in cortical, subcortical, and deep parenchymal structures. Parenchymal enhancement was more frequent at later time points than in the acute phase. At 1 week, all patients showed at least one pattern of parenchymal enhancement. There was no significant difference (Mann-Whitney U test) in final infarct size between patients with at least one form of parenchymal enhancement on the first day (mean, 47 cm3; range, 0.2–111 cm3; n = 10) and patients without any parenchymal enhancement on the first day (mean, 79 cm3; range, 0.5–380 cm3; n = 33). We noted that it really was necessary to obtain unenhanced T1-weighted images to distinguish between contrast enhancement and hemorrhage (Figs 2 and 3) or cortical laminar necrosis (Fig 4).
TABLE 2:
Intensities of parenchymal contrast enhancement during the first week after stroke onset
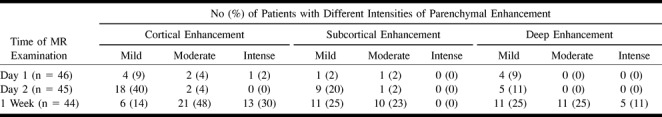
fig 2.
63-year-old woman with right hemiparesis and aphasia. The first MR examination (left column) was performed 6.5 hours after the onset of symptoms, the second MR examination (middle column) was performed on the second day, and the third MR examination (right column) 1 week after stroke.
Top row, Unenhanced T1-weighted images (600/14/1) show progressing low signal mass effect of the infarcted tissue. Hemorrhagic transformation is detected as areas of increased signal intensity on the second day and at 1 week. The gyral pattern of increased signal intensity at 1 week may also represent cortical laminar necrosis.
Middle row, Contrast-enhanced T1-weighted images (600/14/1) show intravascular enhancement over the infarct on the first and second days. Moderate cortical and deep enhancement is detected at 1 week.
Bottom row, Diffusion-weighted trace images (4000/103/1, in raw image acquisition) show the extent of infarcted tissue as areas of increased signal intensity in the territory of the left middle cerebral artery. Hemorrhagic transformation is detected as a dark area due to the susceptibility effect of breakdown products of hemoglobin.
fig 4.
73-year-old man with left hemiparesis. The first MR examination (left column) was performed 23 hours after the onset of symptoms, the second MR examination (middle column) was performed on the second day, and the third MR examination (right column) 1 week after stroke.
Top row, Unenhanced T1-weighted images (600/14/1) are normal on the first and second days, but at 1 week, slightly increased signal intensity is observed in the cortex due to microhemorrhage or cortical laminar necrosis.
Middle row, Contrast-enhanced T1-weighted images (600/14/1) show intravascular enhancement over the infarct on the first day. Mild cortical enhancement is detected on the second day, progressing to intensive cortical enhancement at 1 week.
Bottom row, Diffusion-weighted trace images (4000/103/1, in raw image acquisition) show the extent of infarcted tissue as areas of increased signal intensity in the territory of the right middle cerebral artery.
Discussion
We studied different patterns of contrast enhancement in a prospective series of 48 patients who were imaged repeatedly with the same imaging protocol during the first week after the onset of stroke. Diffusion-weighted imaging was performed in all MR imaging sessions. To our knowledge, there are no previous reports of prospective longitudinal studies combining contrast-enhanced T1-weighted imaging and diffusion-weighted imaging in patients with acute ischemic stroke.
It is generally accepted that intravascular enhancement is caused by decreased blood flow in arteries surrounding the ischemic tissue, resulting in decreased flow void and thus an increased signal from the intravascular contrast material (13–15). The significance of intravascular enhancement has been somewhat questionable, since it has also been observed in the healthy brain (16) and in diseases other than ischemic stroke (17). Nevertheless, intravascular enhancement has been accepted, despite some lack of specificity, as a sign of acute ischemia on conventional MR images. We detected intravascular enhancement in 78% of the patients on the first and second days and in 30% of the patients 1 week after stroke onset, which is in agreement with the results of previous studies (9, 13, 15, 18). Intravascular enhancement was seen more frequently with large infarctions than with small ones. We did not observe intravascular enhancement with infarcts limited to the territories of deep perforating terminal arteries, which is also in agreement with the results of a previous study (19). The presence of intravascular enhancement over a larger area than the infarcted core (on diffusion-weighted images) on the first day did not predict infarct growth.
Parenchymal contrast enhancement is a well-known phenomenon thoroughly studied with CT (4). In CT studies, contrast enhancement has primarily been observed 2 to 4 weeks after stroke, but in some cases contrast enhancement has been detected during the first week (20, 21). In our MR imaging study, we detected different forms of parenchymal enhancement in the acute phase with increasing frequency and intensity throughout the week. At 1 week, all the infarcts showed parenchymal enhancement. Parenchymal enhancement is generally considered to result from breakdown of the blood-brain barrier. In an experimental feline model, parenchymal enhancement was detected 16 to 18 hours after occlusion of the middle cerebral artery (22), whereas in many clinical series, parenchymal enhancement has appeared as late as several days after the onset of stroke. The delay from the possible breakdown of the blood-brain barrier to the observed parenchymal enhancement has been explained as being due to the time needed for angiogenesis in the granulation tissue (23). On the other hand, vasogenic edema diminishes in a few days, which decreases the pressure in tissue and enables its perfusion with contrast-enhanced blood (18, 23). However, in our study, many large infarcts were quite edematous 1 week after stroke onset (Figs 1 and 2).
Enhancement of the ischemic tissue in every fourth stroke patient within 24 hours of the onset of symptoms may be influenced by the double dose of contrast medium we used (0.2 mmol/kg of body weight). In the study by Merten et al (24), the initial 0.1 mmol/kg bolus of contrast material resulted in poorer enhancement than did the subsequent infusion of 0.1 mmol/kg over 2 hours. They speculated that the better enhancement resulting from the repeated administration was due to the infusion rather than to the cumulative dose of 0.2 mmol/kg. They attributed this assumption to the rapid excretion of gadolinium in the urine and the steady-state condition caused by the infusion, which allows greater access of gadolinium into the extracellular space (24). In the study by Imakita et al (25), doses of 0.1 and 0.15 mmol/kg did not result in different amounts of enhancement in cerebral infarcts. On the other hand, Mathews et al (26) studied infarct enhancement with gadoteridol and detected milder enhancement after a 0.1 mmol/kg dose than after a subsequent bolus of 0.2 mmol/kg. In brain tumors, T1 shortening has been found to correlate positively with the dose of contrast medium (27).
We performed T1-weighted imaging, at the earliest, 3 minutes after injection of contrast material for perfusion-weighted imaging, as delayed imaging has been shown to increase the degree of enhancement in ischemia (26). In another study, enhancement was not substantially more intensive 30 minutes after administration of contrast medium than 3 minutes after injection (23). We believe that the dose of 0.2 mmol/kg and beginning the scanning 3 minutes after injection allow sensitive detection of findings consistent with ischemia.
Our results show that infarct enhancement may in some cases be quite intensive and somewhat confounding in configuration (Figs 1 and 3). The present study was not designed to investigate the differential diagnoses in acute ischemic stroke but rather to evaluate the imaging findings in the context of a clear clinical setting of acute stroke. A lesion with high signal intensity on T2-weighted images and contrast enhancement on T1-weighted images may cause diagnostic difficulties in patients with an obscure clinical history. In these situations, diffusion-weighted imaging may be quite useful but not necessarily conclusive, because tumors may also show changes in diffusion. Since it may not always be possible to distinguish with certainty between a tumor and an infarct, it is necessary to be aware of the various enhancement findings in infarcts. In confusing situations, one could try to solve the problem by performing short-term follow-up examinations to look for progression or reduction in the enhancement of the lesion. Yamada et al (28) compared values of apparent diffusion coefficient with findings of contrast enhancement in infarcts 9 hours to 27 days old and concluded by recommending T1-weighted contrast-enhanced imaging in cases in which diffusion-weighted imaging does not confirm the presence of an ischemic lesion. In particular, diffusion-weighted imaging may fail to detect subacute infarcts, because pseudonormalization of the apparent diffusion coefficient can mask the lesion on these images.
Institutions equipped with modern MR scanners may include diffusion- and perfusion-weighted imaging in their radiologic protocols for acute stroke. Unfortunately, however, owing to the expensive gradient technology needed for these techniques, such equipment is not currently available in all institutions in which MR examinations are performed. If these newest imaging methods are not available, conventional MR imaging may be helpful in the setting of acute ischemia. Including noncontrast and contrast-enhanced T1-weighted sequences in the imaging protocol of acute ischemic stroke increases the imaging time by only a few minutes. Even if modern diffusion- and perfusion-weighted techniques are available, obtaining conventional images with contrast enhancement can provide valuable information about the presence and age of the ischemic process in patients with a vague clinical history. Routine administration of contrast medium in an MR imaging session of a patient with acute stroke cannot, however, be considered reasonable. Decisions to use contrast medium should be based on the clinical situation and on the findings on diffusion-weighted and unenhanced conventional MR images.
Conclusion
Detection of intravascular enhancement and different patterns of parenchymal enhancement during the first week after onset of ischemic stroke can help to determine the age of the lesion. The parenchymal enhancement may be intense and, in some cases, may resemble enhancement in tumors and other disease processes, making diagnosis difficult in patients with atypical clinical histories. In these situations, knowledge of the different patterns and temporal evolution of contrast enhancement may help to distinguish an infarct from a nonischemic process. Despite the rapid development of diffusion- and perfusion-weighted MR imaging techniques, contrast-enhanced T1-weighted imaging still has a role in the radiologic workup of patients with acute ischemic stroke.
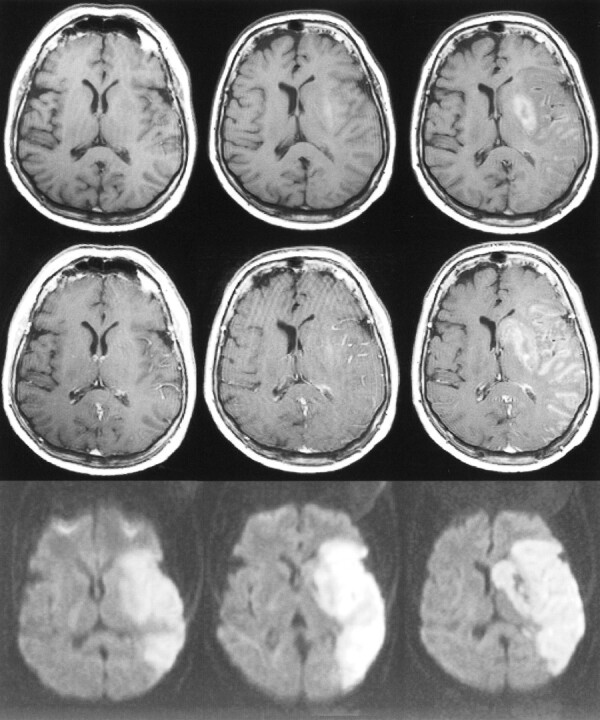
fig 3.
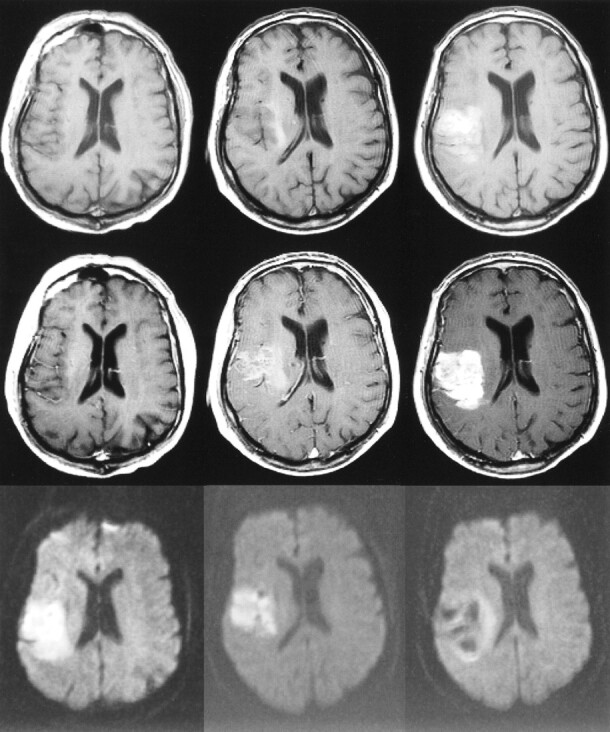
71-year-old man with left hemiparesis. The first MR examination (left column) was performed 15 hours after the onset of symptoms, the second MR examination (middle column) was performed on the second day, and the third MR examination (right column) 1 week after stroke.
Top row, Unenhanced T1-weighted images (600/14/1) show progressing low signal mass effect of the infarcted tissue. Hemorrhagic transformation is detected as areas of increased signal intensity on the second day and at 1 week.
Middle row, Contrast-enhanced T1-weighted images (600/14/1) show intravascular enhancement over the infarct on the first and second days. Moderate cortical and subcortical enhancement are detected on the second day. Intense parenchymal enhancement is detected in the infarct at 1 week.
Bottom row, Diffusion-weighted trace images (4000/103/1, in raw image acquisition) show the extent of infarcted tissue as areas of increased signal intensity in the territory of the right middle cerebral artery. Hemorrhagic transformation is detected as dark areas due to the susceptibility effect of the breakdown products of hemoglobin.
Footnotes
Supported by the Kuopio University Hospital (EVO funding), the Radiological Society of Finland, the Instrumentarium Science Foundation, the Aarne Koskelo Foundation, the Paavo Nurmi Foundation, the Sigrid Juselius Foundation, and the Academy of Finland.
Presented in part at the European Congress of Radiology, Vienna, March 1999.
Address reprint requests to Jari Karonen, MD, Department of Clinical Radiology, Kuopio University Hospital, Box 1777, FIN-70211 Kuopio, Finland.
References
- 1. The National Institute of Neurological Disorders and Stroke rt-PA Stroke Study Group. Tissue plasminogen activator for acute ischemic stroke. N Engl J Med 1995;;333:1581-1587 [DOI] [PubMed] [Google Scholar]
- 2.Hacke W, Kaste M, Fieschi C, et al. Intravenous thrombolysis with recombinant tissue plasminogen activator for acute hemispheric stroke: the European Cooperative Acute Stroke Study (ECASS). JAMA 1995;;274:1017-1025 [PubMed] [Google Scholar]
- 3.Hacke W, Kaste M, Fieschi C, et al. Randomised double-blind placebo-controlled trial of thrombolytic therapy with intravenous alteplase in acute ischaemic stroke (ECASS II): second European-Australasian Acute Stroke Study Investigators. Lancet 1998;;352:1245-1251 [DOI] [PubMed] [Google Scholar]
- 4.Bories J, Derhy S, Chiras J. CT in hemispheric ischemic attacks. Neuroradiology 1985;;27:468-483 [DOI] [PubMed] [Google Scholar]
- 5.Unger EC, Gado MH, Fulling KF, Littlefield JL. Acute cerebral infarction in monkeys: an experimental study using MR imaging. Radiology 1987;;162:789-795 [DOI] [PubMed] [Google Scholar]
- 6.Bryan RN, Levy LM, Whitlow WD, et al. Diagnosis of acute cerebral infarction: comparison of CT and MR imaging. AJNR Am J Neuroradiol 1991;;12:611-620 [PMC free article] [PubMed] [Google Scholar]
- 7.Weinmann HJ, Brasch RC, Press WR, Wesbey GE. Characteristics of gadolinium-DTPA complex: a potential NMR contrast agent. AJR Am J Roentgenol 1984;;142:619-624 [DOI] [PubMed] [Google Scholar]
- 8.Yuh WT, Crain MR, Loes DJ, et al. MR imaging of cerebral ischemia: findings in the first 24 hours. AJNR Am J Neuroradiol 1991;;12:621-629 [PMC free article] [PubMed] [Google Scholar]
- 9.Elster AD, Moody DM. Early cerebral infarction: gadopentetate dimeglumine enhancement. Radiology 1990;;177:627-632 [DOI] [PubMed] [Google Scholar]
- 10.Sorensen AG, Copen WA, Ostergaard L, et al. Hyperacute stroke: simultaneous measurement of relative cerebral blood volume, relative cerebral blood flow and mean transit time. Radiology 1999;;210:519-527 [DOI] [PubMed] [Google Scholar]
- 11.Beaulieu C, de Crespigny A, Tong DC, et al. Longitudinal magnetic resonance imaging study of perfusion and diffusion in stroke: evolution of lesion volume and correlation with clinical outcome. Ann Neurol 1999;;46:568-578 [DOI] [PubMed] [Google Scholar]
- 12.Karonen JO, Vanninen RL, Liu Y, et al. Combined diffusion and perfusion MRI with correlation to single-photon emission CT in acute ischemic stroke: ischemic penumbra predicts infarct growth. Stroke 1999;;30:1583-1590 [DOI] [PubMed] [Google Scholar]
- 13.Sato A, Takahashi S, Soma Y, et al. Cerebral infarction: early detection by means of contrast-enhanced cerebral arteries at MR imaging. Radiology 1991;;178:433-439 [DOI] [PubMed] [Google Scholar]
- 14.Mueller DP, Yuh WT, Fisher DJ, et al. Arterial enhancement in acute cerebral ischemia: clinical and angiographic correlation. AJNR Am J Neuroradiol 1993;;14:661-668 [PMC free article] [PubMed] [Google Scholar]
- 15.Essig M, von Kummer R, Egelhof T, Winter R, Sartor K. Vascular MR contrast enhancement in cerebrovascular disease. AJNR Am J Neuroradiol 1996;;17:887-894 [PMC free article] [PubMed] [Google Scholar]
- 16.Kilgore DP, Breger RK, Daniels DL, et al. Cranial tissues: normal MR appearance after intravenous injection of Gd-DTPA. Radiology 1986;;160:757-761 [DOI] [PubMed] [Google Scholar]
- 17.Bakshi R, Kinkel WR, Bates VE, Mechtler LL, Kinkel PR. The cerebral intravascular enhancement sign is not specific: a contrast-enhanced MRI study. Neuroradiology 1999;;41:80-85 [DOI] [PubMed] [Google Scholar]
- 18.Crain MR, Yuh WT, Greene GM, et al. Cerebral ischemia: evaluation with contrast-enhanced MR imaging. AJNR Am J Neuroradiol 1991;;12:631-639 [PMC free article] [PubMed] [Google Scholar]
- 19.Elster AD. MR contrast enhancement in brainstem and deep cerebral infarction. AJNR Am J Neuroradiol 1991;;12:1127-1132 [PMC free article] [PubMed] [Google Scholar]
- 20.Caille JM, Guibert F, Bidabe AM, Billerey J, Piton J. Enhancement of cerebral infarcts with CT. Comput Tomogr 1980;;4:73-77 [DOI] [PubMed] [Google Scholar]
- 21.Norton GA, Kishore PR, Lin J. CT contrast enhancement in cerebral infarction. AJR Am J Roentgenol 1978;;131:881-885 [DOI] [PubMed] [Google Scholar]
- 22.McNamara MT, Brant-Zawadzki M, Berry I, et al. Acute experimental cerebral ischemia: MR enhancement using Gd-DTPA. Radiology 1986;;158:701-705 [DOI] [PubMed] [Google Scholar]
- 23.Virapongse C, Mancuso A, Quisling R. Human brain infarcts: Gd-DTPA-enhanced MR imaging. Radiology 1986;;161:785-794 [DOI] [PubMed] [Google Scholar]
- 24.Merten CL, Knitelius HO, Assheuer J, et al. MRI of acute cerebral infarcts, increased contrast enhancement with contin[fpuous infusion of gadolinium. Neuroradiology 1999;;41:242-248 [DOI] [PubMed] [Google Scholar]
- 25.Imakita S, Nishimura T, Yamada N, et al. Magnetic resonance imaging of cerebral infarction: time course of Gd-DTPA enhancement and CT comparison. Neuroradiology 1988;;30:372-378 [DOI] [PubMed] [Google Scholar]
- 26.Mathews VP, King JC, Elster AD, Hamilton CA. Cerebral infarction: effects of dose and magnetization transfer saturation at gadolinium-enhanced MR imaging. Radiology 1994;;190:547-552 [DOI] [PubMed] [Google Scholar]
- 27.Aronen HJ, Niemi P, Kwong KK, Pardo FS, Davis TL. The effect of paramagnetic contrast media on T1 relaxation times in brain tumors. Acta Radiol 1998;;39:474-481 [DOI] [PubMed] [Google Scholar]
- 28.Yamada N, Imakita S, Sakuma T. Value of diffusion-weighted imaging and apparent diffusion coefficient in recent cerebral infarctions: a correlative study with contrast-enhanced T1-weighted imaging. AJNR Am J Neuroradiol 1999;;20:193-198 [PMC free article] [PubMed] [Google Scholar]