Abstract
BACKGROUND AND PURPOSE: Many pediatric patients with neurofibromatosis type 1 (NF-1) have an apparent increased thickness of the corpus callosum (CC) on sagittal T1-weighted images compared with patients not affected by NF-1. In this study, we compared the surface area of the CC in children with NF-1 with that of healthy pediatric control subjects to determine if this was another common intracranial manifestation of NF-1.
METHODS: Midsagittal T1-weighted MR images of 43 consecutive children with NF-1 and 43 age- and gender-matched healthy control subjects were reviewed retrospectively. The surface area of the CC and the midsagittal intracranial skull surface (MISS) area were measured five times each on all midsagittal images. A mean CC to mean midline intracranial surface area ratio (CC/MISS) was calculated for each.
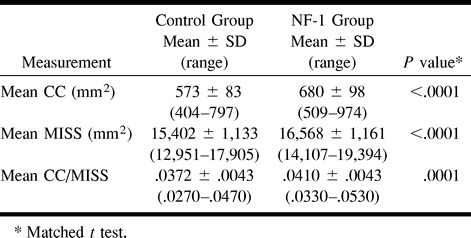
RESULTS: There is a statistically significant increase in the mean CC surface area in pediatric patients with NF-1 (680 mm2 ±98, range 509–974 mm2) compared with control subjects (573 mm2 ± 83, range 404–797 mm2). The mean MISS is significantly increased in patients with NF-1 (16568 mm2 ± 1161, range 14107–19394 mm2 vs 15402 mm2 ± 1133, range 12951–17905 mm2 for control subjects). CC/MISS was also significantly increased in the patients with NF-1 relative to the control subjects (.0410 ± .0043, range .0330–.0530 vs .0372 ± .0043, range .0270–.0470 for control subjects).
CONCLUSION: A larger midsagittal surface area of the CC is another intracranial manifestation of NF-1 that can be demonstrated by sagittal MR imaging. The etiology is unclear, but could be related to abnormal neurofibromin and Ras protein activity. Potential clinical relevance is discussed herein.
Neurofibromatosis Type 1 (NF-1) is a neurocutaneous disorder that results from an abnormality of chromosome 17 and has an incidence in the population of 1/2000 to 1/3000 live births. The NF-1 gene on chromosome 17 encodes for the protein neurofibromin, and abnormalities of this gene result in the production of a nonfunctional protein or absence of its expression (1). This macrocephalic syndrome has many previously described intracranial manifestations, which can be demonstrated with MR imaging. Some of these intracranial manifestations are transient, and some persist through life (2–9). In children, the most commonly described intracranial MR findings include T2 signal abnormalities in the basal ganglia, brain stem, and posterior fossa as well as optic nerve gliomas. The clinical significance of the non-tumor manifestations of the disease is unclear. There has been demonstration of a bimodal distribution of IQ scores, indicating that there are two distinct subsets of children with NF-1, those experiencing cognitive difficulties and those free of them. Attempts at correlating the patients with cognitive deficits and the intracranial abnormalities have mostly centered on the number and location of the non-tumor T2 signal abnormalities, frequently called “UBOs” or unidentified bright objects of neurofibromatosis. The results have not been consistent and therefore remain controversial (10). It therefore remains important to continue the search for other intracranial manifestations that may serve as predictive markers for those children who will have learning disabilities.
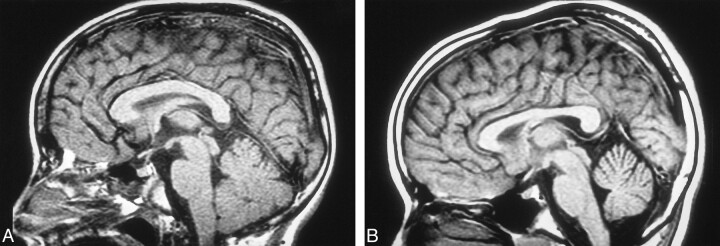
During our MR examinations of patients with NF-1, we observed what appears to be an increase in the size of the corpus callosum (CC) on midsagittal T1-weighted images, perhaps another intracranial manifestation of NF-1 (Fig 1A and B). The purpose of this study was to compare the midsagittal surface area of the CC in a large number of pediatric patients diagnosed with NF-1 with that of age- and gender-matched control subjects.
fig 1.
A, Midsagittal T1-weighted image of a 6-year-old patient with NF-1.
B, Midsagittal T1-weighted image of a 6-year-old control patient.
Methods
Midsagittal T1-weighted MR images of 43 consecutive NF-1 patients and 43 age- and gender-matched control subjects were reviewed retrospectively. Midsagittal CC surface area measurements were obtained from all patients with NF-1, aged 2 to 15 years, who underwent MR imaging at our institution from 1994 to 1998. The primary indication for MR examination was confirmation or follow-up of intracranial disease associated with NF-1. Exclusion criteria included the following: hydrocephalus, seizure disorder, intraxial or extraaxial tumors other than small prechiasmatic and chiasmatic optic nerve gliomas, history of previous or ongoing radiation or chemotherapy, the presence of other disorders that have previously been described as possible factors that alter the size of the CC, and T2 signal abnormalities in the CC. The control population included all patients, aged 2 to 15, who were referred for MR examination and who had a normal neurologic examination and MR findings of the brain. The NF-1 and control populations were matched for age and gender. The age match required that the ages matched within 1 year. The patients with NF-1 and control subjects were not matched for handedness.
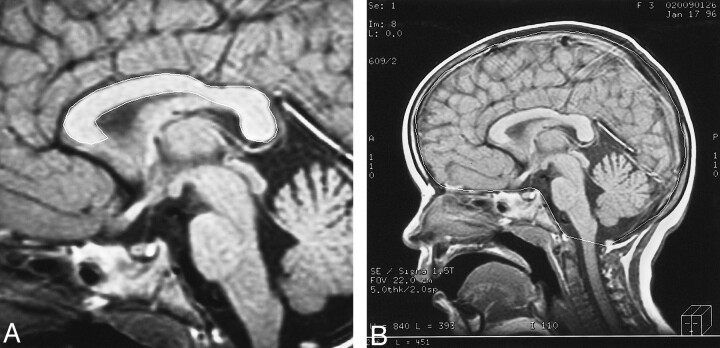
All MR examinations were obtained with a GE Signa Advantage 5X configuration 1.5-T unit. Measurements were obtained from T1-weighted midsagittal spin-echo images (500/10/2 [TR/TE/excitations]) with a 256 × 192 matrix and 5-mm or 3-mm section thickness. The midsagittal image was defined as the image that clearly demonstrated the pituitary infundibulum, the cerebral aqueduct, the pineal gland, and the CC in a single image. All measurements were obtained by freehand outline of the CC on a SUN Microsystems workstation with Advantage Windows software. Required measurements included the following: 1) surface area of the CC; 2) internal skull surface area (MISS) as defined by Laissey et al (11) (Fig 2). Segmental measurements of different areas of the CC were not performed, because the necessary software is not available at our institution. Other midline and paramidline structures such as the anterior commissure or the fornices were not measured. The CC/MISS ratio was calculated for each patient. Each measurement was obtained five times by one of two radiologists (TB, ED). At the time of measurement, the name and clinical status of the patient were not available to the radiologist. Both neuroradiologists obtained measurements on 15 of the same patients and control subjects in order to establish interrater reliability. Interrater reliability determined by Pearson correlation coefficients was r = .9878 for CC measures and r = .9903 for MISS measures. Reliability estimates (internal consistency), computed by use of analysis of variance, of the five measurements obtained on each patient by an individual radiologist for CC and MISS were .9988 and .9999.
fig 2.
A, Midsagittal T1-weighted image of a 3-year-old patient with NF-1. The outer contour of the corpus caliosum has been traced. Note is made of a small chiasmatic glioma.
B, The inner contour of the skull has been traced.
In order to look for trends related to age, the patients were divided into three groups for statistical evaluation: group 1 included patients aged 2 to 4 years; group 2 included patients aged 5 to 10 years; group 3 included patients aged 11 to 15 years. An 11-year-old control pair match of a 10-year-old patient with NF-1 was included in the 11- to 15-year control group for data analysis. Statistical analyses were performed using BMDP Statistical Software, Release & (SPSS Inc., Chicago, IL). Descriptive analysis, matched t tests, and analysis of variance were used, as appropriate. The critical α level for all tests of significance was .05.
Results
Sagittal T1-weighted MR images of 86 patients were reviewed in this study based on the stated criteria for patients with NF-1 and control subjects. Forty-three patients with NF-1 were age- and gender-matched with the control patients. The mean ages of the NF-1 and control populations were 8.9 ± 3.5 years and 9 ± 3.4 years, respectively. There were 19 male (44%) and 24 female (56%) patients in each group. As previously stated, the patients were categorized by age grouping. Seven (16%) patients, aged 2 to 4 years, were in the control and NF-1 groups. In the 5- to 10-year-old age group, there were 22 (51%) patients in the control group and 23 (54%) in the NF-1 group. In the 11- to 15-year-old age group, there were 14 (33%) patients in the control group and 13 (30%) in the NF-1 group.
Using matched t tests, comparisons of CC, MISS measurements, and CC/MISS ratios were made between control and NF-1 populations. The NF-1 group had a significantly greater mean CC surface area than did the control group (680 mm2 ± 98 vs 573 mm2 ± 83; P<.0001). The mean CC was greater in the NF-1 group in 35 of the 43 pairs. The mean difference was approximately 16%. The CC, though larger, maintained a normal shape. The NF-1 group also had a significantly greater mean MISS measurement than did the control group (16568 mm2 ± 1161 vs 15402 mm2 ± 1133; P < .0001). The mean MISS was greater in the NF-1 group in 35 of the 43 pairs. The mean difference was approximately 8%. The CC/MISS ratio was also significantly greater for the NF-1 group (.0410± .0043 vs .0372 ± .0043; P =.0001). The CC/MISS ratio was significantly greater in the NF-1 group in 28 of the 43 pairs. The mean difference was approximately 10% (Table 1).
TABLE 1:
CC and MISS measurements, CC/MISS ratios for control vs NF-1 groups

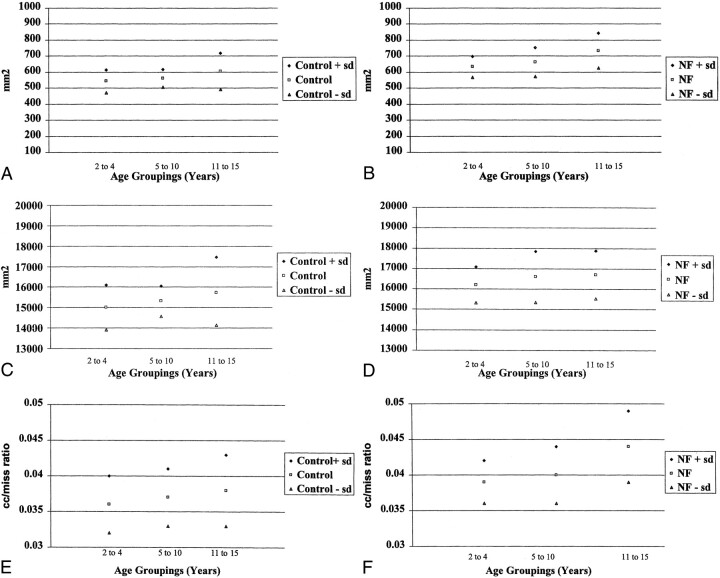
The CC, MISS measurements, and CC/MISS ratio were evaluated for age grouping differences using a one-way analysis of variance. There was a significant gradual increase in the surface area of the CC with age (P=.0269). There were no significant differences between age groups for MISS measurement. Significant CC/MISS ratio differences were found between age groups (P=.0269 [Table 2]).
TABLE 2:
CC and MISS measurements, CC/MISS ratios by age groupings (control and NF-1 patients)

Discussion
The CC is the largest association axonal pathway in the central nervous system. It provides for interhemispheric integration, which is an important function for creativity and intelligence (12). The topography of this structure has been well defined. Fibers from the inferior frontal lobes and inferior parietal lobes cross in the genu. The fibers in the remaining parts of the frontal and parietal lobes cross in the body of the CC. The temporal and occipital lobe fibers cross in the splenium (13). The development of the CC has been described to begin at approximately 8 to 10 weeks of gestation and be complete by approximately 20 weeks of gestation (14–16). The completely formed CC continues to enlarge throughout infancy, childhood, and young adulthood. There is some debate as to when the CC reaches adult size. One large study defined a growth spurt in the first 4 years of life, with slower growth up to the age range of 10 to 12 years when the CC reached adult size (17). Other studies have demonstrated growth up to approximately 15 years, 18 years, and 20 years, respectively (18–20). Our data suggest that growth of the CC continues until at least 15 years of age. There are no well-established standards for the midline sagittal area of the CC in children. Nonetheless, a recent large sample longitudinal pediatric study of healthy subjects demonstrated continued growth from 5 to 18 years of age. In that study, the mean surface area of the midsagittal CC of the 5- to 10-year age group was approximately 575 mm2, and the mean surface area of the midsagittal CC for the 10- to 15-year age group was approximately 615 mm2 (12). These measurements are very similar to those of our control subjects.
Rauch and Jenkins (24) reported up to a 10% difference in the measurement of the surface area of the CC on midsagittal images as a result of variability of placement of the patient in the MR scanner. For this reason we felt that differences that are considered statistically significant should be greater than 10%. Our data indicate that the surface area of the CC is larger in patients with NF-1 relative to age- and gender-matched control subjects with a difference of approximately 16% (Fig 3A and B).
fig 3.
CC and MISS measurements for the control and NF-1 patient populations.
A, Mean CC for control group, by age.
B, Mean CC for NF-1 group, by age.
C, Mean MISS for control group, by age.
D, Mean MISS for NF-1 group, by age.
E, CC/MISS for control group, by age.
F, CC/MISS for NF-1 group, by age.
Approximately 38% of patients with NF-1 are macrocephalic (21). Previous morphologic evaluations of the CC by Rauch and Jenkins (22) and Parashos et al (23) found a significant correlation between callosal size and cerebral size. Because this is a retrospective study, we did not have the opportunity to measure head size. In our study, we tried to account for head size by measuring the MISS. Interestingly, our data do not show a significant difference in the MISS for the different age groups. There is, however, a significant difference between the NF-1 and the control group (Fig 3C and D). This may indicate that, though the MISS is a gross indicator of head size, it is not a good indicator of small changes in head size that occur with normal growth.
The CC/MISS ratio is also increased in the patients with NF-1, indicating that the finding of an increase in the CC surface area is not derived solely on the basis of the macrocephaly of patients with NF-1 (Fig 3E and F). A smaller study of 14 patients with NF-1 and sibling control subjects, published in 1996, also demonstrated an increase in the size of the CC in patients with NF-1, to a degree that was in excess of their macrocephaly. In that study, the sibling control subjects were not matched for age or gender (25).
It should be noted that there was an overlap in the mean surface area of the CC between the control group versus patients with NF-1. Additionally, there was an overlap of the lower ranges of the CC and MISS measurements in the patients with NF-1 with the upper ranges of healthy control patients. The CC is a structure found in all healthy individuals. In the general pediatric population, it is expected that there would be a range of sizes of both the surface area of the CC and the MISS. The important finding derived from our data was that there was a statistically significant upward shift in the mean CC and the MISS in the patients with NF-1. Therefore, we have defined a trend rather than an absolute measurement that can be used to define whether or not a patient has NF-1. It is important to note that a large CC was never an isolated finding in our patients with NF-1. All of the patients in our study demonstrated the characteristic T2 signal abnormalities seen in patients with NF-1.
The etiology of the increased CC size in patients with NF-1 is unclear. This could result from an increase in the size of the axons. The myelin sheaths could be abnormally thickened. Patients with NF-1 are known to have myelin abnormalities, such as vacuolization of the myelin, resulting in T2 signal abnormalities (9). None of the patients with NF-1 in this study, however, had abnormal signal within the CC to suggest the presence of vacuolization. We did not attempt to correlate the presence and number of T2 signal abnormalities in the basal ganglia, brain stem, and posterior fossa with the thickness of the CC. Another potential etiology of the enlarged CC could be an increase in the number of axons. Rhesus monkey studies of the developing CC indicate that axons are eliminated in the CC postnatally by apoptosis through the 6th postnatal month. The number of axons decreases from 188 million present at the time of birth to 56 million, which is the approximate number in the adult monkey brain. The growth and myelination of axons as well as differentiation of glial cells and their processes results in an increase in the midsagittal area of the CC in spite of axonal elimination (26). In the adult human, the total number of axons in the CC is estimated to be approximately 174 to 193 million (27, 28). If a similar process of axonal elimination occurs in humans, a decrease in the apoptotic process in patients with NF-1 could result in increased size of the CC. Neurofibromin, the NF-1 gene product, regulates activation of the Ras pathway (29). It has been recently demonstrated that activated Ras proteins have either beneficial or harmful effects on the regulation of apoptosis, depending on cell type and other factors (30). If not related to lack of axonal dropout, another potential etiology could be that there is abnormal crossing and recrossing of axons across the midline. The roundabout gene controls such behavior of cells in Drosophila. A similar protein has been identified in humans, though its relationship to chromosome 17 is not known. (31)
The clinical significance of the increased area of the CC in patients with NF-1 is unknown. Because the CC provides for interhemispheric integration, a morphologically abnormal CC may provide a potential marker for that population of children with NF-1 who demonstrate cognitive difficulties. It has been recently demonstrated that an increased brain volume in patients with NF-1 is primarily due to an increase in white matter volume (32). Future studies would be necessary to correlate the size of the CC with the volume of white matter in both healthy children and patients with NF-1. The potential relationships between the size of the CC, increased white matter volume in patients with NF-1, and the presence of cognitive deficits has not been explored.
Conclusion
A larger CC surface area is another common intracranial manifestation of NF-1 that can be demonstrated on sagittal MR images. The increase in the surface area is to a degree that is in excess of the macrocephaly that is seen in these patients. In our patient population, this finding was always seen in conjunction with other well-known intracranial manifestations of NF-1. The etiology is unclear but is possibly related to the known abnormalities of neurofibromin, which occur in these patients. The clinical significance of this finding will require further investigation. Perhaps this abnormality should be reviewed as a potential marker for patients with NF-1 who demonstrate cognitive dysfunction.
Footnotes
Presented in part at the annual meeting of the American Society of Neuroradiology, Philadelphia, PA, May 1998.
Address reprint requests to Elizabeth C. Dubovsky, MD, Department of Diagnostic Imaging and Radiology, Children's National Medical Center, 111 Michigan Ave NW, Washington, D.C. 20010-2970.
References
- 1.DiMario FJ, Ramsby GR, Burleson JA. Brain morphometric analysis in neurofibromatosis 1. Arch Neurol 1999;56:1343-1346 [DOI] [PubMed] [Google Scholar]
- 2.Itoh T, Magnaldi S, White RM, et al. Neurofibromatosis type 1: the evolution of deep gray and white matter abnormalities. AJNR Am J Neuroradiol 1994;15:1513-1519 [PMC free article] [PubMed] [Google Scholar]
- 3.Bognanno JR, Edwards MK, Lee TA, Dunn DW, Roos KL, Klatte EC. Cranial MR imaging in neurofibromatosis. AJR Am J Roentgenol 1988;151:381-388 [DOI] [PubMed] [Google Scholar]
- 4.Goldstein SM, Curless RG, Post JD, Quencer RM. A new sign of neurofibromatosis on magnetic resonance imaging of children. Arch Neurol 1989;46:1222-1224 [DOI] [PubMed] [Google Scholar]
- 5.Aoki S, Barkovich JA, Nishimura K, et al. Neurofibromatosis types 1 and 2: cranial MR findings. Radiology 1989;172:527-534 [DOI] [PubMed] [Google Scholar]
- 6.Sevick RJ, Barkovich AJ, Edwards MSB, Koch T, Berg B, Lempert T. Evolution of white matter lesions in neurofibromatosis type 1: MR findings. AJR Am J Roentgenol 1992;159:171-175 [DOI] [PubMed] [Google Scholar]
- 7.Duffner PK, Cohen ME, Seidel FG, Shucard DW. The significance of MRI abnormalities in children with neurofibromatosis. Neurology 1989;39:373-378 [DOI] [PubMed] [Google Scholar]
- 8.Cohen BH, Packer RJ, Braffman B, et al. Neurological and magnetic resonance imaging abnormalities in symptomatic and asymptomatic children with neurofibromatosis type 1: incidence and significance. Ann Neurol 1988;24:306-307 [Google Scholar]
- 9.DiPaolo DP, Zimmerman RA, Rorke LB, Zackai EH, Bilaniuk LT, Yachnis AT. Neurofibromatosis type 1: pathologic substrate of high-signal-intensity foci in the brain. Radiology 1995;195:721-724 [DOI] [PubMed] [Google Scholar]
- 10.Ozonoff S. Cognitive impairmaent in neurofibromatosis type 1. Am J Med Genetics 1999;89:45-52 [PubMed] [Google Scholar]
- 11.Laissy JP, Patrux B, Duchateau C, et al. Midsagittal MR measurements of the corpus callosum in healthy subjects and diseased patients: a prospective survey. AJNR Am J Neuroradiol 1993;14:145-154 [PMC free article] [PubMed] [Google Scholar]
- 12.Giedd JN, Blumenthal J, Jeffries NO, et al. Development of the human corpus callosum during childhood and adolescence: a longitudinal MRI study. Prog Neuro-psychopharmacol & Biol Psychiat 1999;23:571-588 [DOI] [PubMed] [Google Scholar]
- 13.Carpenter MB. Core Text of Neuroanatomy,. 4th ed. Baltimore: Williams & Wilkins;1990:37
- 14.Barkovich JA, Kjos BO. Normal postnatal development of the corpus callosum as demonstrated by MR imaging. AJNR Am J Neuroradiol 1988;9:487-491 [PMC free article] [PubMed] [Google Scholar]
- 15.Barkovich JA, Norman D. Anomalies of the corpus callosum: correlation with further anomalies of the brain. AJR Am J Roentgenol 1988;51:171-179 [DOI] [PubMed] [Google Scholar]
- 16.Rakic P, Yakovlev PI. Development of the corpus callosum and cavi septi in man. J Comp Neurol 1968;132:45-72 [DOI] [PubMed] [Google Scholar]
- 17.Konishi K, Yamashita K, Okumura R, Hamanaka D. Development and aging of brain midline structures: assessment with MR imaging. Radiology 1989;172:171-177 [DOI] [PubMed] [Google Scholar]
- 18.Schaefer GB, Thompson JN, Bodensteiner JB, et al. Quantitative morphometric analysis of brain growth using magnetic resonance imaging. J Child Neurol 1990;5:127-130 [DOI] [PubMed] [Google Scholar]
- 19.Simon JH, Schiffer RB, Rudick RA, Herndon RM. Quantitative determination of MS-induced corpus callosum atrophy in vivo using MR imaging. AJNR Am J Neuroradiol 1987;8:599-604 [PMC free article] [PubMed] [Google Scholar]
- 20.Pujol J, Vendrell P, Junque C, Marti-Vilalta JL, Capdevila A. When does human brain development end? Evidence of corpus callosum growth up to adulthood. Ann Neurol 1993;34:71-75 [DOI] [PubMed] [Google Scholar]
- 21.Dunn DW. Neurofibromatosis in children. Ann Neurol 1988;24:306 [Google Scholar]
- 22.Rauch RA, Jinkins JR. Analysis of cross-sectional area measurements of the corpus callosum adjusted for brain size in male and female subjects from childhood to adulthood. Behav Brain Res 1994;64:65-78 [DOI] [PubMed] [Google Scholar]
- 23.Parashos IA, Wilkinson WE, Coffey CE. Magnetic resonance imaging of the corpus callosum: predictors of size in normal adults. J Neuropsychiatry Clin Neurosci 995;7:35-41 [DOI] [PubMed] [Google Scholar]
- 24.Rauch RA, Jinkins JR. Variability of corpus callosal area measurements from midsagittal MR images: effect of subject placement within the scanner. AJNR Am J Neuroradiol 1996;17:27-28 [PMC free article] [PubMed] [Google Scholar]
- 25.Mott SH, Baumgartner T, Vezina LG, et al. Neurofibromatosis type 1: corpus callosum enlarged beyond megencephaly. Ann Neurol 1996;40:325 [Google Scholar]
- 26.LeMantia AS, Rakic P. Axon overproduction and elimination in the corpus callosum of the developing rhesus monkey. J Neurosci 1990;10:2156-2175 [DOI] [PMC free article] [PubMed] [Google Scholar]
- 27.Tomasch J. Size, distribution and number of fibers in the human corpus callosum. Anat Rec 1954;119:119-135 [DOI] [PubMed] [Google Scholar]
- 28.Zaidel E, Aboitiz F, Clarke J. Sexual dimorphism in interhemispheric relations: anatomicalbehavioral convergence. Biol Res 1995;28:27-43 [PubMed] [Google Scholar]
- 29.Rosenbaum T, Kim HA, Boissy YL, Ling B, Ratner N. Neurofibromin, the neurofibromatosis type 1 Ras-GAP, is required for appropriate P0 expression and myelination. Ann N Y Acad Sci 1999;14:88. [PubMed] [Google Scholar]
- 30.Downward J. Ras signaling and apoptosis. Current Opinion in Genetics and Development 1998;8:49-54 [DOI] [PubMed] [Google Scholar]
- 31.Kidd T, Brose K, Mitchell KJ, et al. Roundabout controls axon crossing of the CNS midline and defines a novel subfamily of evolutionarily conserved guidance receptors. Cell 1998;92:205-215 [DOI] [PubMed] [Google Scholar]
- 32.Said SMA, Yeh TL, Greenwood RS, et al. MR morphometric analysis and neuropsychological function in patients with neurofibromatosis. Neuroreport 1996;7:1941-1944 [DOI] [PubMed] [Google Scholar]


