

Abstract
BACKGROUND AND PURPOSE: Current imaging does not permit quantification of neural injury after traumatic brain injury (TBI) and therefore limits both the development of new treatments and the appropriate counseling of patients concerning prognosis. We evaluated the utility of magnetization transfer ratio (MTR) and proton MR spectroscopy in identifying patients with neuronal injury after TBI.
METHODS: Thirty patients with TBI (21–77 years old; mean age, 42 years; admission Glasgow Coma Scale (GOS) scores 3–15; mean score, 11) were studied on a 1.5-T system with magnetization transfer imaging and MR spectroscopy of the splenium. Magnetization transfer imaging was also performed in the brain stem in all patients, and other areas of the brain were sampled in one patient. The splenium of the corpus callosum and brain stem were studied because these are often affected by diffuse axonal injury. Scans were obtained 2 to 1129 days after injury (median, 41 days). MTR was considered abnormal if it was more than 2 SD below normal. Proton MR spectroscopy was used to calculate the N-acetylaspartate (NAA)/creatine (Cr) ratio. GOS was determined at least 3 months after injury.
RESULTS: In 10 patients with a GOS of 1 to 4, the mean NAA/Cr was 1.24 ± 0.28; two of these patients had abnormal MTR in normal-appearing white matter (NAWM). In 20 patients with a GOS of 5, the mean NAA/Cr was 1.53 ± 0.37 (P < .05); four of these patients had abnormal MTR in NAWM. MTR abnormalities in NAWM were identified in six patients, but these changes did not correlate with GOS or MR spectroscopy changes.
CONCLUSION: MTR and MR spectroscopy can quantify damage after TBI, and NAA levels may be a sensitive indicator of the neuronal damage that results in a worse clinical outcome.
The National Health Interview Survey for 1985–1987 reports that 1,975,000 head injuries occur per year in the United States (1). Of those people seeking medical attention, approximately 373,000 are hospitalized. The approximate distribution of traumatic brain injury (TBI) severity is 80% mild, 10% moderate, and 10% severe (2); however, these categories are based on admission Glasgow Coma Scale scores (GCS) and do not always correlate with outcome. The heterogeneity of TBI has made imaging studies largely unreliable in helping to determine prognosis (3–6). Radiologic variables that correlate with outcome include the presence of blood or subarachnoid hemorrhage on CT scans, intraventricular hemorrhage, edema, midline shift, effacement of the basal cisterns, diffuse axonal injury, and location of lesions on MR images (7–18). Each of these variables relies on an anatomically based radiologic marker to assess functional neuronal injury. Consequently, these variables may correlate with crude outcomes, such as mortality (7–10, 14, 15, 18), but not with more practical measurements of functional outcome (3–5, 16, 17). Some studies have tried to overcome this limitation by combining clinical and radiologic data (7, 9, 11, 14, 15). A different approach has been to evaluate nonanatomic studies as outcome predictors. Single-photon emission CT depicts abnormalities in regional blood flow and lesions not visible on CT or MR studies, and these global blood flow measurements correlate with outcome (19). Holshouser et al (20) used proton MR spectroscopy to examine neonates, infants, and children with brain injury caused by a variety of mechanisms. In this patient population, changes in MR spectroscopy measurements in occipital gray matter correlated with outcome. Choe et al (21) found similar MR spectroscopy changes in adults after TBI when the frontoparietal white matter was studied. In patients with multiple sclerosis (MS), a positive correlation has been identified between the magnetization transfer ratio (MTR) and N-acetylaspartate (NAA) measured by MR spectroscopy in white matter plaques (22, 23). In the present study, we sought to evaluate whether a similar association exists between MTR and proton MR spectroscopy in patients with TBI. We hypothesized that MR spectroscopy and MTR provide complementary functional information that correlates with neurologic outcome in adults with TBI.
Methods
Patients
After obtaining signed consent, as approved by our institutional review board, 30 adult patients (15 men and 15 women; 21–77 years old; mean age, 42 years) with closed TBI underwent MR imaging and MR spectroscopy. Admission GCS scores (24) and mechanisms of injury were obtained from initial hospitalization records. Admission GCS scores ranged from 3 to 15 (mean score, 11). Injury mechanisms included motor vehicle accidents in 16 patients (53%), falls in seven (23%), assaults in four (13%), and bicycle accidents in three (10%). MR imaging was performed 2 to 1129 days after the injury (median, 41 days). Patients' outcomes were assessed at least 3 months after the injury by using the Glasgow Outcome Scale (GOS): 1 = death, 2 = persistent vegetative state, 3 = severe disability (conscious but disabled), 4 = moderate disability (disabled but independent), 5 = good recovery (25). GOS scores ranged from 1 to 5 (median, 5).
MR Studies
All MR imaging and MR spectroscopy studies were performed on a 1.5-T MR scanner equipped with a spectroscopy software package. Conventional MR imaging included sagittal short-TR/TE sequences (650/11), axial spin-echo (3000/30,90) or fast spin-echo (2700/18,85) sequences, and axial multiplanar gradient-recalled echo (750/40; 10° flip angle) sequences. Two neuroradiologists who were blinded to patient outcome reviewed all images.
Magnetization transfer imaging was performed with a 3D gradient-recalled acquisition in the steady state (106/5; 12° flip angle) sequence. One 19-millisecond sinc-shaped off-resonance saturation pulse was used per TR: control images were obtained without the saturation pulse. Imaging parameters were chosen to minimize T1 and T2 weighting. The MTR is defined by the equation
 |
where M0 equals the average signal intensity in the absence of the saturation pulse and Ms equals the average signal intensity in its presence. Images were processed on a Sun Sparc station 330 (Sun Microsystems, Palo Alto, CA) using Interactive Data Language software (Interactive Data Language Systems, Boulder, CO). MTRs were calculated in normal-appearing white matter (NAWM) in areas frequently subject to diffuse axonal injury (the pons within the brain stem and the splenium of the corpus callosum) (Fig 1). Owing to differences in MTRs and NAA levels in gray and white matter, evaluation of the splenium minimizes the effect of partial volume averaging that occurs if a subcortical voxel placed at the gray/white junction is used. MTRs were also obtained in the same areas in healthy control subjects (26), consisting of six men and nine women ranging in age from 26 to 61 years (mean age, 36 years). Regions with MTRs more than 2 SD below MTRs obtained in corresponding areas in the control group were classified as abnormal.
fig 1.

T2-weighted MR image (3000/90/1) at the level of the splenium. Asterisks indicate the regions of sampling for MTR acquisition; the box outlines the voxel for MR spectroscopy acquisition
Spectroscopy was initially performed with axial T2-weighted sequences to prescribe rectangular voxels of the white matter of the splenium that minimized gray matter and CSF contamination. The voxel dimensions routinely used were 9 mm (anterior/posterior) × 25 mm (right/left) × 10 mm (superior/inferior). Voxel locations were chosen by a single investigator to ensure the same location in each subject (Fig 1). The splenium was studied with a stimulated-echo acquisition mode (STEAM) localization technique to minimize contamination. Careful shimming was necessary to minimize line widths of the spectra from this region. Water suppression was achieved by using three chemical shift-selective radio-frequency pulses followed by a dephasing gradient applied to each of the three axes. The sequence parameters were as follows: 2000/31 (TR/TE), 2500 Hz spectral bandwidth, 13.7 milliseconds mixing time, 2048 complex points, eight-step phase cycling, and 128 acquisitions. Gradient shimming on the voxel and optimization of the solvent suppression were performed before the start of the acquisition. The spectral processing was performed with ProNMR (Softpulse Software, Guelph, Ontario, Canada) by using zero-filling to 8K data points, 2 Hz line broadening applied in the time domain, one-dimensional Fourier transformation, and zero-order phase correction. Areas under the peaks were estimated using a Marquardt fitting routine to lorentzian lineshapes in the frequency domain. Peak ratios were then calculated for NAA/creatine (Cr) (Fig 2). NAA/Cr was chosen as the end point because it has been shown to be a more reliable indicator of injury after TBI than NAA/choline (27).
fig 2.

Proton MR spectrum obtained from normal splenium. The NAA/Cr ratio is 1.75. All spectra were acquired using a STEAM sequence (2000/31).
Statistical Analysis
Abnormal MTRs and metabolic ratios in subjects with good outcomes (GOS = 5) were compared with those obtained in subjects with less than a good outcome (GOS = 1–4) using Student's t-test. GOS and GCS were also correlated with the NAA/Cr ratio by using Spearman's rank-order correlation. A P value of less than .05 was considered statistically significant. NAA/Cr ratios were also correlated with the time interval between injury and MR examination for both outcome groups.
Results
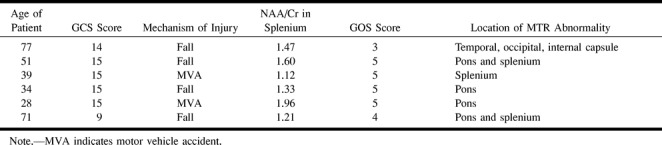
Abnormal MTRs in NAWM of the brain stem or splenium were detected in five patients (Fig 3). An additional patient had abnormally reduced MTR values in the NAWM of the temporal and occipital lobes and the internal capsule. Clinical data pertaining to these patients are summarized in the Table. There was no significant correlation between abnormal MTR and clinical outcomes in this group.
fig 3.

T2-weighted MR images (3000/90/1) at the level of the splenium in two different patients.
A, Despite the normal appearance of the white matter in the splenium (arrows), this patient had an MTR greater than 2 SD below normal values.
B, This patient has typical high signal in the region of the splenium (arrows), considered an indicator of severe diffuse injury.
Patients with abnormal MTR in NAWM
The NAA/Cr ratio in the splenium ranged from 0.80 to 2.33. In the 20 patients with a GOS of 5, the mean (± SD) NAA/Cr was 1.53 ± 0.37. For those with a GOS of 4, the mean NAA/Cr was 1.45 (three patients); for a GOS of 3, the mean NAA/Cr was 1.24 (four patients); and for a GOS of 2, the mean NAA/Cr was 0.98 (two patients). The one patient with a GOS of 1 had an NAA/Cr of 1.15 in the splenium. For the 10 patients with less than good outcomes (GOS = 1–4), the mean (± SD) NAA/Cr was 1.24 ± 0.28, which was significantly lower than that for patients with good outcomes (GOS = 5, P < .05) (Fig 4). Overall, we noted a significant correlation between GOS and NAA/Cr levels in the splenium (Y = 0.142X + 0.819, rs = 0.4378, P < .01, Fig 5). No significant correlation was found between the presence of abnormal MTRs in NAWM and NAA/Cr values nor between GCS and NAA/Cr levels or GCS and MTR changes. In addition, no significant correlation was found when NAA/Cr ratios for both outcome groups were correlated with the time interval between injury and MR examination (Fig 6).
fig 4.

A, Proton MR spectra obtained from the splenium of two patients with head injury. The arrow identifies the methyl resonance of NAA, which is at 2.02 parts per million. The top spectrum was recorded in a patient with an initial GCS of 14 and a GOS of 5 and an NAA/Cr of 1.52. The bottom spectrum shows a lowering in the NAA peak that results in a decreased NAA/Cr ratio of 1.16 in a patient with a GCS of 4 and GOS of 2.
B, T2-weighted MR image (2700/85/1) from patient in top spectrum in A.
C, T2-weighted MR image (2700/80/1) from patient in bottom spectrum in A shows postoperative changes from evacuation of a subdural hematoma and bilateral hygromas.
fig 5.

Relationship between NAA/Cr ratio and GOS score. Spearman's rank-order correlation indicates a significant correlation between NAA/Cr and outcome (Y = 0.142X + 0.819, rs = 0.4378, P < .01).
fig 6.

Relationship between NAA/Cr ratio and time interval from injury to imaging examination in both outcome groups. There was no significant correlation in either group.
Discussion
Important treatment decisions for TBI patients are based on estimates of patient outcome. The Traumatic Coma Data Bank showed that 29% of patients with a postresuscitation GCS of 6 had a good outcome (based on the GOS), 21% died, and the remainder had some degree of disability (28). That a single category of the GCS has such a range of outcomes underscores the rather crude nature of this technique of categorizing TBI. The clinical course of a patient with multiple contusions and a GCS of 6 evolves by different pathophysiological mechanisms than that of a patient with a subdural hematoma, skull fracture, and GCS of 6. In most epidemiologic studies, these two types of injury are grouped together. Only a few studies have compiled data in such a way as to permit a more detailed characterization of this heterogeneous patient population (2, 29). Difficulties predicting outcome also occur in cases of less severe TBI. Rimel et al (30) studied patients with “mild” TBI (GCS = 13–15) and reported that two thirds of these patients had persisting neurobehavioral deficits 3 months after injury and one third of the group was unemployed. Recent epidemiologic studies have also found an association between mild TBI and the development of Alzheimer disease (31, 32), suggesting that neural damage with functional consequences often occurs after mild TBI. Most victims of mild TBI are discharged home with minimal, if any, medical follow-up because their neurologic examinations are normal. Those patients with a persisting cognitive deficit frequently have problems returning to work and reentering into normal family life. Early identification of patients at risk for either cognitive/behavioral deficits after mild TBI or poor/vegetative outcome after more severe TBI will allow an appropriate modification of how these patients are managed.
Numerous pathophysiological mechanisms have been associated with secondary or delayed injury in patients with TBI. Raised intracranial pressure, arterial hypotension, hypoxemia, and pyrexia have all been shown to be independent variables that can cause additional neural injury in the hours and days after injury (33, 34). Current animal studies are being directed at preventing the secondary neuronal damage that occurs from such known mechanisms of injury as excitatory amino acids, apoptosis, ischemia, cytoskeleton destruction, calcium toxicity, free radicals, and mitochondrial dysfunction (35). Determining which patients may benefit from a specific treatment or combination of treatments also depends on early and accurate identification of neuronal damage.
Magnetization Transfer Imaging
Magnetization transfer imaging relies on the principle that protons bound in structures exhibit T1 relaxation coupling with protons in the aqueous phase. When an off-resonance saturation pulse is applied, it selectively saturates those protons that are bound in macromolecules. These protons subsequently exchange longitudinal magnetization with free water protons, leading to a reduction in the detected signal intensity (36).
The MTR may provide a quantitative index of the structural integrity of tissue and has been most often used in areas of demyelination associated with MS (37). Lexa et al (38) studied wallerian degeneration in the feline visual pathway and found that changes in the MTR correlated with histologic changes and occurred before changes seen on T2-weighted images. In the rotational acceleration model of axonal injury in the minipig, Kimura et al (39) and McGowan et al (40) both showed magnetization transfer imaging to be more sensitive than T2-weighted imaging for detecting histologically identified axonal damage. In a study of human TBI, Bagley et al (26) reported abnormal MTR in otherwise NAWM only in patients with persistent neurologic deficits. Although we did not identify a similar trend in the current study, the patient populations are somewhat different. Bagley et al studied a lower percentage of patients with good outcome and did not find any abnormal MTRs in the NAWM of these patients. A GOS of 5 can incorporate a range of functional outcomes that may not be sensitive to lesser amounts of neuronal injury (41). Consequently, it is possible that the MTR abnormalities seen in patients with a GOS of 5 may be characteristic of a subset of patients who have sustained neuronal injury that they have been able to compensate for as they reintegrate into their preinjury activities (42). An additional example of this problem occurs in MS, where there is weak or no correlation between Kurtzke Expanded Disability Status scores and T2 lesion volume or T1-enhanced lesion volume or other such metrics (43, 44). To test functional status better, more detailed neuropsychological tests may be needed. Perhaps the MR measures are more sensitive and specific for TBI than are the current clinical assessments.
Proton MR Spectroscopy
Whereas magnetization transfer imaging provides structural information, MR spectroscopy permits the detection of in vivo neurochemical alterations, such as Cr, choline, myo-inositol, and NAA, in a selected tissue volume. Although glutamate is the only amino acid in the CNS that is more abundant than NAA, the actual role of NAA in the brain is not understood. One proposed function for NAA is that of a brain “osmolyte” (45). Osmolytes are small, nonmetabolizable molecules that would protect the brain-cell volume during recovery from metabolic disturbances of extracellular osmotic pressure (46). NAA can also act as an acetyl group donor to initiate neuronal protein synthesis (47) or lipid synthesis during myelination (48). Regardless of its function, NAA is made exclusively in the mitochondria of neurons and has been shown to be a neuronal marker that decreases in numerous disease processes that have little in common except neuronal loss (49). Examples include spinal cord injury (50), amyotrophic lateral sclerosis (51), Parkinson disease (52, 53), Huntington disease (54), ischemic stroke (55, 56), progressive multifocal leukoencephalopathy (57), epilepsy (58), and MS (23, 59–62). The widespread loss of NAA in patients with MS correlates with the recent documentation of axonal damage throughout the brains of MS patients (63). The dementia associated with Alzheimer disease (64–75), Pick disease (76), and AIDS-related dementia (77) has been correlated with decreases in brain NAA. Cheng et al (76) were able to directly correlate loss in NAA as measured by MR spectroscopy with histologic neuronal loss seen in patients with Pick disease. Direct histochemical measurements of NAA in patients with Alzheimer disease have confirmed the lower levels of NAA that have been observed with MR spectroscopy (78, 79). Despite the more widespread use of NAA as a marker of neuronal loss, there are some reports of patients who have shown reversible decreases in NAA after various brain insults (80, 81). DeStefano et al (80) used their control data from the same group of patients with the systemic diseases evaluated in the study; therefore, the NAA changes noted may be relative rather than absolute alterations.
In models of brain injury in the rat, Rubin et al (82) showed a loss of NAA in the cortex of animals 1 hour after injury, and Signoretti et al (83) showed a decrease within minutes of injury. In a swine model of rotational acceleration injury, Cecil et al (84) also found decreased NAA 1 hour after injury and this change remained stable 1 week after injury. Choe et al (21) used MR spectroscopy to examine 10 patients with head injury and found decreased NAA/Cr. The lower NAA levels were statistically significant relative to those in healthy control subjects, and there was a trend for lower NAA/Cr ratios to correlate with poor clinical outcome (21). Neonates, infants, and children with brain injuries from various mechanisms (infection, hypoxia, trauma, and metabolic disorders) were examined with proton MR spectroscopy by Holshouser et al (20), who found that NAA/Cr ratios in occipital gray matter were significantly lower in infants and children with poor outcomes but not in neonates with poor outcomes. Unfortunately, direct comparison of the data from Choe et al (21) and Holshouser et al (20) with our findings cannot be performed, since those studies sampled NAA/Cr in the left frontoparietal white matter and occipital gray matter, respectively (21). Cecil et al (27) found that in uninjured control subjects, NAA/Cr levels in the splenium are higher than those in hemispheric white matter. In the present study, the splenium was chosen to measure NAA/Cr because of the high prevalence of splenium injuries in patients with TBI (85). Given these differences, the work of Choe et al (21) and Holshouser et al (20) still supports the conclusion that NAA/Cr may be a useful indicator of outcome after TBI. Finally, Cecil et al (27) also showed decreased NAA/Cr in the splenium of head-injured patients relative to that in control subjects. Their data support the ability of MR spectroscopy to identify neuronal injury after TBI; however, no correlation between GCS and NAA/Cr was noted (27).
MR Studies after TBI
A source of error in studying this patient population is the inevitably heterogeneous nature of patient characteristics and injury types. Age has not been controlled for in this study, yet some decrease in NAA has been shown in elderly patients with chronic ischemia (86) and even in normal aging (87, 88). The spectrum of injury mechanisms present in any TBI population dilutes the power of any observations. The pathobiology and outcome after diffuse axonal injuries and focal contusions may contribute to the variability in MTR and MR spectroscopy seen in this and previous studies (89). In addition, the imaging examinations in this study were performed at a wide range of time points after injury. While DeStefano et al (80) suggest that in some disease processes declines in NAA may be reversible, Cecil et al (27) identified no such change in head-injured patients. Although we did not restudy individual patients over time after their injury, evaluation of the distribution of NAA/Cr ratios relative to the timing of the study suggests that no large changes in NAA levels occur during the time intervals in which these patients were examined (Fig 6). Recent evaluation of whole-brain NAA levels in healthy patients has shown that NAA per cubic centimeter of brain is unchanged with aging (90). Thus, it does not seem reasonable that within the interval of this study (up to 3 years) the decrease in NAA can be attributed to anything other than the traumatic incident.
Despite these concerns, our data support a theory that decreases in NAA/Cr as detected by noninvasive MR spectroscopy may be an indicator of neuronal injury and prognosis after TBI. One explanation for this observation is that MR spectroscopy findings can indicate which patients with a poor initial GCS will make a significant recovery. Two patients in our study with an initial GCS of 7 and 10, respectively, both made a moderate recovery, to a GOS of 4. The NAA/Cr in these patients was above the mean of those with a GOS of 5 (ie, 1.57 and 1.58, respectively). Further studies with such patients are indicated to evaluate this phenomenon.
The strength of the correlation between GOS and NAA/Cr does not permit accurate prognostication using only the NAA/Cr ratio in the splenium. The findings of decreased NAA/Cr in the lobar white matter after TBI by Choe et al (21) and Holshouser et al (20), combined with the changes noted in the splenium in the current study, suggest that more detailed measurements of whole-brain NAA may increase the prognostic power of MR spectroscopy in determining outcome. Additional studies may permit the stratification of patients on the basis of age. Finally, the range of NAA/Cr levels noted in patients with good outcomes (GOS = 5) raises the possibility that MR spectroscopy may be an indicator of neuronal injury that is capable of identifying a subset of patients with “good” outcomes who have persistent cognitive deficits that negatively impact their ability to return to their preinjury level of activity. Conceptually, we view NAA as a specific marker of irreversible neuronal loss, whereas MTR may provide a measure of the entire spectrum of histopathology, one end of which is neuronal loss. Evaluation of this hypothesis by further exploration of the ability of quantitative MR studies to obtain early prognostic information noninvasively in patients who have sustained a TBI is warranted.
Conclusion
This study shows that quantitative MR imaging and MR spectroscopy can be reliably obtained in patients with TBI. Proton MR spectroscopy measurement of the NAA/Cr ratio in the splenium may provide additional information that is useful in predicting clinical outcome in these patients. In the 10 patients with less than good outcomes, the NAA/Cr ratio was 1.24 ± 0.28, compared with 1.53 ± 0.37 in the 20 patients with a good neurologic outcome. An abnormal MTR in NAWM was identified in 20% of these patients and did not correlate with outcome or posttraumatic alterations in the NAA/Cr ratio.
Footnotes
Supported in part by grants NS-08803, NS-34353, and RR-02305 from the National Institutes of Health.
Presented in part at the annual meeting of the American Association of Neurological Surgeons, Philadelphia, April 1998.
Address reprint requests to Grant Sinson, MD, Department of Neurosurgery, University of Pennsylvania School of Medicine, 3400 Spruce St, Philadelphia, PA 19104.
References
- 1.Collins JG. Types of injuries by selected characteristics: United States. Vital Health Stat 1990;;10:175. [PubMed] [Google Scholar]
- 2.Kraus JF, McArthur DL, Silverman TA, Jayaraman M. Epidemiology of brain injury. In: Narayan RK, Wilberger JE, Povlishock JT, eds. Neurotrauma. New York: McGraw-Hill 1996;13-30
- 3.Kido DK, Cox C, Hamill RW, Rothenberg BM, Woolf PD. Traumatic brain injuries: predictive usefulness of CT. Radiology 1992;;182:777-781 [DOI] [PubMed] [Google Scholar]
- 4.Kurth SM, Bigler ED, Blatter DD. Neuropsychological outcome and quantitative image analysis of acute haemorrhage in traumatic brain injury: preliminary findings. Brain Inj 1994;;8:489-500 [DOI] [PubMed] [Google Scholar]
- 5.Hanlon RE, Demery JA, Martinovich Z, Kelly JP. Effects of acute injury characteristics on neurophysical status and vocational outcome following mild traumatic brain injury. Brain Inj 1999;;13:873-887 [DOI] [PubMed] [Google Scholar]
- 6.Narayan RK, Greenberg RP, Miller JD, et al. Improved confidence of outcome prediction in severe head injury: a comparative analysis of the clinical examination, multimodality evoked potentials, CT scanning, and intracranial pressure. J Neurosurg 1981;;54:751-762 [DOI] [PubMed] [Google Scholar]
- 7.Ong L, Selladurai BM, Dhillon MK, Atan M, Lye MS. The prognostic value of the Glasgow Coma Scale, hypoxia and computerised tomography in outcome prediction of pediatric head injury. Pediatr Neurosurg 1996;;24:285-291 [DOI] [PubMed] [Google Scholar]
- 8.Gaetani P, Tancioni F, Tartara F, et al. Prognostic value of the amount of post-traumatic subarachnoid haemorrhage in a six month follow up period. J Neurol Neurosurg Psychiatry 1995;;59:635-637 [DOI] [PMC free article] [PubMed] [Google Scholar]
- 9.Fearnside MR, Cook RJ, McDougall P, McNeil RJ. The Westmead Head Injury Project outcome in severe head injury: a comparative analysis of pre-hospital, clinical and CT variables. Br J Neurosurg 1993;;7:267-279 [DOI] [PubMed] [Google Scholar]
- 10.Toutant SM, Klauber MR, Marshall LF, et al. Absent or compressed basal cisterns on first CT scan: ominous predictors of outcome in severe head injury. J Neurosurg 1984;;61:691-694 [DOI] [PubMed] [Google Scholar]
- 11.van Dongen KJ, Braakman R, Gelpke GJ. The prognostic value of computerized tomography in comatose head-injured patients. J Neurosurg 1983;;59:951-957 [DOI] [PubMed] [Google Scholar]
- 12.van der Naalt J, Hew JM, van Zomeren AH, Sluiter WJ, Minderhoud JM. Computed tomography and magnetic resonance imaging in mild to moderate head injury: early and late imaging related to outcome. Ann Neurol 1999;;46:70-78 [DOI] [PubMed] [Google Scholar]
- 13.Lobato RD, Cordobes F, Rivas JJ, et al. Outcome from severe head injury related to the type of intracranial lesion: a computerized tomography study. J Neurosurg 1983;;59:762-774 [DOI] [PubMed] [Google Scholar]
- 14.Signorini DF, Andrews PJ, Jones PA, Wardlaw JM, Miller JD. Predicting survival using simple clinical variables: a case study in traumatic brain injury. J Neurol Neurosurg Psychiatry 1999;;66:20-25 [DOI] [PMC free article] [PubMed] [Google Scholar]
- 15.Wedekind C, Fischbach R, Pakos P, Terhaag D, Klug N. Comparative use of magnetic resonance imaging and electrophysiologic investigation for the prognosis of head injury. J Trauma 1999;;47:44-49 [DOI] [PubMed] [Google Scholar]
- 16.Wilson JT, Wiedmann KD, Hadley DM, Condon B, Teasdale G, Brooks DN. Early and late magnetic resonance imaging and neuropsychological outcome after head injury. J Neurol Neurosurg Psychiatry 1988;;51:391-396 [DOI] [PMC free article] [PubMed] [Google Scholar]
- 17.Wilson JT, Hadley DM, Wiedmann KD, Teasdale GM. Neuropsychological consequences of two patterns of brain damage shown by MRI in survivors of severe head injury. J Neurol Neurosurg Psychiatry 1995;;59:328-331 [DOI] [PMC free article] [PubMed] [Google Scholar]
- 18.Kampfl A, Schmutzhard E, Franz G, et al. Prediction of recovery from post-traumatic vegetative state with cerebral magnetic-resonance imaging. Lancet 1998;;351:1763-1767 [DOI] [PubMed] [Google Scholar]
- 19.Newton MR, Greenwood RJ, Britton KE, et al. A study comparing SPECT with CT and MRI after closed head injury. J Neurol Neurosurg Psychiatry 1992;;55:92-94 [DOI] [PMC free article] [PubMed] [Google Scholar]
- 20.Holshouser BA, Ashwal S, Luh GY, et al. Proton MR spectroscopy after acute central nervous system injury: outcome prediction in neonates, infants, and children. Radiology 1997;;202:487-496 [DOI] [PubMed] [Google Scholar]
- 21.Choe BY, Suh TS, Choi KH, Shinn KS, Park CK, Kang JK. Neuronal dysfunction in patients with closed head injury evaluated by in vivo 1H magnetic resonance spectroscopy. Invest Radiol 1995;;30;:502-506 [DOI] [PubMed] [Google Scholar]
- 22.Hiehle JF, Lenkinski RE, Grossman RI, et al. Correlation of spectroscopy and magnetization transfer imaging in the evaluation of demyelinating lesions and normal appearing white matter in multiple sclerosis. Magn Reson Med 1994;;32:285-293 [DOI] [PubMed] [Google Scholar]
- 23.Kimura H, Grossman RI, Lenkinski RE, Gonzalez-Scarano F. Proton MR spectroscopy and magnetization transfer ratio in multiple sclerosis: correlative findings of active versus irreversible plaque disease. AJNR Am J Neuroradiol 1996;;17:1539-1547 [PMC free article] [PubMed] [Google Scholar]
- 24.Teasdale G, Jennett B. Assessment and prognosis of coma after head injury. Acta Neurochir Suppl (Wien) 1976;;34:45. [DOI] [PubMed] [Google Scholar]
- 25.Jennett B, Bond M. Assessment of outcome after severe brain damage: a practical scale. Lancet 1975;;2:480. [DOI] [PubMed] [Google Scholar]
- 26.Bagley LJ, McGowan JC, Grossman RI, et al. Magnetization transfer imaging of traumatic brain injury. J Magn Reson Imaging 2000;;11:1-8 [DOI] [PubMed] [Google Scholar]
- 27.Cecil KM, Hills EC, Sandel ME, et al. Proton magnetic resonance spectroscopy for detection of axonal injury in the splenium of the corpus callosum of brain-injured patients. J Neurosurg 1998;;88:795-801 [DOI] [PubMed] [Google Scholar]
- 28.Marshall LF, Gautille T, Klauber MR, et al. The outcome of severe closed head injury. J Neurosurg 1991;;75:S28-S36 [Google Scholar]
- 29.Kraus JF, Black MA, Hessol N, et al. The incidence of acute brain injury and serious impairment in a defined population. Am J Epidemiol 1984;;119:186-201 [DOI] [PubMed] [Google Scholar]
- 30.Rimel RW, Giordani B, Barth JT, Boll TJ, Jane JA. Disability caused by minor head injury. Neurosurgery 1981;;9:221-228 [PubMed] [Google Scholar]
- 31.Mayeux R, Ottman R, Tang MX, et al. Genetic susceptibility and head injury as risk factors for Alzheimer's disease among community-dwelling elderly persons and their first-degree relatives. Ann Neurol 1993;;33:494-501 [DOI] [PubMed] [Google Scholar]
- 32.Mayeux R, Ottman R, Maestre G, et al. Synergistic effects of traumatic head injury and apolipoprotein-e4 in patients with Alzheimer's disease. Neurology 1995;;45:555-557 [DOI] [PubMed] [Google Scholar]
- 33.Bullock R, Chesnut RM, Clifton G, et al. Guidelines for the management of severe head injury. J Neurotrauma 1996;;13:639-734 [Google Scholar]
- 34.Miller JD, Piper IR, Jones PA. Pathophysiology of head injury. In: Narayan RK, Wilberger JE, Povlishock JT, eds. Neurotrauma. New York: McGraw-Hill 1996;61-69
- 35.McIntosh TK. The neurochemical sequelae of traumatic brain injury: therapeutic implications. Cerebrovasc Brain Metab Rev 1994;;6:109-162 [PubMed] [Google Scholar]
- 36.Grossman RI, Gomori JM, Ramer KN, Lexa FJ, Schnall MD. Magnetization transfer: theory and clinical applications in neuroradiology. Radiographics 1994;;14:279-290 [DOI] [PubMed] [Google Scholar]
- 37.Dousset V, Grossman RI, Ramer KN. Experimental allergic encephalomyelitis and multiple sclerosis: lesion characterization with magnetization transfer imaging. Radiology 1992;;182:483-491 [DOI] [PubMed] [Google Scholar]
- 38.Lexa FJ, Grossman RI, Rosenquist AC. Wallerian degeneration in feline visual system: characterization with magnetization rate with histopathological correlation. AJNR Am J Neuroradiol 1994;;15:201-212 [PMC free article] [PubMed] [Google Scholar]
- 39.Kimura H, Meaney DF, McGowan JC, et al. Magnetization transfer imaging of diffuse axonal injury following experimental brain injury in the pig: characterization by magnetization transfer ratio with histopathologic correlation. J Comput Assist Tomogr 1996;;20:540-546 [DOI] [PubMed] [Google Scholar]
- 40.McGowan JC, McCormack TM, Grossman RI, et al. Diffuse axonal pathology detected with magnetization transfer imaging following brain injury in the pig. Magn Reson Med 1999;;41:727-733 [DOI] [PubMed] [Google Scholar]
- 41.Hannay HJ, Sherer M. Assessment of outcome from head injury. In: Narayan RK, Wilberger JE, Povlishock JT, eds. Neurotrauma. New York: McGraw-Hill 1996;723-747
- 42.McGowan JC, Yang JH, Plotkin RC, et al. Magnetization transfer imaging in the detection of injury associated with minor head trauma. AJNR Am J Neuroradiol 2000;21:875-880 [PMC free article] [PubMed] [Google Scholar]
- 43.Miki Y, Grossman RI, Udupa JK, et al. Relapsing-remitting multiple sclerosis: longitudinal analysis of MR images: lack of correlation between changes in T2 lesion volume and clinical findings. Radiology 1999;;213:395-399 [DOI] [PubMed] [Google Scholar]
- 44.Fulton JC, Grossman RI, Udupa J, et al. MR lesion load and cognitive function in patients with relapsing-remitting multiple sclerosis. AJNR Am J Neuroradiol 1999;;20:1951-1955 [PMC free article] [PubMed] [Google Scholar]
- 45.Ross BD, Bluml S. New aspects of brain physiology. NMR Biomed 1996;;9:279-296 [DOI] [PubMed] [Google Scholar]
- 46.Lien YH, Shapiro JI, Chan L. Study of brain electrolytes and organic osmolytes during correction of chronic hyponatremia. J Clin Invest 1991;;88:303. [DOI] [PMC free article] [PubMed] [Google Scholar]
- 47.Clarke DD, Greenfield S, Dicker E, Tirri LJ. A relationship of N-acetylaspartate biosynthesis to neuronal protein synthesis. J Neurochem 1975;;24:479-485 [DOI] [PubMed] [Google Scholar]
- 48.Patel TB, Clark JB. Lipogenesis in the brain of suckling rats: studies on the mechanism of mitochondrial/cytosolic carbon transfer. Biochem J 1980;;188:163-168 [DOI] [PMC free article] [PubMed] [Google Scholar]
- 49.Birken DL, Oldendorf WH. N-acetyl-L-aspartic acid: a literature review of a compound prominent in 1H-NMR spectroscopic studies of brain. Neurosci Biobehav Rev 1989;;13:23-31 [DOI] [PubMed] [Google Scholar]
- 50.Falconer JC, Liu SJ, Abbe RA, Narayana PA. Time dependence of N-acetyl-aspartate, lactate, and pyruvate concentrations following spinal cord injury. J Neurochem 1996;;66:717-722 [DOI] [PubMed] [Google Scholar]
- 51.Gredal O, Rosenbaum S, Topp S, Karlsborg M, Strange P, Werdelin L. Quantification of brain metabolites in amyotrophic lateral sclerosis by localized proton magnetic resonance spectroscopy. Neurology 1997;;48:878-881 [DOI] [PubMed] [Google Scholar]
- 52.Federico F, Simone IL, Lucivero V, et al. Proton magnetic resonance spectroscopy in Parkinson's disease and progressive supranuclear palsy. J Neurol Neurosurg Psychiatry 1997;;62:239-242 [DOI] [PMC free article] [PubMed] [Google Scholar]
- 53.Hu MT, Taylor-Robinson SD, Chaudhuri KR, et al. Evidence for cortical dysfunction in clinically non-demented patients with Parkinson's disease: a proton MR spectroscopy study. J Neurol Neurosurg Psychiatry 1999;;67:20-26 [DOI] [PMC free article] [PubMed] [Google Scholar]
- 54.Harms L, Meierkord H, Timm G, Pfeiffer L, Ludolph AC. Decreased N-acetyl-aspartate/choline ratio and increased lactate in the frontal lobe of patients with Huntington's disease: a proton magnetic resonance spectroscopy study. J Neurol Neurosurg Psychiatry 1997;;62:27-30 [DOI] [PMC free article] [PubMed] [Google Scholar]
- 55.Federico F, Simone IL, Conte C, et al. Prognostic significance of metabolic changes detected by proton magnetic resonance spectroscopy in ischaemic stroke. J Neurol 1996;;243:241-247 [DOI] [PubMed] [Google Scholar]
- 56.Gillard JH, Barker PB, vanZijl PC, Bryan RN, Oppenheimer SM. Proton MR spectroscopy in acute middle cerebral artery stroke. AJNR Am J Neuroradiol 1996;;17:873-886 [PMC free article] [PubMed] [Google Scholar]
- 57.Iranzo A, Moreno A, Pujol J, et al. Proton magnetic resonance spectroscopy pattern of progressive multifocal leukoencephalopathy in AIDS. J Neurol Neurosurg Psychiatry 1999;;66:520-523 [DOI] [PMC free article] [PubMed] [Google Scholar]
- 58.Constantinidis I, Malko JA, Peterman SB, et al. Evaluation of 1H magnetic resonance spectroscopic imaging as a diagnostic tool for the lateralization of epileptogenic seizure foci. Br J Radiol 1996;;69:15-24 [DOI] [PubMed] [Google Scholar]
- 59.Gonen O, Catalaa I, Babb J, et al. Total brain N-acetylaspartate: a new measure of disease load in MS. Neurology 2000;54:15-19 [DOI] [PubMed] [Google Scholar]
- 60.Davies SE, Newcombe J, Williams SR, McDonald WI, Clark JB. High resolution proton NMR spectroscopy of multiple sclerosis lesions. J Neurochem 1995;;64:742-748 [DOI] [PubMed] [Google Scholar]
- 61.Fu L, Wolfson C, Worsley KJ, et al. Statistics for investigation of multimodal MR imaging data and an application to multiple sclerosis patients. NMR Biomed 1996;;9:339-346 [DOI] [PubMed] [Google Scholar]
- 62.Matthews PM, Pioro E, Narayanan S, et al. Assessment of lesion pathology in multiple sclerosis using quantitative MRI morphometry and magnetic resonance spectroscopy. Brain 1996;;119:715-722 [DOI] [PubMed] [Google Scholar]
- 63.Trapp BD, Peterson J, Ransohoff RM, Rudick R, Mork S, Bo L. Axonal transection in the lesions of multiple sclerosis. N Engl J Med 1998;;338:278-285 [DOI] [PubMed] [Google Scholar]
- 64.Parnetti L, Tarducci R, Presciutti O, et al. Proton magnetic resonance spectroscopy can differentiate Alzheimer's disease from normal aging. Mech Ageing Dev 1997;;97:9-14 [DOI] [PubMed] [Google Scholar]
- 65.Shiino A, Matsuda M, Morikawa S, Inubushi T, Akiguchi I, Handa J. Proton magnetic resonance spectroscopy with dementia. Surg Neurol 1993;;39:143-147 [DOI] [PubMed] [Google Scholar]
- 66.Heun R, Schlegel S, Graf-Morgenstern M, Tintera J, Gawehn J, Stoeter P. Proton magnetic resonance spectroscopy in dementia of Alzheimer type. Int J Ger Psych 1997;;12:349-358 [DOI] [PubMed] [Google Scholar]
- 67.Klunk WE, Panchalingam K, Moossy J, McClure RJ, Pettegrew JW. N-acetyl-L-aspartate and other amino acid metabolites in Alzheimer's disease brain: a preliminary proton nuclear magnetic resonance study. Neurology 1992;;42:1578-1585 [DOI] [PubMed] [Google Scholar]
- 68.Christiansen P, Schlosser A, Henriksen O. Reduced N-acetylaspartate content in the frontal part of the brain in patients with probable Alzheimer's disease. Magn Reson Imaging 1995;;13:457-462 [DOI] [PubMed] [Google Scholar]
- 69.Shonk TK, Moats RA, Gifford P, et al. Probable Alzheimer's disease: diagnosis with proton MR spectroscopy. Radiology 1995;;195:67-72 [DOI] [PubMed] [Google Scholar]
- 70.Schuff N, Amend DL, Meyerhoff DJ, et al. Alzheimer disease: quantitative H-1 MR spectroscopic imaging of frontoparietal brain. Radiology 1998;;207:91-102 [DOI] [PMC free article] [PubMed] [Google Scholar]
- 71.Rose SE, deZubicaray GI, Wang D, et al. A 1H MRS study of probable Alzheimer's disease and normal aging: implications for longitudinal monitoring of dementia progression. Magn Reson Imaging 1999;;17:291-299 [DOI] [PubMed] [Google Scholar]
- 72.Lazeyras F, Charles HC, Tupler LA, Erickson R, Boyko OB, Krishnan KR. Metabolic brain mapping in Alzheimer's disease using proton magnetic resonance spectroscopy. Psychol Res 1998;;82:95-106 [DOI] [PubMed] [Google Scholar]
- 73.Meyerhoff DJ, MacKay S, Constans JM, et al. Axonal injury and membrane alterations in Alzheimer's disease suggested by in vivo proton magnetic resonance spectroscopic imaging. Ann Neurol 1994;;36:40-47 [DOI] [PubMed] [Google Scholar]
- 74.MacKay S, Meyerhoff DJ, Constans JM, Norman D, Fein G, Weiner MW. Regional gray and white matter metabolite differences in subjects with AD, with subcortical ischemic vascular dementia, and elderly controls with 1H magnetic resonance spectroscopic imaging. Arch Neurol 1996;;53:167-174 [DOI] [PMC free article] [PubMed] [Google Scholar]
- 75.Tedeschi G, Bertolino A, Lundbom N, et al. Cortical and subcortical chemical pathology in Alzheimer's disease as assessed by multislice proton magnetic resonance spectroscopic imaging. Neurology 1996;;47:696-704 [DOI] [PubMed] [Google Scholar]
- 76.Cheng LL, Ma MJ, Becerra L, et al. Quantitative neuropathology by high resolution magic angle spinning proton magnetic resonance spectroscopy. Proc Natl Acad Sci U S A 1997;;94:6408-6413 [DOI] [PMC free article] [PubMed] [Google Scholar]
- 77.Barker PB, Lee RR, McArthur JC. AIDS dementia complex: evaluation with proton MR spectroscopy imaging. Radiology 1995;;195:58-64 [DOI] [PubMed] [Google Scholar]
- 78.Passani LA, Vonsattel JP, Carter RE, Coyle JT. N-acetylaspartylglutamate, N-acetylaspartate, and N-acetylated alpha-linked acidic dipeptidase in human brain and their alterations in Huntington and Alzheimer's diseases. Mol Chem Neuropathol 1997;;31:97-118 [DOI] [PubMed] [Google Scholar]
- 79.Jaarsma D, Veenma-van der Dunin L, Korf J. N-acetylaspartate and N-acetylaspartylglutamate levels in Alzheimer's disease post-mortem brain tissue. J Neurol Sci 1994;;127:230-233 [DOI] [PubMed] [Google Scholar]
- 80.DeStefano N, Matthews PM, Arnold DL. Reversible decreases in N-acetylaspartate after acute brain injury. Magn Reson Med 1995;;34:721-727 [DOI] [PubMed] [Google Scholar]
- 81.Lee JH, Arcinue E, Ross BD. Brief report: organic osmolytes in the brain of an infant with hypernatremia. N Engl J Med 1994;;331:439-442 [DOI] [PubMed] [Google Scholar]
- 82.Rubin Y, Cecil KM, Wehrli S, McIntosh TK, Lenkinski RE, Smith DH. High resolution 1H NMR spectroscopy following experimental brain trauma. J Neurotrauma 1997;;14:441-449 [DOI] [PubMed] [Google Scholar]
- 83.Signoretti S, Vagnozzi R, Lazzarino G, Tavazzi B, DiPierro D, Marmarou A. Reduction of N-acetyl-aspartate is proportional to severity of traumatic brain injury. Presented at the 17th annual National Neurotrauma Symposium, Miami Beach, October 1999
- 84.Cecil KM, Lenkinski RE, Meaney DF, McIntosh TK, Smith DH. High-field proton magnetic resonance spectroscopy of a swine model for axonal injury. J Neurochem 1998;;70:2038-2044 [DOI] [PubMed] [Google Scholar]
- 85.Gentry LR, Thompson B, Godersky JC. Trauma to the corpus callosum: MR features. AJNR Am J Neuroradiol 1988;;9:1129-1138 [PMC free article] [PubMed] [Google Scholar]
- 86.Oppenheimer SM, Bryan RN, Conturo TE, Soher BJ, Preziosi TJ, Barker PB. Proton magnetic resonance spectroscopy and gadolinium-DTPA perfusion imaging of asymptomatic MRI white matter lesions. Magn Reson Med 1995;;33:61-68 [DOI] [PubMed] [Google Scholar]
- 87.Charles HC, Lazeyras F, Krishnan KR, et al. Proton spectroscopy of human brain: effects of age and sex. Prog Neuropsychopharmacol Biol Psychiatry 1994;;18:995-1004 [DOI] [PubMed] [Google Scholar]
- 88.Christiansen P, Toft P, Larsson HB, Stubgaard M, Henriksen O. The concentration of N-acetyl aspartate, creatine + phosphocreatine, and choline in different parts of the brain in adulthood and senium. Magn Reson Imaging 1993;;11:799-806 [DOI] [PubMed] [Google Scholar]
- 89.Alves WM, Eisenberg HM. Head injury trials: past and present. In: Narayan RK, Wilberger JE, Povlishock JT, eds. Neurotrauma. New York: McGraw-Hill; 1996;947-967
- 90.Gonen O, Catalaa I, Babb JS, et al. Total brain N-acetylaspartate: a new measure of disease load in MS. Neurology 2000;;54:15-19 [DOI] [PubMed] [Google Scholar]