

Abstract
BACKGROUND AND PURPOSE: It has been suggested that restricted diffusion is present within hematomas with intact red cell membranes; however, computing apparent diffusion coefficient (ADC) values in areas of low T2 signal can be problematic. Our purpose was to show the pitfalls of measuring diffusion within hematomas with intracellular blood products and to present a framework based on the properties of expected values for computing ADC values from regions with signal intensities close to that of the background noise (ie, T2-dark hematomas).
METHODS: Twelve patients with intracranial hematomas who had undergone diffusion imaging were retrospectively identified during a 2-year period (four intracellular oxyhemoglobin, seven intracellular deoxyhemoglobin, one intracellular methemoglobin). Regions of interest were drawn on the hematomas, the contralateral white matter, and over the background. ADC values were computed using a variety of methods: 1) using expected values incorporating the variance of the background, 2) computing the mean of the regions of interest before taking the natural log, 3) masking negative values, and 4) masking the background at 0.5% increments from 0.5 to 5.5% and including the masked voxels (an intrinsically flawed method). Two-tailed Student's t test was performed between the white matter and the hematoma ADC values.
RESULTS: There was no statistically significant difference between the hematomas and the white matter for methods 1 through 3 (P = .14, P = .23, and P = .83, respectively). Only method 4 revealed a statistically significant difference, beginning at 0.5% masking (P = .04) and becoming progressively more significant with increased masking (P = 4.14 × 10⁻⁷ at 5.5% masking). The effect of masking was limited to the T2-dark hematomas.
CONCLUSION: There is no restriction of diffusion for in vivo hematomas with intracellular blood products. The T2 blackout effect for T2-dark hematomas on diffusion-weighted images should not be interpreted as fast diffusion. The method of expected values can be used to obtain measurements for regions with signal intensities near the background noise. Using literature values for RBC self-diffusion, we computed lower limits of diffusion for hematomas with intracellular blood products to be 0.3 × 10⁻³ mm2/s.
The MR imaging appearance of various stages of hemorrhage has been well documented during the last decade (1–3). With the advent of new imaging sequences, there is the natural tendency to try to categorize, confirm, and extend our understanding of the various stages in the evolution of blood products using this new information. Diffusion imaging is the newest addition to the MR armamentarium. There have been some early reports attempting to distinguish various stages of hemorrhage on the basis of “restricted” diffusion. It has been suggested that restricted diffusion is present within hematomas with intact red cell membranes (intracellular oxyhemoglobin, deoxyhemoglobin, and methemoglobin) (4). T2-dark hematomas have signal intensities very close to the background noise on echo-planar diffusion images. Obtaining accurate diffusion measurements in regions in which the T2 signal is low can be problematic because an individual pixel value may be dominated by the thermal and electronic noise of the imaging system.
We present a framework based on the properties of expected values for computing apparent diffusion coefficient (ADC) values from regions with signal intensities close to that of the background noise (ie, T2-dark hematomas). We show that T2-dark hematomas (with intracellular blood products) have diffusion rates comparable with that of the brain (despite the low signal on the diffusion-weighted images). We further show the problems associated with improper use of background masking, which become especially evident in regions returning signal intensities in the range of the background noise. We show that ADC measurements in these regions can be strongly influenced by postprocessing methods.
Methods
Between August 1997 and July 1999, all clinical cases at our institution included diffusion imaging. Using a web-based DECrad (IDX Systems Corp., Burlington, VT) report search feature developed at our institution, we retrospectively identified patients who had intracranial hematomas during that period and had undergone diffusion imaging. Patients with hematomas smaller than 2 cm were excluded, as were patients with cerebral infarctions. Subjects were selected on the basis of conventional imaging findings indicative of intracellular blood products. A total of 12 subjects who fit this requirement were identified. All hematomas were predominantly within the white matter. A neuroradiologist further grouped subjects as individuals with either T2-dark (seven intracellular deoxyhemoglobin and one intracellular methemoglobin) or T2-bright (four intracellular oxyhemoglobin) hematomas. Because hematomas usually have a combination of blood products, this grouping was done on the basis of the major constituent determined from the signal intensities on the T1- and T2-weighted images. However, all of the hematomas had imaging characteristics of purely intracellular blood products. All imaging was performed on a 1.5-T clinical imager (Signa; GE Medical Systems, Milwaukee, WI), equipped with an Echospeed gradient system for echo-planar imaging. Imaging consisted of a sagittal T1-weighted localizer and then fast spin-echo T2-weighted (4000/85 [TR/TE]) and fluid-attenuated inversion recovery (11000/140; inversion time, 2200 ms) sequences. Diffusion-weighted imaging was performed using a spin-echo echo-planar sequence (10000/125; field of view, 24; matrix, 128 × 128; b value, 1000 s/mm2; number of directions, three). The diffusion gradients were applied sequentially in three orthogonal directions to generate three sets of axial diffusion-weighted images (Sx, Sy, and Sz), in addition to a baseline image (S0), with no diffusion gradients. The diffusion images were transferred to a workstation for off-line processing using software developed in IDL (Research Systems Inc., Boulder, CO). Isotropic diffusion-weighted images were calculated using the following relationship.
 |
Diffusion trace maps were computed from the isotropic diffusion image and the baseline image on a pixel-by-pixel basis by using the following relationship:
 |
where S is the isotropic diffusion-weighted signal, S0 is the baseline signal intensity without diffusion gradients, D is the average trace, and b is the gradient attenuation factor. The images were not masked for background noise. Regions of interest (ROI) were drawn on the S0 images directly on the portions of the hematomas corresponding to intracellular blood products. The ROI were placed to encompass as much of the T2-dark or T2-bright areas as possible. ROI were also drawn on areas of uninvolved white matter from the contralateral hemisphere and from a large region in the background of the image, well outside the brain. The ROI were saved as binary masks and were used to generate data, using a variety of methods as described below. Method 1 describes the framework of expected values. The remaining methods were chosen to be representative of postprocessing algorithms, which are likely to be commonly in use for generating ADC values.
Method 1: Expected Values
This method is intended as the reference standard with which the other methods will be compared. MR images are magnitude images representing the absolute value of the real component after Fourier transformation of the raw data. For most cases, use of the absolute value is not a problem, because the signal from the brain is so robust. However, when signal intensities are close to the background noise, the true mean signal intensity for an ROI cannot be obtained by taking the average signal directly from the magnitude image (5). This is most easily shown by noting that the average signal of a background region on a magnitude image is always greater than 0. Because the noise is white (6), the true mean of the background noise in the complex image away from artifactual ghosts is 0. Furthermore, the SD of the magnitude of the complex pixel values is constant across the image. This property may be taken into account to obtain a true mean signal intensity from a T2-dark hematoma. This problem can be addressed by using the squares of the signal intensities in the framework of expected values. The variance for any random variable X (7) can be expressed as follows:
 |
so that E(X) = sqrt[E(X2) − Var(X)].
For complex random variables, the same relations hold true when we substitute the hermitian symmetric product (eg, X • X*) for a squared quantity (eg, X2). For noise pixels, E(Xnoise) = 0, and so Var(Xnoise) = E(X2noise), and, considering our assumption of white noise across the image, Var(Xsignal) = Var(Xnoise) = E(X2noise). For pixels with non-zero signal, the magnitude μ = | E(X) | therefore satisfies the following equation.
 |
The variance for each case was obtained using the average of the squared pixel values from a large background ROI. Note that to maintain independence, it is important to square the values before taking the average. The mean ROI for each hematoma was obtained using equation 4, with the variance computed from the background ROI as a measure of the noise. This procedure was repeated separately for the S0 image and for the diffusion-weighted images. Trace ADC values were computed by substituting these mean values into equation 2. The same procedure was used for the white matter ROI. Statistical analysis was conducted using a two-tailed t test between the hematomas and the white matter regions, assuming equal variances.
Method 2: Mean ROI
This method is most comparable with obtaining ROI from the imager console. The ROI were applied to the S0 image and the isotropic diffusion image separately. These values were averaged and then used in computing the mean trace for the ROI by using equation 2. Using this method, all points were included in the computation. Statistical analysis was conducted using a two-tailed t test between the hematomas and the white matter regions assuming equal variances.
Method 3: Negative Masked Diffusion Trace Maps
This is an intrinsically flawed method conceptually similar to method 4, that follows, but partially corrected by proper elimination of thresholded values. This method is included because it is likely to be implemented by software routines written “in house.” Computation of the trace requires taking the negative of the natural log of the ratio of the isotropic diffusion image and the baseline images (S and S0, respectively, in equation 2). Points at which the signal intensity increases on the isotropic diffusion image will return negative trace values. This will occur for some voxels in which the signal is at the level of the background because of random variations in noise. Including these voxels will tend to lower the true ADC value artifactually. The ROI were applied to the computed trace maps to generate mean ADC and SD for each region. Values of less than or equal to 0 in the trace maps were excluded from the computation of the mean ROI. Statistical analysis was conducted using a two-tailed t test between the hematomas and the white matter regions, assuming unequal variances (because negative values were masked out on the trace values for the hematomas).
Method 4: Background Masking and Including the Masked Voxels
This is a flawed method of data processing, which we included to show its effect on trace values for T2-dark hematomas. It is a method that provides statistics similar to those reported elsewhere (4) and results virtually identical to those of a widely used commercial software package (FuncTool, GE Medical Systems). A series of binary mask images with background values set to 0 was generated on the basis of the baseline image (0.5% to 5.5% masking at 0.5% increments). Trace maps were first computed, without masking, using equation 2 with the baseline and diffusion-weighted images. The masks were then applied to the trace maps, and the ROI were applied to the masked trace maps to generate mean ADC and SD for each region. Masked values of 0 in the trace maps were included in the computation of the mean ROI. Mean ADC values were computed separately for the T2-dark and T2-bright hematomas and were plotted as a function of percent masking. Statistical analysis was conducted between the hematomas and the white matter regions for each level of masking by using a two-tailed t test and assuming different variances because the masking would affect white matter regions and hematoma regions differently.
Statistical Analysis
Additional statistical analysis was performed using a two-tailed t test for white matter regions between each method of analysis. Two-tailed Student's t test was performed for hematoma trace measurements between methods 1 and 2 and for methods 1 and 3. Linear regression was performed to compare methods 2, 3, and 4 versus method 1.
Results
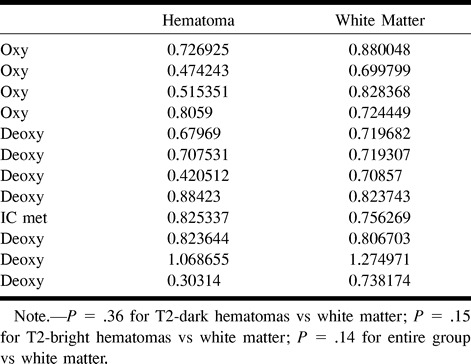
The T1-weighted, T2-weighted, and isotropic diffusion-weighted images for several representative hematomas are presented in Figures 1 through 3. Case 1 shows blood products consistent with hyperacute blood (intracellular oxyhemoglobin). The images show isointense signal intensity on T1-weighted images, with corresponding high signal intensity on the T2-weighted images. Case 2 shows acute blood (mostly intracellular deoxyhemoglobin, isointense on T1-weighted images, and T2-dark). Case 3 shows early subacute blood (intracellular methemoglobin, T1-bright, T2-dark). The isotropic diffusion-weighted images for all the T2-dark hematomas showed low signal intensity (which would intuitively be expected to correspond to “fast” diffusion). Table 1 lists the trace ADC values for all the hematomas obtained using the method of expected values. There was no significant difference in the mean between T2-dark hematomas (mean = 0.73881 × 10⁻³ mm2/s, SD = 0.22) and contralateral white matter regions (mean = 0.829892, SD = 0.20, P = .36). Similarly, there was no significant difference between T2-bright hematomas (mean = 0.631, SD = 0.14) and the contralateral white matter (mean = 0.783, SD = 0.093, P = .15) or between the entire group of hematomas and the contralateral white matter (P = .14). There was no significant difference between the T2-dark and the T2-bright hematomas (P = .26).

fig 1. T2-bright left temporal hyperacute hematoma (intracellular oxyhemoglobin).
A, Axial T1-weighted image (600/20/1) (left) shows isointense blood products. Axial fast spin-echo T2-weighted image (4000/85/1) (middle) shows high signal intensity. Diffusion-weighted isotropic image (10000/125/1) (right) shows increased signal relative to the brain.
B, Trace ADC map displayed without background masking (left) shows hematoma to have diffusion rates comparable with the brain. Trace ADC map displayed with 2% background masking (right) shows similar appearance for this T2-bright hematoma.
TABLE 1:
Trace ADC values computed using method of expected values (10−3 mm2/s)
Using method 2 (mean ROI before computing natural log), there was also no significant difference in the means between either T2-dark (P = .51) or T2-bright (P = .12) hematomas and the contralateral white matter or between the entire group of hematomas and the contralateral white matter (P = .23). Table 2 lists the trace ADC values for all the hematomas obtained using method 2. Again, there was no significant difference in the means for the hematomas between method 2 and method 1 (P = .92). Figure 4 shows the close correspondence between methods 2 and method 1 (intercept = −0.13, slope = 1.2, R2 = 0.98, standard error = 0.038). Method 2 tended to underestimate the ADC values slightly at values below 0.7 × 10⁻³ mm2/s (Fig 4).
TABLE 2:
Trace ADC values computed using method 2 (mean ROI [10−3 mm2/s])
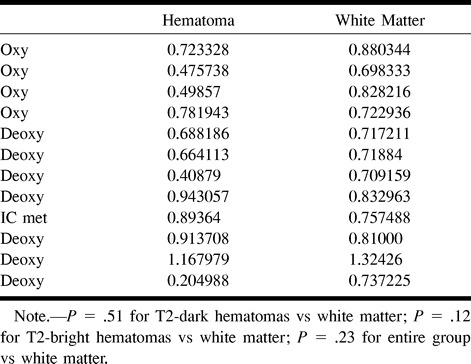
fig 4.

Plot of average ADC of hematomas for method 1 (expected values) versus methods 2, 3, and 4 (at 2% masking) with line fits. A nearly perfect correspondence is shown between ADC values computed using method 1 and method 2 (mean ROI) (intercept = −0.13, slope = 1.2, R2 = 0.98, standard error = 0.038). Although method 3 (negative masked voxels) shows a slope close to identity, the fit is not as good as for method 2 (intercept = 0.056, slope = 0.98, R2 = 0.71, standard error = 0.144). Method 4 shows a poor correspondence with method 1 (intercept = −0.076, slope = 0.759, R2 = 0.36, standard error = 0.233), most notably at the lower ADC values
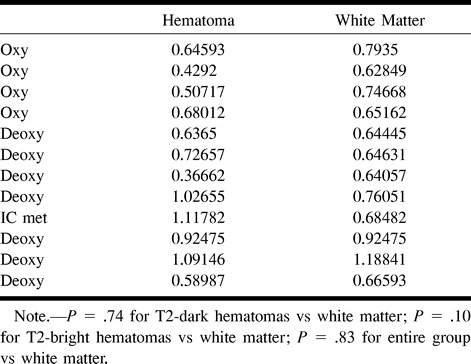
Using method 3 (masking for negative ADC values), there again was no significant difference in the mean between either T2-dark (P = .74) or T2-bright (P = .10) hematomas and the contralateral white matter or between the entire group of hematomas and the contralateral white matter (P = .83). Table 3 lists the trace ADC values for all the hematomas obtained using method 3. There was no significant difference in the mean for the hematomas between method 3 and method 1 (P = .67). Plotting method 3 versus method 1 provides a slope close to identity (intercept = 0.056, slope = 0.98, R2 = 0.71, standard error = 0.144), but the quality of fit is worse than that for method 2 (Fig 4).
TABLE 3:
Trace ADC values computed using method 3 (negative masked images [10−3 mm2/s])
Using method 4 (masking at progressive thresholds), there was a significant difference shown between T2-dark hematomas and contralateral white matter beginning at 1.5% masking (P = .019), which became progressively more significant (P = 4.2 × 10⁻⁶ at 5.5%). Table 4 lists the trace ADC values for all the hematomas obtained using method 4 at progressive levels of masking. An opposite trend was observed for T2-bright hematomas (P = .03 at 0.5% to P = .09 at 5.5%). For the entire group of hematomas compared with the contralateral white matter, the P values ranged from P = .04 at .5% masking to P = 4.14 × 10⁻⁷ at 5.5% masking. The mean and SD of method 4 at 2% background masking (mean = 0.444 × 10⁻³ mm2/s and SD = 0.278) compared well with previously published results (4). Compared with the contralateral brain, this method of analysis would imply restricted diffusion (relative to the brain) for these hematomas. The effect of thresholding on the ADC value can be seen in Figure 5, in which average ADC is plotted against percent background masking. For the T2-dark hematomas, a dramatic decrease in ADC values is evident, as more of masked voxels (with values of 0) are included in the computation. For the T2-bright hematomas, there is only a small decrease in ADC values across the range of masking values. Panels B of Figures 1 through 3 show the effect of masking on the ADC maps for some representative cases. For the T2-dark hematomas, background masking can be seen to remove a significant number of voxels from the hematoma. Figure 4 shows the poor correspondence between method 4 (plotted at 2% background masking) and method 1 (intercept = −0.076, slope = 0.759, R2 = 0.36, standard error = 0.233). The correspondence notably deteriorates at the lower ADC values.
TABLE 4:
Trace ADC values for hematomas using method 4 (progressive masking [10−3 mm2/s])*
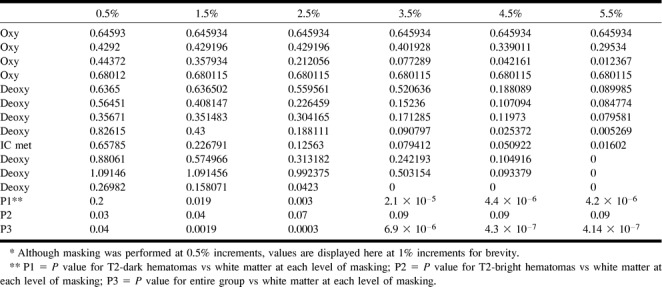
fig 5.

Average ADC plotted against percent background masking. For the T2-dark hematomas, a dramatic decrease in ADC values is evident as more of the masked voxels (with values of 0) are included in the computation. For the T2-bright hematomas, there is only a small decrease in ADC values across the range of masking values. There is no variation in the ADC of white matter values, which shows that background masking becomes an issue only with areas of very low T2 signal
Discussion
On diffusion-weighted images, fast diffusion is low in signal and restricted diffusion (as in acute infarcts) shows high signal. However, because there is a contribution from the baseline image to the diffusion-weighted image, all areas of high signal intensity do not represent slow diffusion. This effect has been termed T2 shine-through. Diffusion-weighted images of T2-dark hematomas show very low signal intensity (similar to or lower than that for CSF), implying very fast diffusion rates. However, this is not confirmed on the trace maps, on which the diffusion rates are clearly much slower than for CSF. We propose that this T2-blackout effect represents the corollary of the T2-shine-through effect. T2-dark hematomas have very low signal intensity, often at the level of the background noise. These background level voxels will show low signal on the diffusion-weighted images as well, but this does not represent fast diffusion. Rather, they are dark on diffusion-weighted images because there is very little signal returning from these regions. The clinical intuitions derived from T2-weighted imaging in which contrast changes depending on whether membranes are intact or lysed cannot be extended to diffusion MR imaging.
Obtaining accurate diffusion trace measurements is complicated in that T2-dark hematomas have signal intensities in the range of the background. For the most part, this is not an issue in routine neuroimaging when the magnitude of the pixel value is far above noise levels. However, in the case of hematomas with intracellular blood products (other than oxyhemoglobin), this becomes a very significant issue. Specifically, the echo-planar T2 signal intensity of deoxyhemoglobin and intracellular methemoglobin is extremely low. In many cases, it is at the level of the background noise, meaning that the average signal returning from these regions is less than the SD of the complex pixel noise. With the application of diffusion gradients, any tissue should drop its signal intensity relative to the baseline image. In the presence of background variations, however, it is possible for a background pixel to show a higher magnitude of signal intensity on the diffusion image than on the baseline image, producing a negative ADC value (which is nonsensical and a violation of the second law of thermodynamics). To remove these nonphysical pixels, it is tempting to use masking to exclude them from generation of the trace image. However, for T2-dark hematomas, we have shown that even low levels of masking (0.5%) can introduce masked voxels into the hematoma. This is graphically shown in Figure 5. There is a dramatic decrease in ADC values for T2-dark hematomas with progressive amounts of masking and inclusion of the masked voxels within the analysis.
We present a variety of potential methods for computing ADC values in areas of low T2 signal. The only conceptually accurate method is that of using the framework of expected values. Method 2 (mean ROI) is flawed because it cannot obtain the true mean in areas of low T2 signal. In the presence of noise and low signal-to-noise ratios, the probability distribution of magnitude MR images is no longer gaussian. Rather, the probability distribution is characterized by a Rice-Nakagami function, and finally, by a Rayleigh distribution in the limit of zero signal. Method 3 (masking of negative ADC values) is intrinsically flawed because it excludes pixels that can contribute to the mean. Even a pixel with a magnitude that is within the noise envelope could contribute signal to a properly constructed expected value. Arbitrarily thresholding such pixels ignores contributions from some regions of the distribution of the random pixel noise. Method 4 (background masking and including the masked voxels) is flawed for two reasons: 1) similarly to method 3, it arbitrarily excludes contributions from regions of the random pixel noise distribution, and 2) it artificially increases the denominator of the calculation by including masked voxels. These severe flaws in method 4 result in the observation of restricted diffusion within the hematomas.
Background masking is a commonly used data processing strategy to reduce computational load by limiting the voxels entering into an analysis. This can also improve the aesthetics of an image by removing signal from voxels outside the brain. Although we performed our ADC analyses offline, MR manufacturers do provide tools for performing ADC computations online or at the imaging console. These commercial algorithms provide user-definable amounts of masking to remove background pixels. FuncTool, for example, is a postprocessing package that can generate ADC maps from diffusion images. However, the algorithm within FuncTool also will include masked voxels in the reporting of a mean value from an ROI. Thus, artificially low estimates for diffusion trace values can be obtained in any areas that have signal intensities in the range of the background (hematomas, hemorrhagic strokes) and in which background masking was used.
We present a framework using the properties of expected values to obtain accurate measurements for regions that have signal intensities near the background range. The major assumptions of this method are that the noise is normally distributed with a mean of 0 (before taking the magnitude) and that the variance is constant across the image. We show close agreement between this method and that using the means of the regions directly (without any masking). We have shown that there is no evidence for restricted diffusion within T2-dark hematomas. This finding is further supported by previous in vitro work in this area.
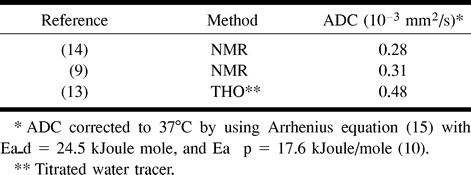
Nuclear MR diffusion measurement methods have been applied to the study of the self-diffusion of water in tissues for many years. RBC preparations have been among the most convenient and consequently the earliest studied (8−14). These studies have been complemented by diffusion with tracer methods. Many of these diffusion measurements were obtained using packed RBC preparations. Because these preparations had had their extracellular fluid removed, the measurements provided a lower limit for diffusion in hematomas with intact cell membranes. Table 5 provides ADC values from the literature for packed RBC preparations. The average ADC of 0.3 × 10⁻³ mm2/s for nuclear MR measurements from Table 5 constitutes a lower limit on the value of the ADC that may be observed in hematomas with intracellular blood products. The actual observed ADC values may be expected to vary above this lower limit, depending on the fractional extracellular fluid volume of the hematoma.
TABLE 5:
Reported values for ADC in human packed RBCs recomputed for body temperature
Conclusion
There is no restriction of diffusion for in vivo hematomas with intracellular blood products. This confirms the observations from in vitro studies performed during the past 2 decades. The T2-blackout effect for T2-dark hematomas on diffusion-weighted images should not be interpreted as fast diffusion. Commercially available imaging software for computing trace values can include masked voxels in the reporting of the mean, which will artificially lower the ADC values in areas of low T2 signal (ie, hematomas and hemorrhagic stroke). The method of expected values can be used to obtain measurements for regions with signal intensities near the background noise. Using literature values for RBC self-diffusion, we compute lower limits of diffusion for hematomas with intracellular blood products to be 0.3 × 10⁻³ mm2/s.
fig 2.

T2-dark left frontal acute hematoma (intracellular deoxyhemoglobin with some intracellular methemoglobin).
A, T1-weighted image (600/20/1) (left) shows predominantly isointense blood products (deoxyhemoglobin) with some areas of hyperintensity centrally (intracellular methemoglobin). Fast spin-echo T2-weighted image (4000/85/1) (middle) shows predominantly low signal intensity corresponding to intracellular blood products. Diffusion-weighted isotropic image (10000/125/1) (right) shows marked hypointensity relative to the brain. This would intuitively be expected to correspond to fast diffusion (compare with CSF in ventricles).
B, Trace ADC map displayed without background masking (left) shows hematoma to have diffusion rates comparable with the brain, with some dropped points at the periphery. The dropped points are caused by background noise variation resulting in negative ADC values. Note that the diffusion within the hematoma is neither restricted nor fast relative to the brain. Trace ADC map displayed with 2% background masking (right) shows dramatic loss of pixels within hematoma.
fig 3.

T2-dark right frontal subacute hematoma (intracellular methemoglobin).
A, T1-weighted image (600/20/1) (left) shows predominantly hyperintense blood products. Fast spin-echo T2-weighted image (4000/85/1) (middle) shows predominantly low signal intensity corresponding to intracellular blood products. Diffusion-weighted isotropic image (10000/125/1) (right) shows T2 blackout effect with marked hypointensity relative to the brain.
B, Trace ADC map displayed without background masking (left) shows hematoma to have diffusion rates comparable with the brain, with some dropped points within the lesion. Trace ADC map displayed with 2% background masking (right) shows dramatic loss of pixels within hematoma.
Footnotes
Research support was provided by American Roentgen Ray Society Scholars Program 1999–2000.
Address reprint requests to Joseph A. Maldjian, MD, Wake Forest University School of Medicine, Division of Radiological Sciences, Medical Center Boulevard, Winston-Salem, NC 27157.
References
- 1.Grossman RI, Gomori JM, Goldberg HI, et al. MR imaging of hemorrhagic conditions of the head and neck. Radiographics 1988;8:441-454 [DOI] [PubMed] [Google Scholar]
- 2.Zimmerman RD, Heier LA, Snow RB, Liu DP, Kelly AB, Deck MD. Acute intracranial hemorrhage: intensity changes on sequential MR scans at 0.5 T. AJR Am J Roentgenol 1988;150:651-661 [DOI] [PubMed] [Google Scholar]
- 3.Weingarten K, Zimmerman RD, Deo-Narine V, Markisz J, Cahill PT, Deck MD. MR imaging of acute intracranial hemorrhage: findings on sequential spin-echo and gradient-echo images in a dog model. AJNR Am J Neuroradiol 1991;12:457-467 [PMC free article] [PubMed] [Google Scholar]
- 4.Atlas S, Dubois P, Singer MB, Lu D. Diffusion measurements in intracerebral hematomas: implications for MR imaging of acute stroke. AJNR Am J Neuroradiol 2000;21:1190-1194 [PMC free article] [PubMed] [Google Scholar]
- 5.Henkelman RM. Measurement of signal intensities in the presence of noise in MR images. Med Phys 1985;12:232-233 [DOI] [PubMed] [Google Scholar]
- 6.Mc Veigh ER, Henkelman RM, Bronskill MJ. Noise and filtration in magnetic resonance imaging. Med Phys 1985;12:586-591 [DOI] [PMC free article] [PubMed] [Google Scholar]
- 7.Larsen RJ, Marx ML. An Introduction to Mathematical Statistics and Its Applications.. Englewood Cliffs: Prentice-Hall; 1986
- 8.Moseley ME, Mintorovitch J, Cohen Y, et al. Early detection of ischemic injury: comparison of spectroscopy, diffusion-, T2-, and magnetic susceptibility-weighted MRI in cats. Acta Neurochir Suppl (Wien) 1990;51:207-209 [DOI] [PubMed] [Google Scholar]
- 9.Tanner JE. Intracellular diffusion of water. Arch Biochem Biophys 1983;224:416-428 [DOI] [PubMed] [Google Scholar]
- 10.Benga G, Popescu O, Pop VI, Hodor P, Borza T. Effects on water diffusion of inhibitors affecting various transport processes in human red blood cells. Eur J Cell Biol 1992;59:219-223 [PubMed] [Google Scholar]
- 11.Hazlewood CF, Rorschach HE, Lin C. Diffusion of water in tissues and MRI. Magn Reson Med 1991;19:214-216 [DOI] [PubMed] [Google Scholar]
- 12.Hazlewood C. A view of the significance and understanding of the physical properties of cell-associated water. In: Drost-Hansen W, Clegg J, eds Cell Associated Water 1976;165-259
- 13.Redwood WR, Rall E, Perl W. Red cell membrane permeability deduced from bulk diffusion coefficients. J Gen Physiol 1974;64:706-729 [DOI] [PMC free article] [PubMed] [Google Scholar]
- 14.Cooper RL, Chang DB, Young AC, Martin CJ, Ancker-Johnson D. Restricted diffusion in biophysical systems: experiment. Biophys J 1974;14:161-177 [DOI] [PMC free article] [PubMed] [Google Scholar]
- 15.Mills R. Self-diffusion in normal and heavy water in the range 1–45°. J Phys Chem 1973;77:685-688 [Google Scholar]