Abstract
BACKGROUND AND PURPOSE: Sjögren-Larsson syndrome (SLS) is a neurocutaneous syndrome caused by a genetic enzyme deficiency in lipid metabolism. Our purpose was to characterize the nature of the cerebral involvement in SLS.
METHODS: MR imaging was performed in 18 patients (aged 5 months to 45 years) and repeated in 14. Single-voxel proton MR spectra were acquired from cerebral white matter and gray matter in 16 patients, with follow-up studies in 11. LCModel fits were used to determine brain metabolite levels.
RESULTS: MR imaging showed retardation of myelination and a mild persistent myelin deficit. A zone of increased signal intensity was seen in the periventricular white matter on T2-weighted images. Proton MR spectroscopy of white matter revealed a prominent peak at 1.3 ppm, normal levels of N-acetylaspartate, and elevated levels of creatine (+14%), choline (+18%), and myo-inositol (+54%). MR imaging and proton MR spectroscopy of gray matter were normal. In the two patients examined during the first years of life, abnormalities on MR imaging and proton MR spectroscopy gradually emerged and then stabilized, as in all other patients.
CONCLUSION: Abnormalities on MR imaging and proton MR spectroscopy emerge during the first years of life and are similar in all patients with SLS, but the severity varies. The changes are confined to cerebral white matter and suggest an accumulation of lipids, periventricular gliosis, delayed myelination, and a mild permanent myelin deficit.
Sjögren-Larsson syndrome (SLS, OMIM 270200) is an inborn error of fatty alcohol oxidation with an autosomal recessive mode of inheritance. The well-known clinical triad includes ichthyosis, spastic diplegia or tetraplegia, and mental retardation (1). The congenital ichthyosis usually brings the patient to medical attention, whereas spasticity and mental retardation become apparent later in the first or second year of life. Preterm birth, pruritus, and ocular abnormalities (including a juvenile macular dystrophy) occur in most cases (2–6).
The defect in fatty alcohol oxidation in SLS is caused by the deficiency of microsomal fatty aldehyde dehydrogenase (FALDH, EC 1.2.1.48), a component of the fatty alcohol:NAD+ oxidoreductase enzyme complex (6, 7). FALDH catalyzes the oxidation of medium- and long-chain fatty aldehydes, derived from fatty alcohols or not, to the corresponding carboxylic acids (Fig 1). The accumulation of fatty alcohols, the modification of macromolecules by fatty aldehydes, and the presence of high concentrations of biologically active lipids have been postulated as the underlying pathophysiologic mechanisms that give rise to the clinical features (6–13). Mutations in the FALDH gene have been identified in patients with SLS (6).
Fig 1.
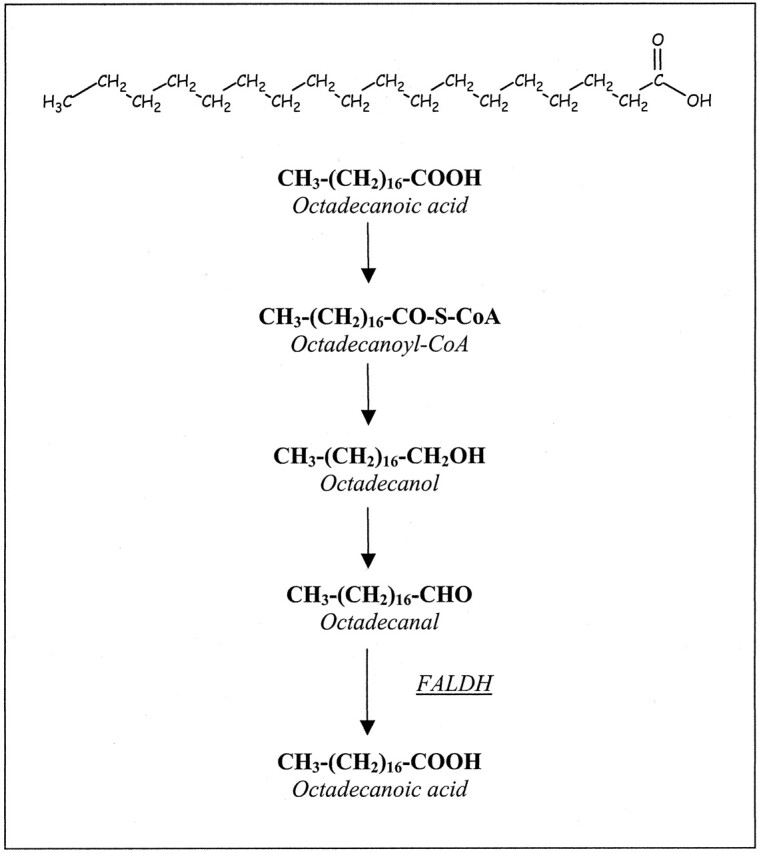
FALDH catalyzes the oxidation of long-chain fatty aldehydes (here, octadecanal) to the corresponding carboxylic acid.
A limited number of case reports have been published concerning the neuroradiologic (3, 5, 14–20) and neuropathologic (21–28) findings in SLS. These reports have stressed the presence of cerebral white matter abnormalities. Proton MR spectroscopic studies of cerebral white matter have shown an unusual lipid signal intensity that may represent accumulated fatty alcohols or their metabolites (3, 5, 15, 19).
To gain more insight into the nature of the cerebral involvement in SLS, we performed sequential MR imaging and proton MR spectroscopic studies in a series of 18 patients.
Methods
Patients
Eighteen patients with SLS (eight male and 10 female) from 13 families were evaluated. Patients 2 and 7, 6 and 13, eight and 11, 10 and 12, as well as patients 17 and 18 were sibling pairs. Their ages at the time of investigation ranged from 5 months to 45 years. In all patients, the diagnosis of SLS was confirmed by demonstrating FALDH deficiency and by performing mutation analyses of the FALDH gene (5).
Patients 1–16 had the classical clinical triad of congenital ichthyosis, spasticity, and mental retardation, with onset of the neurologic features in the first 2 years of life. Spasticity mainly involved the legs and gradually worsened. Although ambulation had been preserved in some patients, they all used wheelchairs in everyday life. Speech production was markedly affected in all patients. The interindividual, intrafamilial, and interfamilial differences were relatively minor. Patients 17 and 18 had a mild phenotype of SLS, as previously described (3, 5). None of the patients had any other serious disease.
Fourteen of the18 patients underwent MR imaging on more than one occasion (Table 1). In 17 patients, proton MR spectroscopy was performed; in 11, the investigation was repeated at least once (Table 2). Nine healthy control subjects (mean age, 18.7 years; range, 10–25 years), underwent MR imaging and proton MR spectroscopy with the same protocols as in the patients with SLS.
TABLE 1:
Results of cerebral MR imaging studies in 18 patients with SLS
| Patient | Sex | No. of Studies | Age Range, year | Myelin Deficit | Periventricular Zone of Abnormal Signal Intensity |
Atrophy | |
|---|---|---|---|---|---|---|---|
| Degree | Predominance | ||||||
| 1 | F | 3 | 0.8–1 | 1 | 1 | PO*† | 0 |
| 2 | M | 5 | 0.4–4 | 1 | 1 | PO | 0 |
| 3 | M | 2 | 3–5 | 1 | 1 | PO | 0 |
| 4 | M | 3 | 1–8 | 1 | 1 | PO | 0 |
| 5 | M | 1 | 8 | 1 | 1 | PO | 0 |
| 6 | M | 2 | 5–9 | 1 | 1 | PO | 0 |
| 7 | F | 2 | 6–9 | 1 | 1 | PO | 0 |
| 8 | M | 2 | 8–9 | 1 | 2 | FP* | 0 |
| 9 | F | 7 | 3–10 | 1 | 1 | PO | 0 |
| 10 | F | 1 | 10 | 1 | 1 | FP* | 1 |
| 11 | F | 1 | 13 | 1 | 1 | PO† | 0 |
| 12 | F | 3 | 11–14 | 1 | 1 | PO | 0 |
| 13 | M | 4 | 12–16 | 1 | 2 | FP | 1 |
| 14 | F | 3 | 12–17 | 1 | 1 | PO | 1 |
| 15 | F | 3 | 15–17 | 1 | 2 | FP*† | 0 |
| 16 | F | 3 | 16–21 | 1 | 1 | PO | 1 |
| 17 | M | 1 | 38 | 0 | 1 | PO | 1 |
| 18 | F | 2 | 41–45 | 1 | 1 | PO | 1 |
Note.—The results reflect findings from each patient’s latest MR imaging study. The degree of myelin deficit, periventricular signal-intensity abnormalities, and atrophy were scored as follows: 0 = none, 1 = mild, 2 = severe. PO = parieto-occipital, FP = frontoparietal.
Corpus callosum involved.
Patchy white matter lesions.
TABLE 2:
Results of proton MR spectroscopy in parieto-occipital white matter and gray matter
|
A: Patients’ last investigations | ||||||||
|---|---|---|---|---|---|---|---|---|
| Patient | No. of Studies | Age Range, year | White Matter Lipid Peak, au | White Matter Metabolites, mmol/L |
||||
| t-NAA | Cr | Cho | Ins | Glx | ||||
| 1 | 3 | 0.8–1 | 5.7 | 9.5 | 4.9 | 2.3 | 3.0 | 11.6 |
| 2 | 5 | 0.4–4 | 3.0 | 9.5 | 4.7 | 1.5 | 4.6 | 9.8 |
| 3 | 2 | 3–5 | 27.8 | 11.1 | 5.4 | 2.4 | 8.1 | 10.5 |
| 4 | 1 | 8 | 23.4 | 11.1 | 6.0 | 2.1 | 5.3 | 13.6 |
| 5 | 1 | 8 | 11.2 | 8.5 | 4.8 | 2.0 | 4.0 | 8.6 |
| 6 | 2 | 5–9 | 15.5 | 10.1 | 6.1 | 1.8 | 5.1 | 13.4 |
| 7 | 2 | 6–9 | 1.9 | 11.3 | 6.1 | 2.1 | 5.8 | 11.3 |
| 8 | 1 | 9 | 21.3 | 9.3 | 5.8 | 2.4 | 6.6 | 10.6 |
| 9 | 4 | 7–10 | 11.5 | 11.4 | 5.2 | 1.9 | 4.0 | 14.3 |
| 10 | 1 | 10 | Present | — | — | — | — | — |
| 11 | 1 | 13 | 11.2 | 9.4 | 4.7 | 1.8 | 5.9 | 8.7 |
| 12 | 3 | 11–14 | 13.6 | 9.9 | 6.3 | 2.1 | 6.0 | 13.0 |
| 13 | 4 | 12–16 | 19.8 | 11.9 | 6.0 | 2.0 | 6.3 | 10.2 |
| 14 | 2 | 17–17 | 20.3 | 10.5 | 6.6 | 1.8 | 6.7 | 16.0 |
| 15 | 3 | 15–17 | 8.6 | 12.7 | 6.8 | 1.9 | 5.4 | 15.3 |
| 16 | 2 | 21–21 | 6.9 | 11.0 | 7.6 | 2.4 | 5.5 | 14.5 |
| 18 | 1 | 45 | 1.6 | 8.9 | 6.0 | 1.8 | 3.6 | 9.8 |
|
B: Group means and standard deviations | ||||||
|---|---|---|---|---|---|---|
| Group | Lipid Peak, au | Metabolites, mmol/L |
||||
| t-NAA | Cr | Cho | Ins | Glx | ||
| White matter | ||||||
| Patients (n = 16) | 12.7 (8.1)* | 10.4 (1.2) | 5.8 (0.8)† | 2.0 (0.3)‡ | 5.4 (1.3)§ | 12.0 (2.4) |
| Control subjects (n = 9) | 0.6 (0.6) | 9.6 (0.9) | 5.1 (0.3) | 1.7 (0.3) | 3.5 (1.0) | 12.4 (0.9) |
| Gray matter | ||||||
| Patients (n = 15) | 0.9 (0.8) | 11.2 (1.6) | 7.1 (1.0) | 1.5 (0.3) | 3.9 (1.6) | 17.0 (2.7) |
| Control subjects (n = 9) | 1.1 (0.8) | 11.1 (0.5) | 6.5 (0.5) | 1.4 (0.1) | 4.3 (0.8) | 15.6 (2.0) |
Note.—au = arbitrary units, t-NAA = total NAA (N-acetylaspartate and N-acetylaspartylglutamate), Cr = creatine and creatine phosphate, Cho = free choline and the choline-containing compounds phosphocholine and glycerophosphorylcholine, Ins = myo-inositol, Glx = glutamine and glutamate, dashes = no data available. P values are given when P < .05 for SLS patients compared with healthy control subjects (unpaired two-tailed t test).
P = .0002.
P = .02.
P = .005.
P = .001.
MR Imaging
All MR investigations were performed on a Siemens Magnetom MR system (1.5 T) by using a standard circular polarized head coil. The MR imaging protocol consisted of localizers in three orthogonal directions, a T1-weighted spin-echo (SE) sequence in the coronal plane (TR/TE = 650/15), a proton density–and T2-weighted turbo SE sequence in the axial plane (TR/TE = 3100/16 and 98), and a T1-weighted SE sequence in the sagittal plane (TR/TE = 476/15).
The images were evaluated for stage of myelination (29, 30) and presence of gray matter and white matter signal-intensity abnormalities. White matter signal intensity on T2-weighted MR images was graded as follows: 0 = normal, 1 = mildly increased, or 2 = severely increased. The predominant location of the white matter signal-intensity changes was noted. The severity of the cerebral atrophy was graded as follows: 0 = no atrophy, 1 = mild enlargement of the ventricular system and/or the subarachnoid spaces, or 2 = severe enlargement of the ventricular system and/or the subarachnoid spaces. In case of doubt about the degree of signal-intensity change or atrophy, the lower grade was used.
Proton MR Spectroscopy
Single-voxel proton MR spectra were acquired by using the stimulated-echo acquisition mode (STEAM) technique (TR/mixing time/TE = 3000/30/20 or 30, NEX = 64) (31). Voxels of 8 mL were positioned at two locations containing mainly white matter (parieto-occipital trigone) or gray matter (midline parieto-occipital). MR spectroscopic imaging (MRSI) datasets were acquired from a 15-mm-thick axial or oblique section through the ventricles by using point-resolved spectroscopy (PRESS) volume preselection (TR/TE = 2000/135, NEX = 2, matrix size = 16 × 16, field of view = 240 mm) (31). Chemical-shift selective water suppression was applied. Spectra without water suppression were recorded (NEX = 4 for single-voxel spectra and NEX = 1 for MRSI data) for eddy-current correction and zero-order phasing.
The region between 4.0 and 1.1 ppm of each single voxel spectrum (TE = 20 ms) was analyzed by using LCModel to obtain metabolite tissue contents (32). To enable fitting of the lipid peak present in the white matter spectra, the basis set of spectra of model compounds was extended with a signal intensity representing lipid methylene proton spins. This virtual spectrum was obtained by shifting the acetate spectrum of the basis set in such a way that the single resonance of acetate appeared at 1.3 ppm, the approximate resonance position of the lipid peak. The spectra of lactate, ethanol, and β-hydroxybutyrate, which all have some resonance around 1.3 ppm, were not included. In this way, relative values of the intensity of the lipid peak were obtained in arbitrary units. The region with a broad resonance present between 0.8 and 0.9 ppm in the white matter spectra was not included in the analysis because inclusion of this region frequently resulted in baseline distortions. Tissue levels of the following metabolites were presented as the sum: total NAA (t-NAA) = N-acetylaspartate and N-acetylaspartylglutamate, Cho = free choline and the choline-containing compounds phosphocholine and glycerophosphorylcholine, Glx = glutamine and glutamate, and Cr = creatine and creatine phosphate. The spectra of patient 10 were not used for quantitative analysis, as only the frontal white matter was investigated. The gray matter spectrum of patient 5 could not be analyzed because of movement artifacts.
The postprocessing software of the manufacturer was applied to the single-voxel STEAM and the MRSI data. The time domain data were multiplied by using a Gaussian filter and zero-filled from 1K to 2K data points. The spectra were corrected for eddy-current artifacts, and the residual water signal intensity was removed by using a high-pass filtering technique. After Fourier transformation, only a minor first-order phase correction was necessary.
Results
MR Imaging
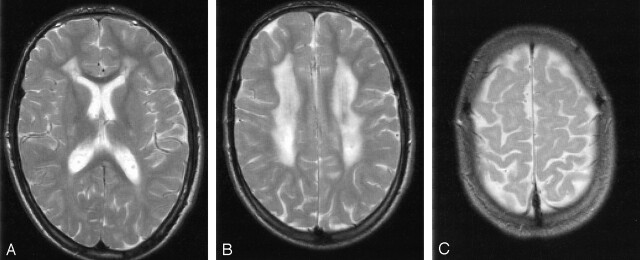
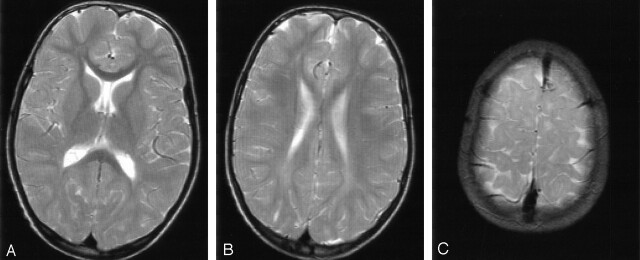
Myelination was delayed during the first years of life (patients 1–4 and 9). Small areas of subcortical white matter in all regions remained insufficiently myelinated throughout the follow-up period, even in the oldest patients in their forties (Figs 2C and 3C).
Fig 2.
Patient 13 at 16 years of age. T2-weighted MR images (3100/98 [TR/TE]).
A and B, Severe signal-intensity changes of the periventricular white matter with predominant involvement of the frontal trigones.
C, Small areas of unmyelinated subcortical association fibers.
Fig 3.
Patient 6 at 9 years of age. T2-weighted MR images (3100/98 [TR/TE]).
A and B, Mild signal-intensity changes of the periventricular white matter with predominant involvement of the occipital trigones.
C, Small areas of unmyelinated subcortical association fibers.
All patients had a zone of abnormally high signal intensity in the periventricular white matter on T2-weighted images (Table 1). The zone had a mildly decreased or normal signal intensity on T1-weighted images. It extended from the frontal aspect to the occipital aspect and had either a frontal (Fig 2A) or, more often, a parieto-occipital predominance (Fig 3A). A zone of subcortical white matter was spared in all patients. This spared zone was wider than the insufficiently myelinated U fibers. The signal-intensity change on T2-weighted images was either severe (Fig 2) or mild (Fig 3); an intermediate signal-intensity change was not observed. The areas of abnormal signal intensity were confluent in all but three patients (Figs 2–4). Patients 1, 11, and 15 had patchy white matter abnormalities. The corpus callosum was affected in patients 1, 8, 10, and 15. The limited image quality in some patients did not allow for systematic assessment of the pyramidal tracts in the brainstem. However, whenever good-quality images were available at the level of the brainstem, subtle signal-intensity abnormalities were seen in these tracts. The cerebellar white matter was normal in all cases. We did not observe abnormalities in gray matter structures.
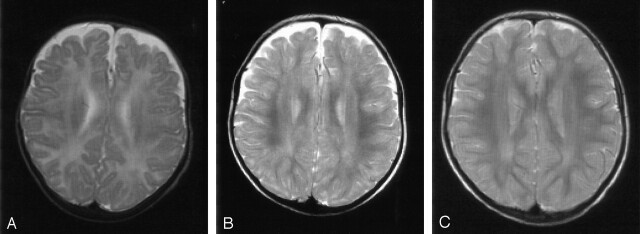
Fig 4.
Patient 2. T2-weighted MR images (3100/98 [TR/TE]). There is a delay in the maturation of the white matter on all three images.
A, At 5 months of age, the unmyelinated periventricular white matter shows no abnormal signal intensities.
B and C, Images obtained at 16 (B) and 35 (C) months of age show nonprogressive, slight signal-intensity abnormalities in the periventricular white matter that mainly involve the occipital trigones.
Our data covered patients’ ages of 5 months to 45 years (Table 1). Patients 1 and 2 were the youngest. At the age of 10 months, the T2-weighted MR images of patient 1 already showed the periventricular zone of slight signal-intensity abnormalities, but they did not reveal patchy, hyperintense white matter lesions or involvement of the corpus callosum. The latter were visible at the age of 1.9 years. In patient 2, the periventricular white matter had a normal signal intensity, considering its largely unmyelinated state at the age of 5 months (Fig 4A). At 16 months, a periventricular zone of abnormal signal intensity was visible (Fig 4B), and was unchanged at 2.1, 2.9 (Fig 4C), and 4.5 years. In all other patients, the white matter abnormalities remained unchanged during follow-up. There was neither an increase nor a decrease in the degree of signal-intensity change or the extent of the signal-intensity abnormalities.
Mild enlargement of the lateral ventricles was found in six patients. This ventricular enlargement was not progressive during follow-up.
Proton MR Spectroscopy
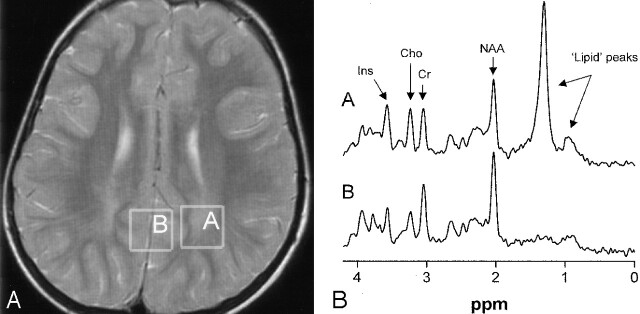
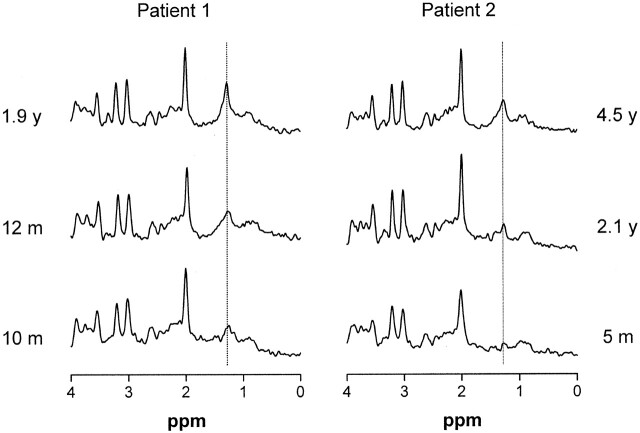
Spectra of the occipital white matter showed a prominent and narrow peak at 1.3 ppm (Figs 5 and 6) in patients but not in healthy control subjects. This resonance was seen at all TEs (20, 30, and 135 msec). In addition, most spectra contained an increased resonance at 0.8–0.9 ppm. These findings were compatible with abnormal amounts of lipids and with the methylene proton spins resonating at 1.3 ppm and the methyl proton spins at 0.8–0.9 ppm. These peaks were not found in the cerebral gray matter (n = 15) or cerebellum (n = 1).
Fig 5.
Patient 3 at 5 years of age.
A, Image shows voxel locations in the occipital trigone (box A) and in the central occipital gray matter (box B).
B, Proton MR spectra (TE = 20 msec) obtained from cerebral white matter (spectrum A) and gray matter (spectrum B). Note the presence of the high, sharp lipid peak at 1.3 ppm and a small peak at 0.8–0.9 ppm in the spectrum obtained from the white matter.
Fig 6.
Serial proton MR spectra (TE = 20 msec) from cerebral white matter of patients 1 and 2 demonstrate a gradual emergence of the lipid peak at 1.3 ppm during the first years of life.
MRSI revealed that the most intense lipid peaks were located in the periventricular region in the posterior and frontal trigones (Fig 7). The lipid peak appeared to be higher in the posterior than in the anterior trigone in all patients examined.
Fig 7.
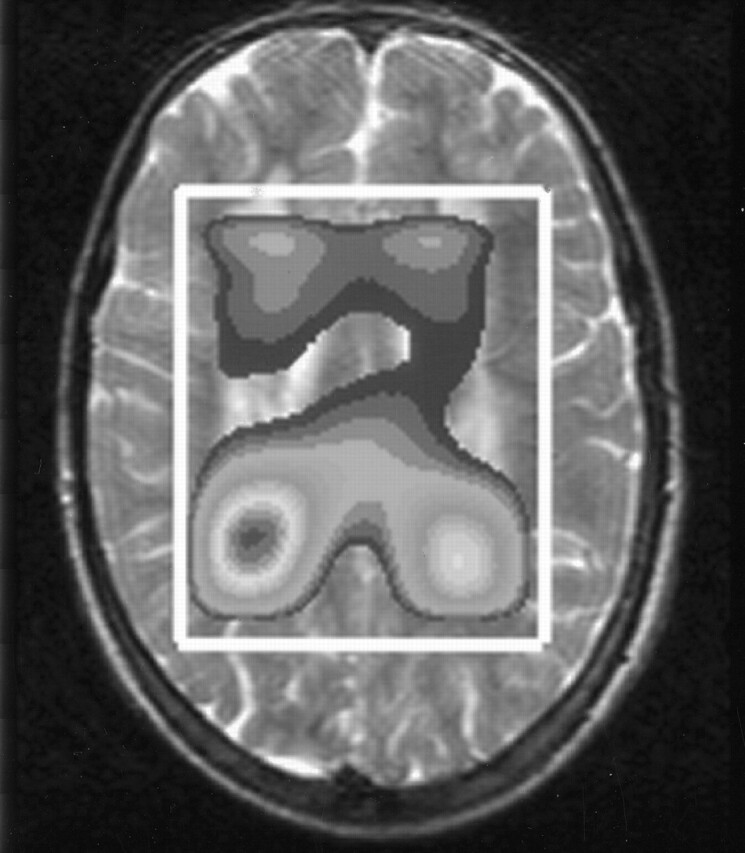
Metabolite map derived from MRSI data of patient 13 shows the spatial distribution of the lipid peak over the cerebral white matter. The peak has its maximum height around the anterior and posterior trigones.
Results for the relative intensity of the abnormal lipid peak at 1.3 ppm and the tissue levels of the other metabolites in white matter and gray matter are given in Table 2. As virtually no signal intensity was found at 3.6 ppm in spectra obtained at TE = 135 msec (as expected for glycine), the signal intensity at this position in short-TE spectra was attributed to myo-inositol (Ins). Significant increases were observed for levels of Cr (+14%), Cho (+18%), and especially Ins (+54%) in white matter but not gray matter of patients with SLS.
In patients 1 and 2, we were able to perform MR spectroscopy studies from a very early age. In both patients, the lipid peak at 1.3 ppm gradually emerged in the MR spectra (Fig 6).
Discussion
MR Imaging
In all patients except patient 17, MR imaging showed a picture compatible with initially delayed and eventually permanently incomplete myelination. The process of myelination appears to be arrested just before the subcortical association fibers are myelinated (29, 30). The pathophysiologic mechanisms that cause delayed and deficient myelination in SLS and the functional consequences are presently unclear.
In all patients, we found a zone of abnormally high signal intensity in the periventricular white matter on T2-weighted images. Our findings suggest that this hyperintense zone arises or becomes apparent during the process of myelination (Fig 4) and is nonprogressive thereafter. Only one other patient reported in the literature underwent repeated neuroimaging from an early age (19). At the age of 1 year, brain CT findings were normal, but subsequent CT and MR imaging revealed marked white matter involvement. It is striking that the clinical-neurologic signs also become apparent within the first or second years of life and remain relatively stable after that.
With the exception of one image (20), all MR images presented in the literature show severe white matter signal-intensity change (14–20). However, in our patients, mild signal-intensity changes were more common. We did not find a correlation between the severity of white matter involvement and the age of the patient or the severity of the neurologic abnormalities. The white matter abnormalities had either a frontal (n = 4) or posterior (n = 14) predominance. In all patients with severe signal-intensity changes, the frontal trigone was predominantly involved.
The periventricular white matter abnormalities were confluent in all patients but three. Patchy involvement of white matter on MR imaging has been reported in only one other patient with SLS (18). The corpus callosum was involved in four patients from our series and in three of the 12 previous patients examined by means of MR imaging (14, 17, 20).
Mild cerebral atrophy was found in most patients older than 10 years. The changes were nonprogressive during follow-up. This period, however, may have been too short to document progression. Also, the literature data are insufficient to determine whether or not typically progressive cerebral atrophy occurs in SLS.
Our series included five pairs of siblings. Only one pair had identical MR imaging findings (Table 1). The intrafamilial differences could be striking (Figs 2 and 3) (18, 20). We did not find an explanation for these findings among the patients’ dietary habits, use of drugs, or coexisting diseases.
Proton MR Spectroscopy
All patients with SLS have a prominent and narrow resonance at 1.3 ppm, where protons of methylene (CH2) groups resonate. The peak supposedly represents lipids that accumulate because of the FALDH deficiency. FALDH catalyzes the oxidation of medium- and long-chain fatty aldehydes derived from fatty alcohols (Fig 1). Therefore, the accumulated lipids would be fatty alcohols or fatty aldehydes. The peak at 1.3 ppm is narrow and also visible at a long TE of 135 ms, indicating a long T2. This finding suggests that the accumulated lipids are mobile molecules that move freely or within intercellular or intracellular droplets. Lipids located in lipid bilayers, such as membranes, have a low mobility and lead to broad resonances at short TEs; these are not visible at long TEs.
Within the cerebral white matter of patients with SLS, another abnormal but much smaller peak is seen at 0.8–0.9 ppm (19). This peak reflects protons from methyl (CH3) groups, which are constituents of many lipid molecules. Although we did not quantify the peak at 0.8–0.9 ppm, it was clear from our data that the height of this peak was not correlated with the peak at 1.3 ppm (Figs 5 and 6). A more-or-less constant ratio between both peaks would be expected if both represent the same single lipid molecule. It is therefore likely that the lipid peak at 1.3 ppm represents methylene groups of at least two different lipid molecules.
In contrast to the long list of substrates for FALDH in vitro (8), elevated levels of only a few metabolites have been demonstrated in body fluids and cultured skin fibroblasts of patients with SLS. These include the saturated fatty alcohols with a chain length of 16 and 18 carbons (hexadecanol and octadecanol, respectively) (11), their corresponding fatty aldehydes (hexadecanal and octadecanal) (9, 10), and leukotriene B4 (LTB4) and its omega-oxidation product 20-hydroxy-LTB4 (13). Although in vitro proton MR spectroscopy of long-chain fatty alcohols results in a narrow peak at 1.3 ppm (3, 19), it is necessary to analyze brain lipids of patients with SLS to be certain of the compounds responsible for the peak at 1.3 ppm.
A striking finding was that the peak at 1.3 ppm was present only in the white matter and not in the cortex and that it had its maximum height in the posterior and anterior trigones, where the signal-intensity abnormalities on T2-weighted images were seen (Fig 7). We did not find a systematic relationship between height of the lipid peak and the degree of signal intensity abnormality.
In patients 1 and 2, the youngest patients examined, we could demonstrate a gradual emerging lipid peak at 1.3 ppm. The latest spectra of both patients showed a clear but still relatively low lipid peak (Fig 6, Table 2). Serial investigations in individual patients showed some variability in the height of the peak but no systematic change over time. Small differences in the position of the voxel may explain the intraindividual variability. The MR imaging and MR spectroscopic findings in both youngest patients suggest a gradual development of abnormalities during the first years of life.
A lipid peak at 1.2–1.3 ppm, smaller than the peak in SLS, has been described in one patient with Niemann-Pick disease type C (33), a lipid storage disorder based on defective intracellular lipid trafficking. It was postulated that the peak arises from the accumulation of protons of the long carbon chain of glucosylceramides and galactosylceramides. Recently, a patient with rhizomelic chondrodysplasia punctata (RCDP) due to deficiency of the peroxisomal enzyme dihydroxyaceton phosphate acyltransferase (DHAPAT) was reported with similar abnormalities in the lipid region of the MR spectrum (34). The lipid peak was ascribed to an accumulation of different lipids, including hexadecanol. Both patients with SLS and patients with RCDP have elevated plasma and tissue concentrations of long-chain fatty alcohols (especially hexadecanol) (35). In DHAPAT deficiency, hexadecanol is thought to accumulate due to impaired incorporation into plasmalogens, while the accumulation of hexadecanol in SLS is caused by defective metabolism of hexadecanol to hexadecanoic acid via its fatty aldehyde hexadecanal. The presence of abnormal lipid signals has also been reported in patients with other degenerative disorders, including other peroxisomal disorders and multiple sclerosis (36–38). However, in these patients, the lipid peaks are less intense, broader, and visualized with only a short TE.
We found increased levels of Cr, Cho, and especially Ins in the white matter of our patients, whereas t-NAA and Glx levels were normal. These findings are compatible with gliosis without significant axonal damage or loss (37, 38). Active demyelination leads to a higher Cho level. Miyanomae et al (15) suggest a decrease in NAA in the cerebral white matter of a 25-year-old patient, but they used only ratios (NAA/Cr and NAA/Cho). We did not find a correlation between the severity of MR imaging abnormalities and the levels of brain metabolites.
Neuropathology
Review of the neuropathology literature on SLS is hampered by the fact that this diagnosis has not been proved in any of the patients reported. We agree with Jagell (39) and Jagell et al (2) in that the clinical descriptions by Bredmose (21), Baar and Galindo (22), Sylvester (23), Silva et al (24) and Wester et al (25) are highly suggestive of SLS. In contrast, the cases described by Yamamoto et al (26), McLennan et al (27), and Yamaguchi and Handa (28) are atypical. Sylvester (23) gives the most extensive report, describing a pearly gray strip extending from the frontal to occipital regions with sparing of the arcuate fibers. In addition, small droplets of free fat and lipid droplets within microglia are found. There was a considerable deficit of myelin, axonal damage, and astrogliosis in the centrum semiovale and the corticospinal tracts. Others (21, 22, 24, 25) have also reported mild-to-marked myelin deficit, slight loss of neurons, and an excess of astrocytes, but the presence of lipid droplets had not been explicitly mentioned. The neuropathologic observations are largely in agreement with our MR imaging and proton MR spectroscopic findings. The most important difference is that we found a normal t-NAA level in the white matter areas with abnormal signal intensity on MR imaging; this argues against extensive axonal damage.
Conclusions
In SLS, MR imaging and proton MR spectroscopic abnormalities of the brain are confined to the cerebral white matter and the corticospinal tracts. They consist of the accumulation of lipid substrates, delayed myelination, periventricular gliosis, and a permanent myelin deficit. The patterns are strikingly similar among patients with SLS, but the severity varies. The morphologic and biochemical abnormalities emerge during the first years of life and subsequently show little or no progression. The lipid peak at 1.3 ppm in the proton MR spectrum of cerebral white matter is characteristic of SLS and may offer a quantitative parameter for monitoring the effects of therapeutic interventions (40).
Acknowledgments
We thank the following colleagues from the University Medical Center Nijmegen in Nijmegen: Jack J. A. van Asten and Mark Rijpkema for their technical assistance in proton MR spectroscopy data analyses; Roel Lubbers and Marc D. Zuijdwijk for their contribution to the compilation and the statistical analyses of the proton MR spectroscopy data; Yvonne M. van der Meulen for her technical assistance during the MR investigations, data management, and processing and compiling the figures; Jan G. N. de Jong for his contribution to the discussion on the biochemical issues of this study; Adilia Warris for the translation of the Norwegian article (reference 21); and Rob C. A. Sengers for his critical comments on this manuscript. We also thank Ronald J. A. Wanders and Lodewijk IJlst (Departments of Pediatrics and Clinical Chemistry, Academic Medical Center, University of Amsterdam) for performing the enzymatic and molecular genetic studies in all patients.
References
- 1.Sjögren T, Larsson T. Oligophrenia in combination with congenital ichthyosis and spastic disorders. Acta Psych Neurol Scand 1957;32 suppl(113):1–113 [PubMed] [Google Scholar]
- 2.Jagell S, Gustavson KH, Holmgren G. Sjögren-Larsson syndrome in Sweden: a clinical, genetic and epidemiological study. Clin Genet 1981;19:233–256 [DOI] [PubMed] [Google Scholar]
- 3.Van Domburg PHMF, Willemsen MAAP, Rotteveel JJ, et al. Sjögren-Larsson syndrome: clinical and MRI/MRS spectroscopy findings in FALDH deficient patients. Neurology 1999;52:1345–1352 [DOI] [PubMed] [Google Scholar]
- 4.Willemsen MAAP, Cruysberg JRM, Rotteveel JJ, Aandekerk AL, van Domburg PHMF, Deutman AF. Juvenile macular dystrophy associated with deficient activity of fatty aldehyde dehydrogenase in Sjögren-Larsson syndrome. Am J Ophthalmol 2000;130:782–789 [DOI] [PubMed] [Google Scholar]
- 5.Willemsen MAAP, IJlst L, Steijlen PM, et al. Clinical, biochemical and molecular genetic characteristics of 19 patients with the Sjogren-Larsson syndrome. Brain 2001;124:1426–1437 [DOI] [PubMed] [Google Scholar]
- 6.Rizzo WB. Sjögren-Larsson syndrome: fatty aldehyde dehydrogenase deficiency. In: Scriver CR, Beaudet AL, Sly WS, Valle D, eds. The Metabolic and Molecular Bases of Inherited Disease. New York: McGraw-Hill;2001. :2239–2258
- 7.Rizzo WB, Craft DA. Sjögren-Larsson syndrome. Deficient activity of the fatty aldehyde dehydrogenase component of fatty alcohol:NAD+ oxidoreductase in cultured fibroblasts. J Clin Invest 1991;88:1643–1648 [DOI] [PMC free article] [PubMed] [Google Scholar]
- 8.Kelson TL, Secor McVoy JR, Rizzo WB. Human liver fatty aldehyde dehydrogenase: microsomal localization, purification, and biochemical characterization. Biochim Biophys Acta 1997;1335:99–110 [DOI] [PubMed] [Google Scholar]
- 9.James PF, Zoeller RA. Isolation of animal cell mutants defective in long-chain fatty aldehyde dehydrogenase. Sensitivity to fatty aldehydes and Schiff’s base modification of phospholipids: implications for Sjögren-Larsson syndrome. J Biol Chem 1997;272:23532–23539 [DOI] [PubMed] [Google Scholar]
- 10.Verhoeven NM, Jakobs C, Carney G, Somers MP, Wanders RJA, Rizzo WB. Involvement of microsomal fatty aldehyde dehydrogenase in the α-oxidation of phytanic acid. FEBS Lett 1998;429:225–228 [DOI] [PubMed] [Google Scholar]
- 11.Rizzo WB, Craft DA. Sjögren-Larsson syndrome: accumulation of free fatty alcohols in cultured fibroblasts and plasma. J Lipid Res 2000;41:1077–1081 [PubMed] [Google Scholar]
- 12.Rizzo WB, Heinz E, Simon M, Craft DA. Microsomal fatty aldehyde dehydrogenase catalyzes the oxidation of aliphatic aldehyde derived from ether glycerolipid catabolism: implications for Sjögren-Larsson syndrome. Biochim Biophys Acta 2000;1535:1–9 [DOI] [PubMed] [Google Scholar]
- 13.Willemsen MAAP, Rotteveel JJ, de Jong JGN, et al. Defective metabolism of leukotriene B4 in the Sjögren-Larsson Syndrome. J Neurol Sci 2001;183:61–67 [DOI] [PubMed] [Google Scholar]
- 14.Di Rocco M, Filocamo M, Tortori-Donati P, Veneselli E, Borrone C, Rizzo WB. Sjögren-Larsson syndrome: nuclear magnetic resonance imaging of the brain in a 4-year-old boy. J Inher Metab Dis 1994;17:112–114 [DOI] [PubMed] [Google Scholar]
- 15.Miyanomae Y, Ochi M, Yoshioka H, et al. Cerebral MR imaging and spectroscopy in Sjögren-Larsson syndrome: case report. Neuroradiology 1995;37:225–228 [DOI] [PubMed] [Google Scholar]
- 16.Hussain MZ, Aihara M, Oba H, et al. MR imaging of white matter changes in the Sjögren-Larsson syndrome. Neuroradiology 1995;37:576–577 [DOI] [PubMed] [Google Scholar]
- 17.Phanthumchinda K, Srimanuthipol K, Yodnophaklao P. Sjögren-Larsson syndrome. J Med Assoc Thai 1996;79:541–544 [PubMed] [Google Scholar]
- 18.Van Mieghem F, van Goethem JWM, Parizel PM, et al. MR of the brain in Sjögren-Larsson syndrome. AJNR Am J Neuroradiol 1997;18:1561–1563 [PMC free article] [PubMed] [Google Scholar]
- 19.Mano T, Ono J, Kaminaga T, et al. Proton MR spectroscopy of Sjogren-Larsson’s syndrome. AJNR Am J Neuroradiol 1999;20:1671–1673 [PMC free article] [PubMed] [Google Scholar]
- 20.Altinok D, Yildiz YT, Seckin D, Altinok G, Tacal T, Eryilmaz M. MR imaging of three siblings with Sjogren-Larsson syndrome. Pediatr Radiol 1999;29:766–769 [DOI] [PubMed] [Google Scholar]
- 21.Bredmose GV. Et tilfaelde af mongoloid idioti og ichthyosis med neurohistologiske forandringer. Nord Med 1940;5:440–442 [Google Scholar]
- 22.Baar HS, Galindo J. Pathology of the Sjogren-Larsson syndrome. J Maine Med Assoc 1965;56:223–226 [PubMed] [Google Scholar]
- 23.Sylvester PE. Pathological findings in Sjögren-Larsson syndrome. J Ment Defic Res 1969;13:267–275 [DOI] [PubMed] [Google Scholar]
- 24.Silva CA, Saraiva A, Goncalves V, de Sousa G, Martins R, Cruz C. Pathological findings in one of two siblings with Sjögren-Larsson syndrome. Eur Neurol 1980;19:166–170 [DOI] [PubMed] [Google Scholar]
- 25.Wester P, Bergstrom U, Brun A, Jagell S, Karlsson B, Eriksson A. Monoaminergic dysfunction in Sjogren-Larsson syndrome. Mol Chem Neuropathol 1991;15:13–28 [DOI] [PubMed] [Google Scholar]
- 26.Yamamoto T, Sekiya T, Sekine Y, Konishi E, Aoyama M, Takashima H. An autopsy case of Sjögren-Larsson syndrome with mental deficiency, ichthyosis, spastic diplegia and generalized hyperaminoaciduria. Adv Neurol Sci 1971;15:731–744 [PubMed] [Google Scholar]
- 27.McLennan JE, Gilles FH, Robb RM. Neuropathological correlation in Sjögren-Larsson syndrome: oligophrenia, ichthyosis and spasticity. Brain 1974;97:693–708 [DOI] [PubMed] [Google Scholar]
- 28.Yamaguchi K, Handa T. Sjögren-Larsson syndrome: postmortem brain abnormalities. Pediatr Neurol 1998;18:338–341 [DOI] [PubMed] [Google Scholar]
- 29.Barkovich AJ, Kjos BO, Jackson DE, Norman D. Normal maturation of the neonatal and infant brain: MR imaging at 1.5 T. Neuroradiology 1988;166:173–180 [DOI] [PubMed] [Google Scholar]
- 30.Van der Knaap MS, Valk J. MR imaging of the various stages of myelination during the first year of life. Neuroradiology 1990;31:459–470 [DOI] [PubMed] [Google Scholar]
- 31.Gadian DG. NMR and its applications to living systems. Oxford: Oxford University Press;1995. :267–269
- 32.Provencher SW. Estimation of metabolite concentrations from localized in vivo proton NMR spectra. Magn Reson Med 1993;30:672–679 [DOI] [PubMed] [Google Scholar]
- 33.Sylvain M, Arnold DL, Scriver CR, Schreiber R, Shevell MI. Magnetic resonance spectroscopy in Niemann-Pick disease type C: correlation with diagnosis and clinical response to cholestyramine and lovastatin. Pediatr Neurol 1994;10:228–232 [DOI] [PubMed] [Google Scholar]
- 34.Viola A, Confort-Gouny S, Ranjeva JP, et al. MR imaging and MR spectroscopy in rhizomelic chondrodysplasia punctata. AJNR Am J Neuroradiol 2002;23:480–483 [PMC free article] [PubMed] [Google Scholar]
- 35.Rizzo WB. Inherited disorders of fatty alcohol metabolism. Mol Genet Metab 1998;65:63–73 [DOI] [PubMed] [Google Scholar]
- 36.Wolinsky JS, Narayana PA, Fenstermacher MJ. Proton magnetic resonance spectroscopy in multiple sclerosis. Neurology 1990;40:1764–1769 [DOI] [PubMed] [Google Scholar]
- 37.Bruhn H, Kruse B, Korenke GC, et al. Proton NMR spectroscopy of cerebral alterations in infantile peroxisomal disorders. J Comput Assist Tomogr 1992;16:335–344 [DOI] [PubMed] [Google Scholar]
- 38.Tzika AA, Ball WS, Vigneron DB, Dunn RS, Kirks DR. Clinical proton MR spectroscopy of neurodegenerative disease in childhood. AJNR Am J Neuroradiol 1993;14:1267–1281 [PMC free article] [PubMed] [Google Scholar]
- 39.Jagell S. SLS or not SLS: Sjogren-Larsson syndrome. Pediatr Neurol 1998;19:399. [PubMed] [Google Scholar]
- 40.Willemsen MA, Lutt MA, Steijlen PM, et al. Clinical and biochemical effects of zileuton in patients with the Sjogren-Larsson syndrome. Eur J Pediatr 2001;160:711–717 [DOI] [PubMed] [Google Scholar]


