

Abstract
BACKGROUND AND PURPOSE: Increasing use of CT for evaluating neurologic disease may expose patients to considerable levels of ionizing radiation. We compared the image quality of low-mAs head CT scans with that of conventional nonenhanced scans.
METHODS: Conventional head CT scans were obtained in 20 patients (all >65 years with history of non-CNS malignancy) by using a multidetector technique: 170 mA and 1-second scanning time (ie, 170 mAs), 140 kVp, table speed of 7.5 mm per rotation, pitch of 0.75, section thickness of 5 mm, and field of view of 25 mm. A limited volume helical data acquisition covering four 5-mm-thick images was obtained by using 90 mAs but otherwise the same parameters. Three neuroradiologists visually rated the resulting images for quality in a blinded comparison. Representative 1- to 4-mm2 regions of interest were chosen in gray matter and white matter locations. Conspicuity and the contrast-to-noise ratio were analyzed. Statistical comparisons were done by using the Student t test.
RESULTS: Mean gray matter conspicuity was not significantly different between the 170- and 90-mAs groups (0.39 ± 0.19 vs 0.41 ± 0.03, P = .32). Mean gray matter contrast-to-noise ratio was approximately 22% higher with 170 mAs than with 90 mAs (1.77 ± 0.52 vs 1.39 ± 0.38, P = .005). All 90-mAs images were rated as having slightly greater image noise than the 170-mAs scans but with sufficient perceived resolution.
CONCLUSION: Although 90-mAs head CT images were moderately noisier than 170-mAs images, they were rated as having acceptable diagnostic quality.
There has been extensive recent interest, among both radiologists and the general public, in the topic of minimizing radiation doses during CT scanning (1–3). As newer techniques such as CT angiography increase radiation exposure, this concern becomes more acute (4). The increasing use of CT (5) for diagnosing and monitoring neurologic disease may expose patients to considerable levels of ionizing radiation. Indeed, reduced-mAs CT examinations of the sinus bones, vertebral bodies, and other high-contrast structures are already being performed at some institutions. In this study, we compared the image quality and potential clinical applicability of head CT scans obtained with low mAs (approximately 50% of a routine dose) with those of conventional scans.
Methods
Patients
This investigation was performed in our department as part of a larger, multiorgan study of CT radiation dose originally conceived in consultation with physicist Dr Joel Gray (6). After obtaining approval from our hospital’s institutional review board, we enrolled 20 consecutive patients. All patients had a history of non-CNS malignancy without prior metastases or cranial irradiation. Patients were 65 years of age or older and underwent conventional nonenhanced head CT for varying indications. Written informed consent was obtained from the patients before imaging.
CT Parameters
Conventional head CT scanning was performed on a four-channel multidetector-row machine by using our standard departmental protocol with the following parameters: 170 mA and 1-second scanning time (ie, 170 mAs), 140 kV, pitch of 0.75, and table speed of 7.5 mm/s. After this scanning, a limited volume of helical data was obtained to cover four 5-mm-thick sections through standardized brain levels. For this, 90 mAs was used, but otherwise the other technique factors were identical. The limited volume scan covered the following anatomic areas: centrum semiovale, corona radiata at the lateral ventricles, middle cranial fossa/skull base, and posterior fossa/palate.
Qualitative Evaluation of Resulting Images
A total of 160 axial head CT images from 20 patients (two scans per patient, four sections per scan) were evaluated by consensus interpretation of two American Board of Radiology–certified radiologists with Certificates of Added Qualification in Neuroradiology (M.A.L., P.B.) and one experienced neuroimaging technologist (C.E.O.). These radiologists were blinded to the patients’ names and clinical histories and to the mA values. Both the 90- and 170-mAs images were rated according to a subjective five-point scale for image quality. The interpreting radiologists were asked to concentrate on typical parameters of image quality: image noise, gray matter (GM)–white matter (WM) conspicuity, subarachnoid space sharpness, ventricular margins, and distinctness of the posterior fossa contents. Direct pair-wise comparison was performed in a blinded manner between each of the 170- and 90-mAs scanning sections for each patient. A randomly selected reference section from each pair was rated as having image quality better than, equal to, slightly less than, or significantly less than that of the remaining section or having unacceptable or nondiagnostic image quality. This scale was used to grade differences in both GM-WM conspicuity (ie, the ability to distinguish between GM and WM) and image noise (ie, graininess). Interpretation was performed by using soft-copy images on a Picture Archiving and Communication System (PACS) workstation. Window and level settings were standardized for initial review, but each interpreting radiologist was also allowed to vary the settings as they saw fit.
Quantitative Evaluation of Resulting Images
A minimum of three, small (1- to 4-mm2), representative regions of interest (ROIs) was chosen in identical neuroanatomic GM and WM locations for each set of images, as previously described (7). Careful attention was paid to avoiding volume averaging from blood vessels, sulci, and cisterns, as well as between GM and WM. ROI values, measured in Hounsfield units, were averaged across all four scanning sections for each of the 170- and 90-mAs groups. GM conspicuity was defined as follows: (mean GM ROI − mean WM ROI)/mean WM ROI. The image contrast-to-noise ratio (CNR) was defined in a standard manner: (mean GM ROI − mean WM ROI)/[(SD GM ROI)2 + (SD WM ROI)2]1/2, where SD is the standard deviation (7). Data were analyzed by using the Student t test for unequal variances. Significance was set at P ≤ .05.
Results
All 80 of the 90-mAs image sections were rated as having slightly less diagnostic quality than the 170-mAs reference images. None were rated as nondiagnostic or of significantly less quality than their 170-mAs counterparts.
Composite results for signal intensity–to-noise ratios and conspicuity for each patient are listed in the Table. Mean GM conspicuity was not significantly different for the 170- and 90-mAs groups (0.39 ± 0.19 vs 0.41 ± 0.03, respectively; P = .32). Mean image CNR was approximately 22% higher for the 170-mAs group than for the 90-mAs group; this result was statistically significant (1.77 ± 0.52 vs 1.39 ± 0.38; P = .005). All of the 90-mAs images were rated as having slightly greater image noise than that of the 170-mAs scans, but they had sufficient perceived resolution for routine clinical indications.
Composite results for signal intensity–to-noise ratios and conspicuity
| Patient | 170 mAs |
90 mAs |
170 mAs |
90 mAs |
GM Conspicuity |
GM CNR |
||||||
|---|---|---|---|---|---|---|---|---|---|---|---|---|
| GM | SD | GM | SD | WM | SD | WM | SD | 90 mAs | 170 mAs | 90 mAs | 170 mAs | |
| 1 | 30.20 | 4.07 | 30.70 | 4.95 | 15.40 | 4.24 | 16.60 | 5.22 | 0.85 | 0.96 | 1.96 | 2.52 |
| 2 | 33.90 | 4.09 | 33.80 | 4.68 | 23.90 | 3.27 | 23.30 | 4.69 | 0.45 | 0.42 | 1.58 | 1.91 |
| 3 | 30.00 | 3.87 | 29.90 | 4.93 | 22.40 | 3.55 | 21.70 | 4.84 | 0.38 | 0.34 | 1.19 | 1.45 |
| 4 | 35.10 | 3.91 | 35.30 | 4.94 | 22.30 | 3.31 | 21.90 | 4.44 | 0.61 | 0.57 | 2.02 | 2.50 |
| 5 | 30.40 | 3.89 | 33.60 | 5.33 | 23.20 | 3.96 | 23.10 | 5.20 | 0.45 | 0.31 | 1.41 | 1.30 |
| 6 | 29.90 | 3.66 | 30.40 | 5.53 | 21.60 | 2.95 | 21.90 | 4.12 | 0.39 | 0.38 | 1.23 | 1.77 |
| 7 | 33.20 | 3.40 | 35.10 | 3.85 | 25.00 | 2.95 | 25.90 | 4.39 | 0.36 | 0.33 | 1.58 | 1.82 |
| 8 | 31.80 | 3.57 | 31.30 | 5.15 | 21.60 | 3.62 | 22.20 | 4.39 | 0.41 | 0.47 | 1.34 | 2.01 |
| 9 | 32.60 | 3.53 | 32.10 | 4.76 | 25.80 | 2.60 | 24.80 | 3.86 | 0.29 | 0.26 | 1.19 | 1.55 |
| 10 | 25.60 | 2.89 | 25.80 | 4.08 | 22.10 | 3.30 | 22.90 | 5.33 | 0.13 | 0.16 | 0.43 | 0.80 |
| 11 | 33.30 | 3.22 | 32.90 | 4.30 | 24.10 | 2.87 | 25.10 | 4.35 | 0.31 | 0.38 | 1.28 | 2.13 |
| 12 | 32.60 | 3.54 | 34.40 | 5.80 | 22.40 | 3.14 | 23.00 | 4.81 | 0.50 | 0.46 | 1.51 | 2.16 |
| 13 | 31.10 | 3.28 | 33.60 | 6.42 | 23.70 | 2.94 | 24.60 | 4.92 | 0.37 | 0.31 | 1.11 | 1.68 |
| 14 | 31.10 | 3.30 | 34.50 | 4.93 | 25.00 | 3.51 | 24.80 | 5.16 | 0.39 | 0.24 | 1.36 | 1.27 |
| 15 | 29.90 | 3.57 | 31.60 | 4.61 | 25.70 | 3.73 | 24.30 | 5.67 | 0.30 | 0.16 | 1.00 | 0.81 |
| 16 | 33.60 | 3.65 | 32.50 | 4.72 | 19.50 | 3.44 | 18.80 | 4.73 | 0.73 | 0.72 | 2.05 | 2.81 |
| 17 | 33.00 | 3.51 | 34.30 | 4.02 | 24.20 | 3.28 | 24.20 | 3.86 | 0.42 | 0.36 | 1.81 | 1.83 |
| 18 | 36.80 | 3.61 | 34.40 | 5.50 | 27.20 | 3.14 | 26.60 | 4.44 | 0.29 | 0.35 | 1.10 | 2.01 |
| 19 | 31.90 | 3.87 | 33.30 | 5.59 | 23.40 | 2.99 | 23.70 | 5.07 | 0.41 | 0.36 | 1.27 | 1.74 |
| 20 | 31.30 | 3.18 | 32.80 | 4.08 | 25.10 | 2.96 | 25.40 | 3.86 | 0.29 | 0.25 | 1.32 | 1.43 |
Figure 1 illustrates representative 170- and 90-mAs head CT images for a typical patient at standardized levels. Detailed, magnified field-of-view illustrations of the results are shown in Figure 2 (same patient). Mild image pixelation and a grainy appearance are demonstrated, reflecting the mild increase in image noise described by the quantitative results.
Fig 1.
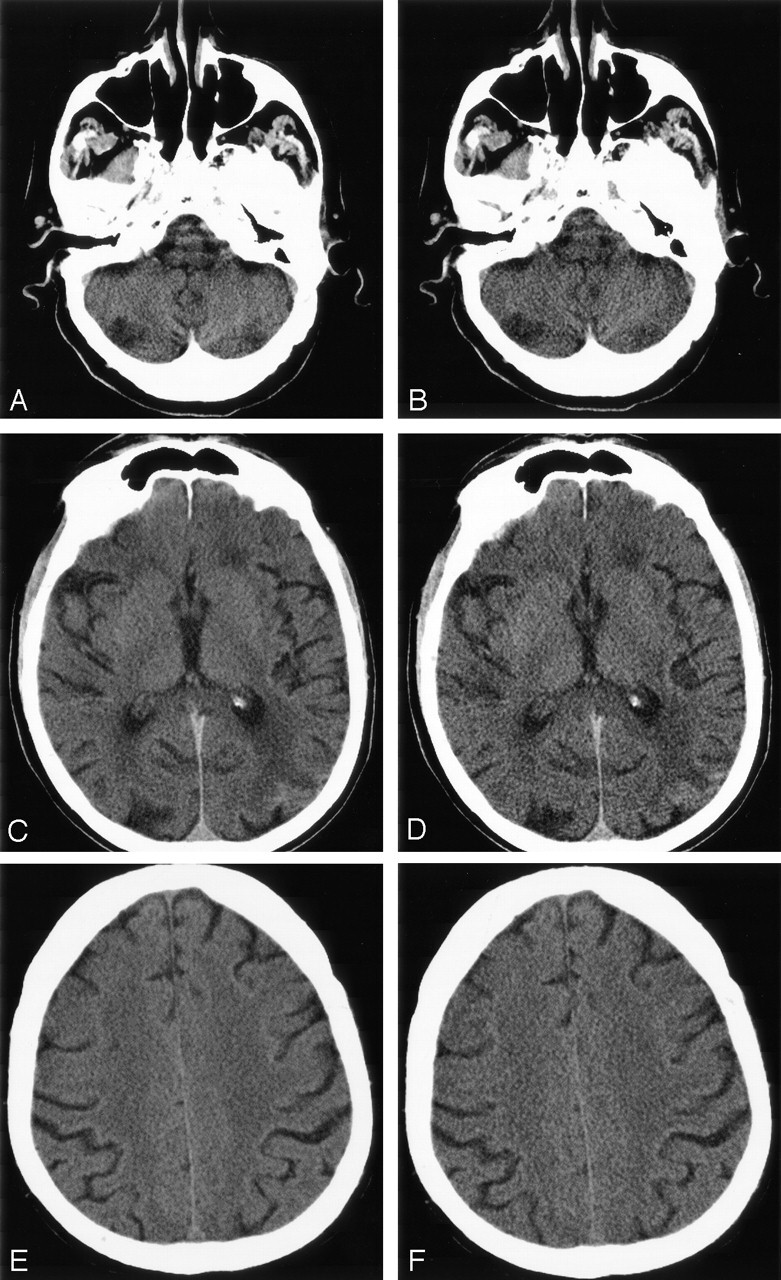
Images in a 70-year-old woman show normal brain. Standard- and low-dose nonenhanced head CT scans at identical levels are compared.
A and B, Posterior fossa (medulla and cerebellar hemispheres) at 170 (A) and 90 (B) mAs.
C and D, Thalamus (deep GM) and forceps major (WM) at 170 (C) and 90 (D) mAs.
E and F, Centrum semiovale (WM) at 170 (A) and 90 (B) mAs.
Fig 2.

Images in a 70-year-old woman show normal brain. Geometric magnification of data was obtained by using a standard, nonenhanced head CT technique and a low-dose technique at an identical level.
A, 170 mAs.
B, 90 mAs.
Discussion
We evaluated nonenhanced head CT scanning, one of the most widely used tools for the screening of intracranial pathology. CT scans account for 13% of the radiologic examinations performed nationwide and 30%of the overall radiation exposure attributable to such examinations (8). As newer CT techniques (eg, CT angiography based on thin sections and multidetector-row scanners) become the standard of practice, the potential for cumulative effects seems even more relevant.
In our practice at a tertiary care hospital with an active neurologic intensive care unit (NICU), a stroke team, and a neurosurgical service, it is not uncommon for critically ill inpatients to undergo multiple daily head CT examinations over days to weeks. Thus, we aimed to determine if their radiation exposure could be reduced with reasonable preservation of diagnostic quality. As we assume that these examinations are clinically indicated and required for appropriate patient care, reducing imaging quality below that required for minimal diagnostic accuracy would clearly be counterproductive. An inherent assumption is the ALARA principle: The total radiation dose should be “as low as reasonably allowable” (9).
Theoretically, any CT parameter can be varied to assess their influence on the total dose. Radiation dose is linearly proportional to tube current (milliamperes, mA) and scanning time (seconds, s) (6, 10, 11). Their product is milliampere-second (mAs). The relationship between dose and kilovolt peak (X-ray beam energy) is nonlinear (11); however, decreased kVp typically result in increased image noise (12). Increasing the pitch factor reduces the dose and vice versa, if no other parameters are changed (11). Because of the multitude of CT scanners available and because of their differences in reacting to changes in pitch, attention has to be paid to whether such changes affect other parameters as well, thus prohibiting any reduction in dose. Actual calculations of patient dose are complex and partly based on the patient’s body habitus, the body part examined, and the method of delivery. We estimate that a routine 170-mAs head CT examination in our department typically results in a CT dose index (CTDIw) of 65 mGy, or 6.5 rad (radiation absorbed dose), with the parameters as described in Methods. We chose mAs as our experimental variable not only because mA is the scanning parameter that linearly influences patient dose but also because the CT technologist can easily adjust this before the examination. Specifically, a 50% reduction in mAs results in a 50% reduction in dose (10). Thus, a decrease in tube current from 170 to 90 mAs should result in a head CT CTDIw of approximately 3.4 rad.
The Society of Pediatric Radiology recently convened a conference addressing the issue of CT radiation exposure in children. Although the proceedings were specifically geared toward a pediatric population, many of the conclusions reached apply to adults as well. Slovis (9) detailed the following summary: 1) The benefits of CT usually outweigh the risks. 2) Sensitivity to radiation exposure is inversely proportional to age. 3) An excess cancer risk likely exists in relation to CT radiation exposure, though it is unclear how significant this effect is. 4) No consensus on dose exists. 5) A group should be formed to investigate effective doses. 6) Radiation doses should be reduced, but diagnostic quality should be preserved. 7) All caregivers should be educated regarding the facts and goals of CT. Kalra and colleagues (6) recommended several strategies for potentially decreasing patient dose: 1) Perform only indicated CT scans. 2) Avoid multiphase protocols when possible. 3) Address clinical issues first. 4) Recommend follow-up CT scans only when necessary. 5) Adjust the CT technical parameters appropriately.
Although the 90-mAs head CT images were approximately 22% noisier than the corresponding 170-mAs images, all reviewers noted that the low-dose scans were of acceptable diagnostic quality for routine imaging indications. In an adult population, such indications include serial follow-up scanning, as is often performed in inpatients with gross imaging findings that may change during the course of admission and affect management decisions. Traumatic (or nontraumatic) intracranial hemorrhage, aneurysm rupture, stroke, hydrocephalus, and other conditions requiring a patient’s admission to a NICU are just a few of the diseases that may occur in young adults and that might reasonably be followed up by using a 90-mAs technique. Although the minimal increase in image noise at 90 mAs did not represent a critical impediment to routine diagnosis, recommending a low-mAs technique for initial workup is likely inappropriate at present, especially without further study of potentially subtle pathologic findings (eg, lacunar infarctions) (12). It is noteworthy that our objective measurements were not significantly different between the 90- and 170-mAs images, with regard to GM-WM conspicuity. This is typically a far more subtle distinction in terms of the difference in Hounsfield units than is the conspicuity of most lesions. In terms of radiation dose, we estimate that examinations performed at 90 mAs resulted in an exposure of approximately 3.4 rad, whereas standard head CT performed at 170 mAs resulted in approximately 6.5 rad. Once again, this was a considerable difference, especially for young NICU patients who may be undergoing serial scans over a relatively short period.
Similar experience with thoracic CT scanning has shown that reducing the tube current from a standard value of 280 mAs to below 120–160 mAs results in a perceptible decrease in image quality but that values of 160 mAs or greater yield interpretable images (13). A recent cadaveric study by Cohnen and colleagues has shown that, by varying mAs and kVp, the dose can be reduced by as much as 40% without a perceptible loss of image quality and by as much as 75% without a significant loss of diagnostic ability (12). Although it may be inappropriate to extrapolate these results to living patients in clinical practice, it appears reasonable that the radiation dose can be decreased to some degree without compromising diagnostic ability (14). Kalra and colleagues (6) have similarly reported that a 50% reduction in abdominal CT dose (achieved by lowering mAs) also results in images of diagnostic quality, except for a small number of very obese patients. In low-dose head CT, the analogous situation is a thickened calvarium, which can occur with conditions such as Paget disease or chronic use of Dilantin, though none of our scans were affected by this limitation.
The goal of radiologic imaging is accurate, timely, and clinically relevant diagnosis. Any evaluation of varying the mAs setting should therefore consider the optimization of other scanning parameters, some of which are less obviously related to dose than mAs is (13). Along these lines, Jones and colleagues (15) noted that multidetector-row CT may be preferred to single-detector-row CT imaging of the posterior fossa, a site frequently noted by neuroradiologists to be diagnostically challenging. Nonhelical CT scanning may also provide less image noise in the posterior fossa (12). Hamberg and colleagues (11) recently reported that, if attention is paid to parameter modification, multisection CT does not necessarily require more radiation than single-section scanning.
Our study has limitations. It rapidly became apparent during image review that the interpreting radiologists could routinely distinguish the 90-mAs scans from the 170-mAs scans. Therefore, blinding to the mAs value of each image was unsuccessful. However, this potential bias was unlikely to be important, as both the qualitative and quantitative results confirmed that any reduction in structural conspicuity was inconsequential and that the increase in image noise was mild to moderate. However, because we did not explicitly address image quality for specific pathologic processes, some small- or low-contrast lesions (eg, lacunar or subtle cortical infarcts or petechial or subtle subarachnoid hemorrhages) might not be as well seen with the reduced-mAs technique. Similarly, 90 mAs may not be appropriate for initial screening examinations in the emergency department. This topic would clearly benefit from further investigation; indeed, the potential effect of dose reduction on ultimate patient outcome is an important but difficult-to-study area for future research. The detection of low-contrast lesions may require minimized noise examinations, despite adequate conspicuity with reduced-mAs scanning (10). Another limitation of our study is its generalizability. Our patient cohort may not reflect the average group receiving head CT scans routinely; it was chosen on the basis of age criteria and the fact that they had previously diagnosed malignancies. Thus, this cohort were perceived as having a minimal potential long-term risk from the minimal (but nonzero) additional radiation exposure required by our study design.
Future investigations may also include the evaluation of automatic, or smart, mAs systems, that vary the CT tube current on the basis of the patient’s body habitus, as defined by the scout image (16). Because applying adult scanning parameters to children is unnecessary, mAs might also be further reduced according to patient weight or age (17). In 2001, Brenner and colleagues (17) reported estimated lifetime cancer mortality risks of 0.18% for pediatric abdominal CT and 0.07% for pediatric head CT, both of which are approximately 10 times the risks in adults. Nickoloff and Alderson (8) suggested that this estimate should be increased by a factor of 2. Although these results are debatable, the motivation to limit diagnostic radiation exposure in adult and pediatric patients alike remains of paramount importance. In certain clinical circumstances and patient populations, a trade-off between reduced radiation dose and reduced image quality may be acceptable, without sacrificing diagnostic accuracy. Low-dose head CT may be appropriate when screening for all but the smallest lesions (eg, lacunar infarctions) is indicated or when routine follow-up of high-contrast findings (eg, gross hydrocephalus) is required. Hospitalized patients who require frequent serial scanning for neurologic or neurosurgical care may also benefit from low-dose scanning. Indeed, we have begun to use low-dose follow-up head CT in our NICU patients who are currently undergoing multiple weekly (or in some cases daily) examinations.
Conclusion
Although 90-mAs head CT images are moderately noisier than 170-mAs images, they may be of acceptable diagnostic quality for some routine clinical applications. Specifically, low-dose head CT scans might be especially well suited for use in younger patients or those in NICUs who undergo serial examinations over a short follow-up of known lesions, such as bleeds, hydrocephalus, or mass effect from strokes.
References
- 1.Rogers LF. Low-Dose CT. How are we doing? AJR Am J Roentgenol 2003;180:303. [DOI] [PubMed] [Google Scholar]
- 2.Tack D, Sourtzis S, Delpierre I, de Maertelaer V, Gevenois PA. Low-dose unenhanced multidetector CT of patients with suspected renal colic. AJR Am J Roentgenol 2003;180:305–311 [DOI] [PubMed] [Google Scholar]
- 3.Katz DS, Venkataramanan N, Napel S, Sommer FG. Can low-dose unenhanced multidetector CT be used for routine evaluation of suspected renal colic? AJR Am J Roentgenol 2003;180:313–315 [DOI] [PubMed] [Google Scholar]
- 4.Hidajat N, Wolf C, Nunnemann A, et al. Survey of conventional and spiral CT doses. Radiology 2001;2001:395–401 [DOI] [PubMed] [Google Scholar]
- 5.Vano E, Fernandez JM, Ten JI, Guibelalde E, Gonzalez L, Pedrosa CS. Real-time measurement and audit of radiation dose to patients undergoing computed radiography. Radiology 2002;225:283–288 [DOI] [PubMed] [Google Scholar]
- 6.Kalra MK, Prasad S, Saini S, et al. Clinical comparison of standard-dose and 50% reduced-dose abdominal CT: effect on image quality. AJR Am J Roentgenol 2002;179:1101–1106 [DOI] [PubMed] [Google Scholar]
- 7.Lev MH, Kulke SF, Sorensen AG, et al. Contrast-to-noise ratio in functional MRI of relative cerebral blood volume with sprodiamide injection. J Magn Reson Imaging 1997;7:523–527 [DOI] [PubMed] [Google Scholar]
- 8.Nickoloff EL, Alderson PO. Radiation exposures to patients from CT: reality, public perception, and policy [letter]. AJR Am J Roentgenol 2001;177:285–287 [DOI] [PubMed] [Google Scholar]
- 9.Slovis T. The ALARA concept in pediatric CT: myth or reality? Radiology 2001;221:559, discussion 559–561 [DOI] [PubMed] [Google Scholar]
- 10.McNitt-Gray MF. AAPM/RSNA physics tutorial for residents: Topics in CT; Radiation dose in CT. Radiographics 2002;22:1541–1553 [DOI] [PubMed] [Google Scholar]
- 11.Hamberg LM, Rhea JT, Hunter GJ, Thrall JH. Multi-detector row CT: radiation dose characteristics. Radiology 2003;226:762–772 [DOI] [PubMed] [Google Scholar]
- 12.Cohnen M, Fischer H, Hamacher J, Lins E, Kotter R, Modder U. CT of the head by use of reduced current and kilovoltage: relationship between image quality and dose reduction. AJNR Am J Neuroradiol 2000;21:1654–1660 [PMC free article] [PubMed] [Google Scholar]
- 13.Ravenel JG, Scalzetti EM, Huda W, Garrisi W. Radiation exposure and image quality in chest CT examinations. AJR Am J Roentgenol 2001;177:279–284 [DOI] [PubMed] [Google Scholar]
- 14.Spielmann AL, Heneghan JP, Lee LJ, Yoshizumi T, Nelson RC. Decreasing the radiation dose for renal stone CT: a feasibility study of single- and multidetector CT. AJR Am J Roentgenol 2002;178:1058–1062 [DOI] [PubMed] [Google Scholar]
- 15.Jones TR, Kaplan RT, Lane B, Atlas SW, Rubin GD. Single- versus multi-detector row CT of the brain: quality assessment. Radiology 2001;219:750–755 [DOI] [PubMed] [Google Scholar]
- 16.Dakins DR. Concerns about dose turn up the heat for CT vendors. Diagn Radiol 2002;June:29–35 [Google Scholar]
- 17.Brenner D, Elliston C, Hall E, Berdon W. Estimated risks of radiation-induced fatal cancer from pediatric CT. AJR Am J Roentgenol 2001;176:289–296 [DOI] [PubMed] [Google Scholar]