

Abstract
BACKGROUND AND PURPOSE: Our goal was to compare the sensitivity of CT and three MR sequences in detecting and categorizing early (48 hours) hemorrhagic transformation (HT) in hyperacute ischemic stroke.
METHODS: Twenty-five consecutive patients with hyperacute ischemic stroke (<6 hours) without MR signs of cerebral bleeding at admission were included. Twenty-one underwent thrombolytic therapy. A standardized follow-up protocol, performed 48 hours after admission, combined brain CT scan and MR examination (1.5 T) including fast spin-echo-fluid-attenuated inversion recovery (FSE-FLAIR), echo-planar spin-echo (EPI-SE) T2-weighted, and EPI-gradient-recalled echo (GRE) T2*-weighted sequences. Both CT scans and MR images were obtained within as short a time span as possible between techniques (mean delay, 64 minutes). CT scans and MR images were independently rated as negative or positive for bleeding and categorized for bleeding severity (five classes) by two blinded observers. Prevalence of positive cases, intra- and interobserver agreement, and shifts in bleeding categorization between respective modalities and sequences were assessed.
RESULTS: Twelve patients (48%) were rated positive for HT on the basis of findings of at least one technique or sequence. From this subset of bleeding patients, seven (58%) had positive CT findings, nine (75%) had positive FSE-FLAIR and EPI-SE T2-weighted findings, and 12 (100%) had positive EPI-GRE T2*-weighted findings. CT had lower intra- and interobserver agreement for positivity than did MR imaging. Among the seven patients with positive CT and MR findings, only two had convergent ratings for bleeding category based on findings of two modalities. The five remaining had upward grading from CT to MR, which varied according to pulse sequence.
CONCLUSION: MR imaging depicted more hemorrhages and had higher intra- and interobserver agreement than did CT. The EPI-GRE T2*-weighted sequence demonstrated highest sensitivity. Equivocal upward shifts in bleeding categorization were observed from CT to MR imaging and between MR images.
Large-scale clinical trials have demonstrated the value of thrombolytic therapy by using recombinant tissue plasminogen activator in selected cohorts of patients with hyperacute ischemic stroke (1–4). Since such an intervention may also increase the likelihood for hemorrhagic transformation (HT), some physicians are reluctant to embark on such therapy, because they may equate HT with worsening neurologic outcome. The degree to which CT actually depicts HT varies among studies (approximate range, 6–43%) and using CT for that purpose probably underscores the true incidence of post-ischemic stroke HT as established from autopsy studies (approximate range, 50–70%) for embolic events (5–7). Therefore, CT seems limited for that purpose despite its axiomatic criterion-standard status. In small-scale studies, the sensitivity of MR imaging was similar or even better to that of CT in detecting primary or secondary intracranial hemorrhage in patients with acute stroke (8–12). We therefore compared the sensitivity of CT and of three MR sequences for early HT detection in a cohort of 25 consecutive patients with ischemic stroke. Shifts in bleeding categorization assessed by CT findings versus those of three MR imaging techniques were investigated by using as a reference the pioneering CT-based HT categorization system as used by the European Cooperative Acute Stroke Studies (ECASSs; 2, 3).
Methods
Study Population
The study population consisted of 25 consecutive patients who were admitted to our institution within 6 hours of the acute onset of stroke and presented with nonhemorrhagic ischemic brain damage at MR workup (including diffusion-weighted imaging) between January and September 2002. According to local institutional guidelines, patients were considered either for thrombolytic therapy (by using recombinant tissue plasminogen activator [rt-PA]), or for inclusion in the 3rd International Stroke study (IST-3) protocol (a blind comparison between rt-PA and placebo), or for antiplatelet prophylactic treatment (combining acetyl salicylic acid and low-dose low-molecular heparinoids) if thrombolytic therapy was contraindicated. Eleven patients admitted within 3 hours after symptom onset received intravenous thrombolysis. Ten patients admitted within 3–6 hours had local intra-arterial thrombolysis. One patient was randomly selected for the IST-3 protocol. Three patients received antiplatelet prophylactic treatment.
Imaging Protocols
Standardized follow-up cranial CT and MR imaging were performed 48 hours after admission. The examinations were performed within the shortest delay between the two modalities (mean, 64 minutes; range, 24–96 minutes) to detect and categorize HT. All CT examinations were performed on the same MX8000 DUAL system (Philips Medical Systems, Best, the Netherlands) by using a similar protocol of sequential acquisition of 24–28 contiguous sections to cover the whole brain with the following parameters: field of view, 250 mm; matrix, 512 × 512; section thickness, 5 mm (2.5 mm after defusioning, if needed); kilovolts, 120; milli Amfires/second, 300; rotation time, 0.75 second; soft-tissue filter; optimized window width; and level for each case (usually around 100H and 35H, respectively). All MR examinations were performed on the same Signa Echospeed 1.5-T system (General Electric Medical Systems, Milwaukee, WI) equipped with echo-planar capabilities. A similar protocol was used in all patients, including the three following sequences, acquired in the axial transverse plane: fast spin-echo-fluid-attenuated inversion recovery (FSE-FLAIR): TR, 10,000 ms; TE, 135 ms; TI, 2200 ms; NEX, 1; matrix, 256 × 160; echo-planar imaging-spin-echo (EPI-SE) T2-weighted: TR, 4500 ms; TE, 91.5 ms; NEX, 1; matrix, 96 × 64; and EPI-gradient-recalled echo (GRE) T2*-weighted: TR 4200, ms; TE, 50 ms; NEX, 3; matrix, 128 × 128. The EPI-SE T2-weighted sequence was the b = 0 s/mm2 acquisition of a diffusion-weighted EPI-SE sequence including a second acquisition at b = 1000. Similar section locations determined by using the AC-PC line as reference were reproduced for CT and MR imaging to allow accurate comparison between images at the same level.
Data Collection and Processing
All follow-up CT and MR examinations were transferred to an off-line Ultra 60 Creator 3D workstation (Sun Microsystems, Mountain View, CA) for analysis. The study coordinator (M.-C.A.) randomly selected the CT examinations and the MR images, which were scored by two trained neuroradiologists (G.C., T.D.) blinded to the clinical and administrative data, including patients’ names and examination dates. The study coordinator ensured complete random shuffling of all examinations during the scoring sessions, alternating CT and MR scorings, independent scoring sessions by the two observers, and more than a 2-week delay between respective scorings of an individual by the same observer. The two observers rated CT and MR findings as negative or positive for cerebral bleeding on the basis of the following: abnormally hyperattenuated areas (CT) and abnormally hypointense areas (MR). When findings were positive, the images were scored according to the following scale used by the ECASS (2, 3):
H0: no hemorrhage detected
HI1: hemorrhagic infarct category 1—small petechiae along the periphery of the infarct
HI2: hemorrhagic infarct category 2—confluent petechiae within infarct area, but no space effect
PH1: parenchymatous hemorrhage category 1—blood <30% of infarct area, may have slight space effect
PH2: parenchymatous hemorrhage category 2—blood >30% of infarct area, substantial space effect
Scores were displayed on a worksheet in which patients were listed according to random numbering. After the initial double-blinded data collection, each observer was independently informed of his results and asked to perform a third definitive scoring in case of discrepancy. After completing intraobserver consensus, both observers together reviewed all examinations to achieve final interobserver consensus.
Results
Intra- and interobserver variability was larger with CT than with MR imaging (Table). Cohen’s kappa test of reliability was 0.78 for intraobserver I and 0.75 for intraobserver II agreements and 0.57 for interobserver agreement for CT. FSE-FLAIR and EPI-GRE T2*-weighted interpretations demonstrated perfect fit (all kappa values = 1), whereas EPI-SE T2-weighted interpretation was slightly divergent (kappa 0.83 [intraobserver I], 0.91 [intraobserver II], and 0.91 [interobserver] [Table 1]). Following interobserver consensus, 12 patients (48%) had detectable HT. The overall positivity in this subset reached 100% “sensitivity” for EPI-GRE T2*-weighted, 75% for FSE-FLAIR and EPI-SE T2-weighted, and a mere 58% for CT images. These observations suggest that EPI-GRE T2*-weighted depicts more HT than do other techniques, although the false-negative rate remains unknown because of the lack of a reference diagnostic tool for HT. Observers showed less variability and more sensitivity in detecting HT on the basis of MR findings versus those of CT, which clearly suggests a more robust reliability of MR imaging interpretation. Regarding categorization of cerebral bleeding, minor discrepancies between intraobserver scoring sessions suggested true variation and learning effect. Consensual interobserver agreement was therefore preferred for categorical analysis. Only one subject was rated HI1, most of the remaining being rated HI2. Only one case was rated PH2 on the basis of EPI-GRE T2*-weighted findings, but not on those of FSE-FLAIR or EPI-SE T2-weighted imaging (Fig 1). An upward shift to more severe bleeding categories was clearly observed with the use of the EPI-GRE T2*-weighted sequence (Figs 1 and 2). In five of 12 patients with positive findings, MR imaging converted a negative CT score for HT into a positive one. Two patients were rated positive for HT on the basis of all three MR imaging findings, but three were rated positive only on the basis of EPI-GRE T2*-weighted findings, with FSE-FLAIR and EPI-SE T2-weighted findings rated negative (Fig 2). In the remaining seven patients with positive CT and MR findings, two had similar ratings by using both modalities, four had a one-category upward shift from CT to MR imaging, and one had a two-category upward shift with a similar HI2 rating based on CT and FSE-FLAIR findings, but a PH1 rating based on EPI-SE T2-weighted findings, and a PH2 rating based on EPI-GRE T2*-weighted findings (Fig 1).
Intra- and interobserver consensus for CT and MR sequences
| CT | FSE-FLAIR | EPI-SE T2 | EPI-GRE T2* | |
|---|---|---|---|---|
| Observer 1: | ||||
| First session | 6 | 9 | 9 | 12 |
| Second session | 6 | 9 | 11 | 12 |
| Consensus | 8 | 9 | 9 | 12 |
| Intraobserver 1 kappa | 0.780702 | 1 | 0.834437 | 1 |
| Observer 2: | ||||
| First session | 6 | 9 | 8 | 12 |
| Second session | 4 | 9 | 9 | 12 |
| Consensus | 4 | 9 | 8 | 12 |
| Intraobserver 2 kappa | 0.752475 | 1 | 0.911032 | 1 |
| Interobserver consensus | 7 | 9 | 9 | 12 |
| Interobserver kappa | 0.576271 | 1 | 0.911032 | 1 |
Note.—Table lists for each pulse sequence the number of patients (roman) considered positive at each individual scoring session, together with the Cohen’s kappa coefficient of agreement (italic) for each session.
Fig 1.
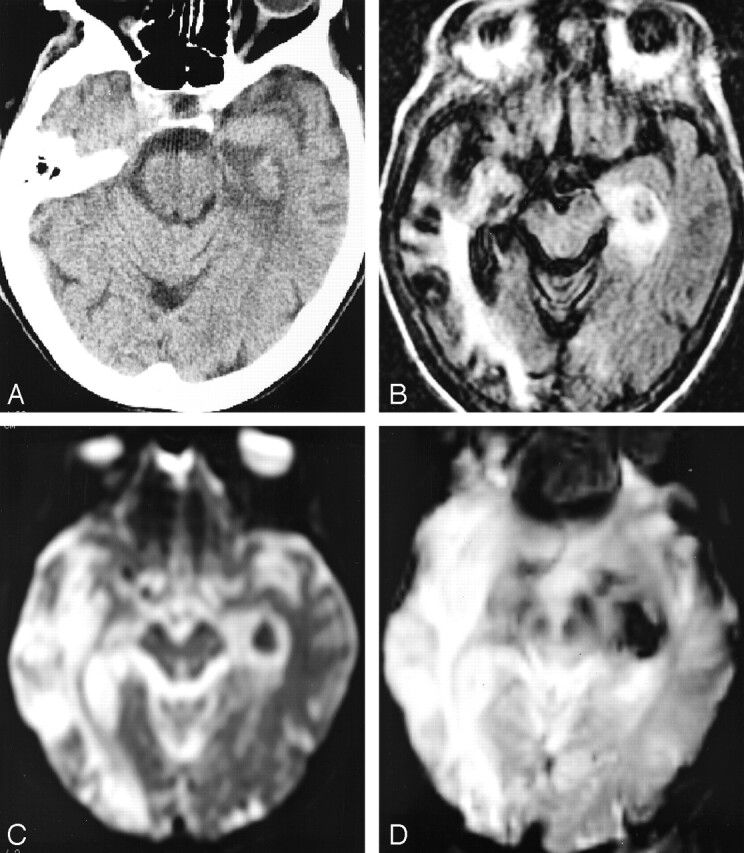
Increased conspicuity of HT and upgrade in bleeding categorization at 24 hours by using the different sequences. The patient is a 75-year-old woman admitted 24 hours previously for aphasia, right hemiparesis, and right conjugate ocular deviation who was treated by a combination of 450 mg ASA and low-dose low molecular heparinoids.
A, Axial CT scan, showing an ambiguous isoattenuated area within infarcted left PCA territory, which was ultimately rated as “HI1” after extended debate. The hemorrhagic area displays a similar attenuation as the normal parenchyma raising the hypothesis of spared tissue rather than petechial HT. Consensual interobserver rating of “HI2” was retained.
B, FSE-FLAIR image, showing punctuate hypointense foci confirming petechial hemorrhage and the “HI2” rating.
C, EPI-SE T2-weighted image, demonstrating homogeneous, round hypointense area rated as “PH1” because of the clotlike aspect of the bleeding, without mass effect but with the presence of a surrounding hyperintense ring of ischemic tissue.
D, EPI-GRE T2*-weighted image, demonstrating enlargement of the hemorrhagic area resulting in “PH2” rating since the hypointense artifact had recovered the ring of hyperintense ischemic tissue seen on FSE-FLAIR and EPI-SE T2-weighted images (previous views), thereby filling the theoretical >30% of infarct area criterion for “PH2” rating.
Fig 2.

EPI-GRE T2*-weighted sequence as the only positive technique for the 24-hour detection of post-thrombolytic petechial hemorrhage in an 86-year-old man admitted 24 hours previously and treated with 58 mg r-tPA IV 110 minutes after the onset of a left hemiplegia (NIH stroke score on admission, 13).
A, CT scan, showing a large acute hypoattenuated area within the MCA territory without sign of fresh blood extravasation.
B, FSE-FLAIR image, showing uniform hyperintensity within the ischemic area without hypointense hemorrhagic focus.
C, EPI-SE T2-weighted image, showing similar findings of positivity for ischemia and negativity for HT as in previous 3B image.
D, EPI-GRE T2*-weighted image, showing hypointense susceptibility artifact within both putamen and globus pallidus, revealing confluent petechiae. The extravasation was rated “HI2.”
Discussion
The main purpose of our study was to compare the sensitivity of CT and MR imaging in detecting 48-hour HT in a series of consecutive patients withhyperacute ischemic stroke, most of whom had received thrombolytic therapy. Results were unequivocal: CT disclosed a mere seven cases, whereas MR imaging depicted HT in 12. Moreover, MR imaging-based HT detection had greater reliability than did CT, with higher intra- and interobserver agreement (Table). Greater variability in CT interpretation mainly occurred for subtle punctuate foci exhibiting iso- or slight hyperattenuation within damaged hypoattenuated areas (Figs 1A and 3A). Whether isoattenuation reflected either light petechial HT or relative focal tissue “sparing” by the ischemic process, it accounted for the main discrepancies in both intra- and interobserver agreements. On each occasion, a focal tissue “sparing” was speculated on CT scans, and the EPI-GRE T2*-weighted images demonstrated the presence of deoxyhemoglobin within the involved areas (Figs 1D and 3B). Therefore, we advocate, as have others, the use of MR imaging for detecting HT because it is more sensitive and more reliable than CT (13).
Fig 3.
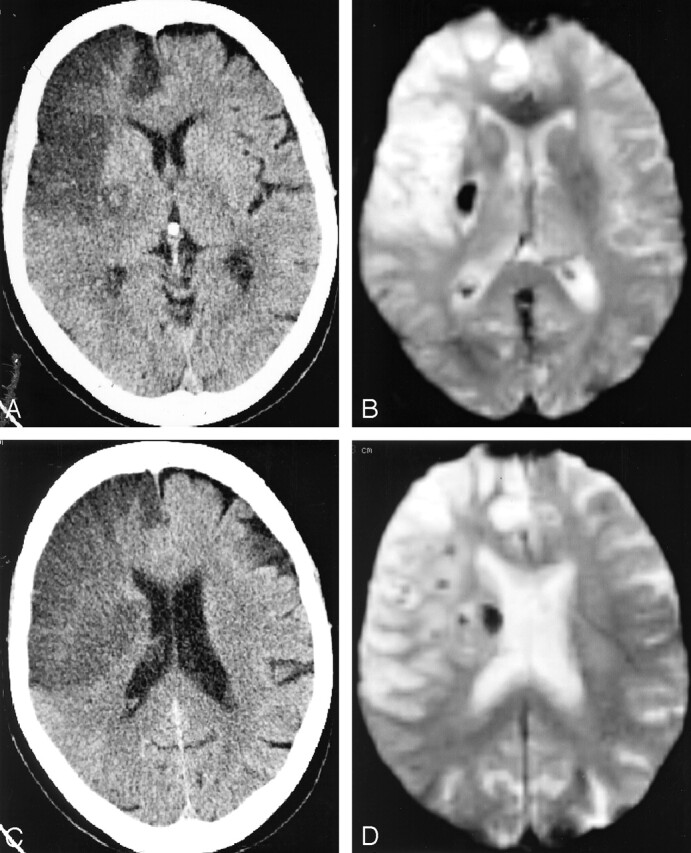
Discrepancy in CT and MR results between infarcted subareas in a 74-year-old woman admitted 24 hours previously and treated by 67 mg of rt-PA administered intravenously 185 minutes after the sudden onset of a left hemiplegia (NIH stroke score on admission, 14)
A, axial CT scan through the thalamic level shows a round area of isoattenuation relative to normal brain surrounded by ischemic edema within the lenticulate nucleus, which was rated confluent petechial “HI2” after intra- and interobserver controversies (similar to the previous case).
B, EPI-GRE T2*-weighted MR image in the similar location as Fig 2A, confirming the presence of freshly extravasated blood.
C, Axial CT scan through an upper level, showing homogeneous ischemic hypoattenuation without hyperattenuated focus suggesting HT.
D, EPI-GRE T2*-weighted MR image in the similar location as Fig 2C, disclosing unsuspected subependymal hemorrhagic focus.
Another aim of our survey was to determine which sequence—FSE-FLAIR, EPI-SE T2-weighted, or EPI-GRE T2*-weighted—was more sensitive for HT detection. Results, expectedly, demonstrated higher sensitivity of EPI-GRE T2*-weighted, which depicted all positive cases (n = 12). FSE-FLAIR and EPI-SE T2-weighted imaging depicted only nine cases. Figure 3 exemplifies a case in which HT was diagnosed exclusively on the basis of EPI-GRE-T2*-weighted findings. Contrary to CT, the intra-and interobserver agreements were excellent for EPI-SE T2-weighted imaging and ideal for FSE- FLAIR and EPI-GRE T2*-weighted imaging (Table). We therefore consider the monitoring of patients with acute stroke in the early post-therapeutic period by using the EPI-GRE-T2* sequence as the most sensitive option for detecting HT, the diffusion-weighted SE images (b = 0) depict fewer cases of HT despite the use of the EPI technique.
HT detection by using radiologic modalities suffers from a significant limitation; namely, the lack of a definitive standard for positive diagnosis of intracranial hemorrhage (ICH) (14), precluding the calculation of true sensitivity and specificity for different sequences. To compensate for this, two trained neuroradiologists (G.C., T.D.) twice rated the images as positive or negative for HT in a blinded way. The high sensitivity of CT in detecting freshly extravasated blood within brain and CSF has been widely highlighted, and for decades it was considered an axiomatic radiologic criterion standard for ICH detection (15). We confirm the obsolescence of this radiologic sign since the advent of highly susceptible MR images. Investigators have emphasized that the incidence of HT in CT studies of embolism varied from <10% to >43%, a lower range than the 50–70% range recorded in autopsy series (5, 6, 16, 17). Although early SE MR imaging appeared deceptive in depicting extravasated blood; the availability of gradient-recalled pulse sequences increased its sensitivity by disclosing susceptibility artifacts due to hemoglobin deoxygenation (18). Ultrasensitive susceptibility-weighted EPI has demonstrated its exquisite sensitivity for deoxygenated hemoglobin detection. Patel et al (8) first reported the EPI-GRE T2*-weighted appearance of primary ICH in six patients with stroke examined between 2.5–5 hours after the onset of symptoms; no hematoma was missed in their series of 35 patients of whom the subset of six ICH patients had been substracted. Linfante et al (9) reported similar observations, but within a 23–120-minute delay after stroke onset. Schellinger et al (10) demonstrated a similar accuracy of CT and MR imaging in assessing primary ICH within 6 hours but highlighted the hematoma size overestimation by using the EPI-GRE T2*-weighted sequence when compared with the CT-calculated volume.
Our study clearly confirmed both the higher sensitivity of EPI-GRE T2*-weighted imaging in detecting freshly extravasated blood and the increased risk for blood volume overestimation by using the sequence (Fig 1). This potential bias in bleeding categorization by using MR imaging constitutes a limitation for accurately evaluating the true incidence, severity, and clinical relevance of HT. Pessin et al (16) highlighted the undeleterious occurrence of HT in the natural history of ischemic stroke and advocated the pathologic distinction between HIs, referring to petechiae, and parenchymal hematoma (PH) referring to a solid clot of blood with mass effect, to imaging studies. An empirical CT-based five-step categorization scale for bleeding severity was thereafter used in ECASS trials I and II (2, 3). In a recent meta-analysis of the ECASS database, authors using this scale demonstrated that only PH2 was associated with increased risk of neurologic worsening and death and, furthermore, that HI was actually a marker for early successful recanalization of the occluded vessel, leading to reduced infarct size and improved clinical outcome (19–22). Conclusions drawn from MR imaging-based categorization may, however, differ from those drawn from a CT-based one, because shifts in bleeding categorization may be observed from CT to MR and between MR images. We attempted to apply the CT-based scale to MR imaging and found upward shift from CT to MR imaging in five cases and between the MR images in two. As expected, the higher grades were reached by using the EPI-GRE T2*-weighted sequence because of increased susceptibility artifacts (Figs 1–3), resulting in possible overestimation of extravasated blood volume by converting petechiae into an artifactual clotlike hematoma, as in the case illustrated by Figure 1. Thus far, the combination of EPI-GRE T2*-weighted imaging with another less susceptibility-sensitive sequence for detecting and categorizing is advisable for designing future trials involving MR imaging for post-thrombolytic HT screening. To avoid misinterpretation of data from different centers, consensus should be reached on HT categories on the basis of MR findings; images should be evaluated qualitatively and quantitatively. There are other potential biases regarding the use of MR imaging to evaluate post-thrombolytic cerebral status. Patients with acute ischemic stroke may have had previous punctiform hemorrhagic events resulting in chronic parenchymal microbleeds. These appear on pretherapeutic EPI-GRE T2*-weighted images as small hypointense foci because of the presence of hemosiderin. In the absence of pretherapeutic images, these hemosiderin-containing sequellae could be mistaken for acute deoxyhemoglobin-containing HT foci in the early post-therapeutic period. Recent data suggest that EPI-GRE T2*-detectable chronic microbleeds are a potential predictor of increased risk for post-thrombolytic HT (23–25). Thus far, pretherapeutic EPI-GRE T2*-weighted images may achieve two purposes if the latter concept was validated: first, as reference imaging for post-thrombolytic EPI-GRE T2*-weighted interpretation and, second, for old microhemorrhagic foci detection as potential contraindication for thrombolysis. The availability for comparison of pretherapeutic susceptibility imaging would result in a dramatic decrease in false-positive rate when interpreting post-therapeutic images.
Finally, the growing availability of 3-T MR systems may have a major impact on HT detection and categorization, because an increase in B0 value also increases deoxyhemoglobin- and hemosiderin-related susceptibility artifacts, leading to enhanced sensitivity to micro-HT, but also to additional overestimation of the bleeding category (26). Further clinical outcome studies are warranted to determine whether more sensitive HT detection could influence therapeutic strategy and, subsequently, clinical outcome. Our results confirm the advantage of MR imaging over CT in terms of sensitivity, with direct relevance for clinical research methodology, with the knowledge that current guidelines for treating acute stroke recommend changes in therapeutic options only for PH2 HT, thereby rendering irrelevant the categorization shifts within the HI1/HI2/PH1 range.
In conclusion, susceptibility-weighted MR imaging techniques should be preferred over CT as follow-up imaging for early HT detection of hyperacute ischemic stroke. The EPI-GRE T2*-weighted sequence is the most sensitive but potentially overestimates true blood extravasation. We propose the inclusion of EPI-GRE T2*-weighted imaging in the pretherapeutic MR workup and the combination of EPI-GRE T2*-weighted imaging to another less susceptible sequence in the post-therapeutic setting of hyperacute ischemic stroke.
References
- 1.The NINDS rt-PA Stroke Study Group. Tissue plasminogen activator for acute ischemic stroke. N Eng J Med 1995;333:1581–1587 [DOI] [PubMed] [Google Scholar]
- 2.Hacke W, Kaste M, Fieschi C, et al. Intravenous thrombolysis with recombinant tissue plasminogen activator for acute hemispheric stroke: the European Cooperative Acute Stroke Study (ECASS). JAMA 1995;274:1017–1025 [PubMed] [Google Scholar]
- 3.Hacke W, Kaste M, Fieschi C, et al. Randomised double-blind placebo-controlled trial of thrombolytic therapy with intravenous alteplase in acute ischaemic stroke (ECASS II). Lancet 1998;352:1245–1251 [DOI] [PubMed] [Google Scholar]
- 4.Liu M, Counsell C, Zhao XL, Wardlaw J. Fibrinogen depleting agents for acute ischaemic stroke. In: Cochrane Library Issue 2, Chichester UK: John Wiley and Sons, Ltd.,2004
- 5.Fisher CM, Adams RD. Observation on brain embolism with special reference to the mechanism of hemorrhagic infarction. J Neuropathol Exp Neurol 1951;10:92–94 [PubMed] [Google Scholar]
- 6.Jorgensen L, Torvik A. Ischemic cerebrovascular disease in an autopsy series. Part 2. Prevalence, location, pathogenesis, and clinical course of cerebral infarcts. J Neurol Sci 1969;9:285–320 [DOI] [PubMed] [Google Scholar]
- 7.Lodder J, Krijne-Kubat B, Broekman J. Cerebral hemorrhagic infarctions at autopsy: cardiac embolic cause and the relationship to the cause of death. Stroke 1986;17:626–629 [DOI] [PubMed] [Google Scholar]
- 8.Patel MR, Edelman RR, Warach S. Detection of hyperacute primary intraparenchymal hemorrhage by magnetic resonance imaging. Stroke 1996;27:2321–2324 [DOI] [PubMed] [Google Scholar]
- 9.Linfante I, Linas RH, Caplan LR, Warach S. MRI features of intracerebral hemorrhage within 2 hours from symptom onset. Stroke 1999;30:2236–2267 [DOI] [PubMed] [Google Scholar]
- 10.Schellinger PD, Jansen O, Fiebach JB, et al. A standardized MRI stroke protocol: comparison with CT in hyperacute intracerebral hemorrhage. Stroke 1999;30:765–768 [DOI] [PubMed] [Google Scholar]
- 11.Zaheer A, Ozsunar Y, Schaefer PW. Magnetic resonance imaging of cerebral hemorrhagic stroke. Top Magn Reson Imaging 2000;11:288–99 [DOI] [PubMed] [Google Scholar]
- 12.Nighoghossian N, Hermier M, Berthezène Y, et al. Early diagnosis of hemorrhagic transformation: diffusion/perfusion-weighted MRI versus CT scan. Cerebrovasc Dis 2001;11:151–156 [DOI] [PubMed] [Google Scholar]
- 13.von Kummer R. MRI: the new gold standard for detecting brain hemorrhage? Stroke 2002;33:1748–1749 [DOI] [PubMed] [Google Scholar]
- 14.Hoggard N, Wilkinson ID, Paley NI, Griffiths PD. Imaging of haemorrhagic stroke. Clin Radiol 2002;57:957–968 [DOI] [PubMed] [Google Scholar]
- 15.New PF, Aronow S. Attenuation measurements of whole blood and blood fractions in computed tomography. Radiology 1976;121:635–640 [DOI] [PubMed] [Google Scholar]
- 16.Pessin MS, Del Zoppo GJ, Estol CJ. Thrombolytic agents in the treatment of stroke. Clin Neuropharmacol 1990;13:271–289 [DOI] [PubMed] [Google Scholar]
- 17.Fischer CM, Adams RD. Observations on brain embolism with special reference to hemorrhagic infarction. In: Furlan AJ, ed. The heart and stroke. New-York: Springer-Verlag;1987. :17–36
- 18.Hayman LA, Tuber KH, Ford JJ, Bryan RN. Mechanisms of MR signal alteration by acute intracrebral blood: old concepts and new theories. AJNR Am J Neuroradiol 1991;12:899–907 [PMC free article] [PubMed] [Google Scholar]
- 19.Berger C, Fiorelli M, Steiner T, et al. Hemorrhagic transformation of ischemic brain tissue: asymptomatic or symptomatic? Stroke 2001;32:1330. [DOI] [PubMed] [Google Scholar]
- 20.Fiorelli M, Bastianello S, von Kummer R, et al. Hemorrhagic transformation within 36 hours of a cerebral infarct. Stroke 1999;30:2280–2284 [DOI] [PubMed] [Google Scholar]
- 21.Molina CA, Alvarez-Sabin J, Montaner J, et al. Thrombolysis-related hemorrhagic infarction: a marker of early reperfusion, reduced infarct size, and improved outcome in patients with proximal middle cerebral artery occlusion. Stroke 2002;33:1551–1556 [DOI] [PubMed] [Google Scholar]
- 22.von Kummer R. Brain hemorrhage after thrombolysis: good or bad? Stroke 2002;33:1446–1447 [DOI] [PubMed] [Google Scholar]
- 23.Kidwell CS, Saver JL, Carneado J, et al. Predictors of hemorrhagic transformation in patients receiving intra-arterial thrombolysis. Stroke 2002;33:717–724 [DOI] [PubMed] [Google Scholar]
- 24.Kidwell CS, Saver JL, Villablanca JP, et al. Magnetic resonance imaging detection of microbleeds before thrombolysis: an emerging application. Stroke 2002;33:95–98 [DOI] [PubMed] [Google Scholar]
- 25.Nighoghossian N, Hermier M, Adeleine P, et al. Old microbleeds are a potential risk factor for cerebral bleeding after ischemic stroke: a gradient-echo T2*-weighted brain MRI study. Stroke 2002;33:735–742 [DOI] [PubMed] [Google Scholar]
- 26.Coutts S, Frayne R, Sevick R, Demchuk A. Microbleeding on MRI as a marker for hemorrhage after stroke thrombolysis. Stroke 2002;33:1457–1458 [DOI] [PubMed] [Google Scholar]