Abstract
PURPOSE: We evaluated the impact of premature extrauterine life on brain maturation.
PATIENTS AND METHODS: Twelve neonates underwent MR imaging at 40 (39.64 ± 0.98) weeks (full term). Fifteen premature infants underwent 2 MR imaging examinations, after birth (preterm at birth) and at 40 weeks (41.03 ± 1.33) (preterm at term). A 3D MR imaging technique was used to measure brain volumes compared with intracranial volume: total brain volume, cortical gray matter, myelinated white matter, unmyelinated white matter, basal ganglia (BG), and CSF.
RESULTS: The average absolute volume of intracranial volume (269.8 mL ± 36.5), total brain volume (246.5 ± 32.3), cortical gray matter (85.53 mL ± 22.23), unmyelinated white matter (142.4 mL ±14.98), and myelinated white matter (6.099 mL ±1.82) for preterm at birth was significantly lower compared with that for the preterm at term: the average global volume of intracranial volume (431.7 ± 69.98), total brain volume (391 ± 66,1), cortical gray matter (179 mL ± 41.54), unmyelinated white matter (185.3 mL ± 30.8), and myelinated white matter (10.66 mL ± 3.05). It was also lower compared with that of full-term infants: intracranial volume (427.4 mL ± 53.84), total brain volume (394 ± 49.22), cortical gray matter (181.4 ± 29.27), unmyelinated white matter (183.4 ± 27.37), and myelinated white matter (10.72 ± 4.63). The relative volume of cortical gray matter (30.62 ± 5.13) and of unmyelinated white matter (53.15 ± 4.8) for preterm at birth was significantly different compared with the relative volume of cortical gray matter (41.05 ± 5.44) and of unmyelinated white matter (43.22 ± 5.11) for the preterm at term. Premature infants had similar brain tissue volumes at 40 weeks to full-term infants.
CONCLUSION: MR segmentation techniques demonstrate that cortical neonatal maturation in moderately premature infants at term and term-born infants was similar.
Brain maturation can be ideally studied with MR imaging; indeed, because of its capacity to detect water and fat in vivo,1–3 MR imaging allows reliable assessment of myelination4,5 and the establishment of a timetable for maturation and myelination of the developing brain in vivo.6
Different approaches for quantitation of human brain maturation with qualitative MR images have been previously chosen. These studies have used staging systems based on gray-scale contrast differences,7 relaxation time measurements,8,9 and specific myelination patterns in relation to age,5 as well as with spectroscopy.10 For the objective assessment of brain development, it is necessary to perform accurate measurement of specific cerebral tissue volumes. Volumetric analysis of MR imaging data sets is achieved by segmentation of the imaged volume into tissue types, followed by 3D reconstructions. Segmentation is the process wherein contours are constructed that divide the brain into representative structures of interest depending on their signal intensity (eg, gray matter, myelinated white matter, CSF) by using mathematic algorithms.
In contrast to the existence of numerous volumetric studies of the brain in both children and adult subjects,11–14 there are few data available concerning assessment of the neonatal brain by quantitative volumetric analysis of MR imaging. In prior studies, we have established an MR image segmentation technique that provides a quantitative assessment of neonatal brain tissue volumes15–19 and not simply qualitative information. The aim of the current study was to assess quantitative brain development in neonates, comparing moderately prematurely born infants and term-born infants with complete intrauterine development and to determine if after a period of extrauterine life, the intracranial volumes of both groups are similar.
Subjects and Methods
Subjects
Two groups of neonates were studied by MR imaging. The first group included 12 neonates born at term (full-term) (gestational age [GA], 38–41 weeks) who underwent 1 MR imaging examination. The second group included 15 prematurely born (preterm at birth) neonates (GA, 32.4 ± 1.34 weeks) who underwent MR imaging soon after birth with a follow-up examination at 40 weeks. We performed prospectively 36 MR examinations in a total of 27 children: 18 had only 1 examination (12 controls, 2 premature, and 4 premature infants at term) and 9 (premature neonates) had 2 MR imaging examinations.
The neonates were recruited from the Neonatology Unit of Children’s Hospital of the University Hospital in Bern. Infants included in the analysis had a normal standard neurologic examination by a specialized neonatologist and were free of cerebral pathology, such as intraventricular hemorrhage, ventriculomegaly, or white matter injury assessed by early sonography and the early MR imaging used in this study. All infants were started on enteral feeding, breast milk, and/or formula on the first or second day of life. The study was approved by the Human Subjects Research Committee of our hospital, and the parents provided written consent for the study.
No sedation was necessary for the MR imaging studies. The infants were positioned in the MR magnet in a vacuum fixation pillow and monitored by electrocardiography and pulse oximetry (Maglife, Bruker-Odam, Wissembourg, France). A neonatologist remained with the infant in the scanner room for the entire MR study.
MR Image Acquisition
MR imaging was performed with a 1.5T Signa System (GE Healthcare, Milwaukee, Wis). For the acquisition of the primary MR imaging data, we applied 2 different imaging techniques: a 3D Fourier transform spoiled gradient-recalled (SPGR) image (1.5-mm coronal sections; flip angle, 45°; TR/TE, 35/5 msec; field of view, 18 cm; matrix, 256 × 256) and a double-echo (proton attenuation and T2-weighted; proton attenuation images are important because they extract the intracranial contents from the whole image) spin-echo image (3-mm axial sections; TR/TEs, 3000/36, 162 msec; field of view, 18 cm; matrix, 256 × 256; interleaved acquisition). The voxel (volume of the pixel) dimensions for the SPGR acquisition were 0.7 × 0.7 × 1.5 mm, and for the spin-echo acquisition, 0.7 × 0.7 × 3.0 mm.
MR Image Processing
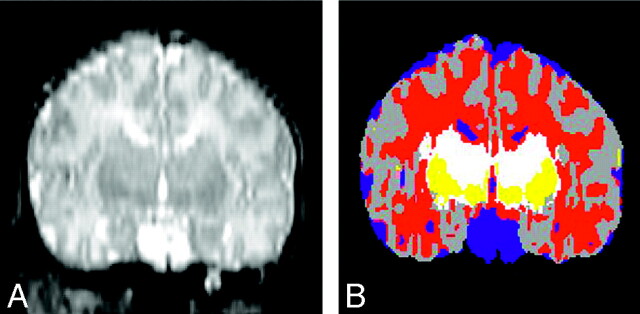
Postacquisition processing was performed on workstations (Sun Microsystems, Mountain View, Calif) with newly developed software.15,20,21 A sequence of image processing algorithms was used to segment each of the MR imaging sections into separate tissue classes: cortical gray matter, basal ganglia (BG)/thalamus, unmyelinated white matter, myelinated white matter, and CSF. The algorithm recognizes signal intensity characteristics of myelinated and nonmyelinated white matter on the basis of signal intensities on T1- and T2-weighted images; to recognize the intensities, an expert initially determined areas for the program. These algorithms were designed to reduce imaging system noise. They identify a linear transformation to align the double-echo spin-echo images with the SPGR images to form a 3-channel dataset. Afterward, there is a resampling of the double-echo spin-echo images according to this transformation. Finally tissue types are classified on the basis of the MR intensity in the 3 channels, by using a template-moderated classification, which adds to the statistical classification algorithm (K-Nearest Neighbor classification) an anatomic template registered to the initial classification. This approach allows classification of tissue not only according to signal intensity behavior but also according to anatomic localization. With this technique, anatomically different structures with similar image acquisition characteristics (pixel intensity) can be classified correctly (ie, subcortical gray matter and cortical gray matter). Quality control was performed both by 3 authors (A.Z., P.S.H., K.O.L.) independently and by using Slicer software (Massachusetts Institute of Technology Cambridge, Mass), in which simultaneous display of the T1-, T2-weighted MR imaging had to match the segmented image (Fig 1).
Fig 1.
Segmentation. Reconstructed coronal T2-weighted image on the left compared with the segmented image (on the right) by using the Slicer software. On the segmented image, gray matter is gray, CSF is blue, the BG are yellow, unmyelinated white matter is red, and myelinated white matter is white.
Statistical Analysis
Statistical analysis was performed to compare the volume of cerebral tissues between the groups by using analysis of variance (ANOVA, 1-way). A first ANOVA compared the 3 groups together; a second ANOVA compared preterm at birth and preterm at term infants. Finally a third ANOVA compared full-term infants and the preterm at term. Linear regression analysis was performed for testing volumetric changes in cerebral tissues during maturation between the 9 infants having 2 examinations. Statistical analysis was performed by using SPSS for Windows (SPSS Inc., Chicago, Ill).
Results
Quantitative volumetric analysis was performed at birth in 11 preterm infants, at term in 13 premature infants, and in 12 healthy term infants. Determination of individual volumes of total brain tissue, gray matter (cortical, BG, thalamus), white matter (unmyelinated and myelinated), and CSF was performed.
Total Intracranial Volume
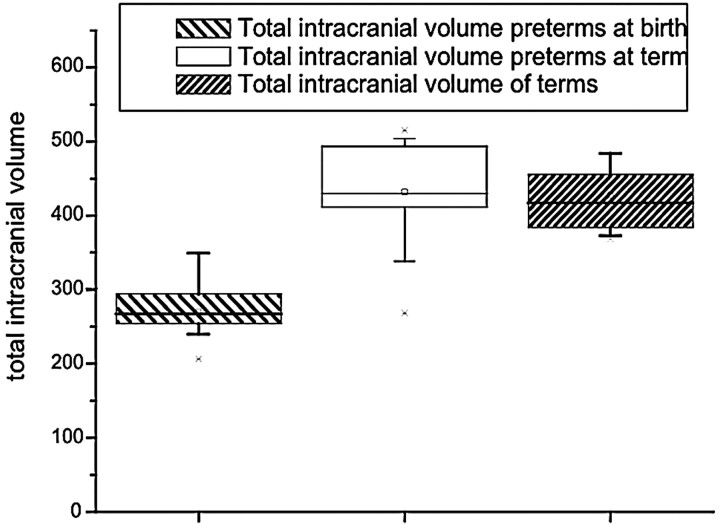
Total intracranial volume, comprising total brain volume and CSF, was significantly smaller in preterm at birth than in preterm at term and full-term infants. (ANOVA, F = 30.96; P < .001) (Table 1 and Fig 2). The linear regression analysis shows an increase of the total intracranial volume of 24.05 mL/week of gestational age from birth to term in preterm infants (P < .001) with an r = 0.88.
Results in newborns and premature babies
| PT (n = 11) |
PTT (n = 13) |
FT (n = 12) |
P (ANOVA, PT vs PTT vs FT) |
P (ANOVA, PT vs PTT) |
||||||
|---|---|---|---|---|---|---|---|---|---|---|
| Absolute Units (cm3) | Relative to ICV (%) | Absolute Units (cm3) | Relative to ICV (%) | Absolute Units (cm3) | Relative to ICV (%) | P Absolute Units | P Relative to ICV | P Absolute Units | P Relative to ICV | |
| ICV | 269.8 ± 36.5 | 431.7 ± 70.0 | 427.4 ± 53.8 | F = 31.0P < .001 | F = 47.6 P < .001 | |||||
| Total brain volume | 246.5 ± 32.3 | 391 ± 66.1 | 395 ± 49.2 | F = 30.2 P < .001 | F = 43.5 P < .001 | |||||
| CGM | 83.5 ± 22.2 | 30.6 ± 5.1 | 179 ± 41.5 | 41.0 ± 5.4 | 181.4 ± 29.3 | 42.4 ± 4.1 | F = 33.6 P < .001 | F = 23.1 P < .001 | F = 46.6 P < .001 | F = 23.1 P < .001 |
| UMWM | 142.4 ± 15.0 | 53.1 ± 4.8 | 185.3 ± 30.8 | 43.2 ± 5.1 | 183.4 ± 27.4 | 43.0 ± 4.4 | F = 10.1 P < .001 | F = 16.8 P < .001 | F = 17.6 P < .001 | F = 23.7 P < .001 |
| MWM | 6.1 ± 1.8 | 2.2 ± 0.5 | 10.7 ± 3.0 | 2.5 ± 0.8 | 10.72 ± 4.63 | 2.5 ± 1.0 | F = 7.0 P = .003 | F = 0.4 P > .1 | F = 18.8 P < .001 | F = 1.0 P > .1 |
| BG | 14.2 ± 4.2 | 5.4 ± 1.7 | 15.7 ± 5.7 | 3.7 ± 1.1 | 17.14 ± 4.39 | 4.0 ± 0.9 | F = 1.0 P > .1 | F = 5.8 P = .007 | F = 0.5 P > .1 | F = 8.6 P = .008 |
| CSF | 23.3 ± 9.6 | 8.6 ± 3.0 | 40.7 ± 21.2 | 9.5 ± 4.3 | 32.4 ± 11.0 | 7.5 ± 2.3 | F = 3.8 P = .03 | F = 1.0 P > .1 | F = 6.2 P = .02 | F = 0.4 P > .1 |
Note:—Fifteen premature babies had 2 MRIs, one after birth (PT) and one at 40 wks (PTT); 12 newborns had an MRI at 40 wks (FT). ICV indicates intracranial volume; CGM, cortical gray matter; UMWM, ummyelinated white matter; MWM, myelinated white matter; BG, basal ganglia; CSF, cerebrospinal fluid.
Fig 2.
Total intracranial volume. The preterm newborns at birth had a lower intracranial volume, but at term, they had a volume similar to that of the term neonates.
Total Brain Volume
Total brain volume was significantly different after the ANOVA test between the preterm at birth population and preterm at term and full-term (F = 30.18; P < .001) (Table 1). The global increase of the total brain volume was 21.62 mL/week (P < .001; r = 0.87).
Cortical Gray Matter
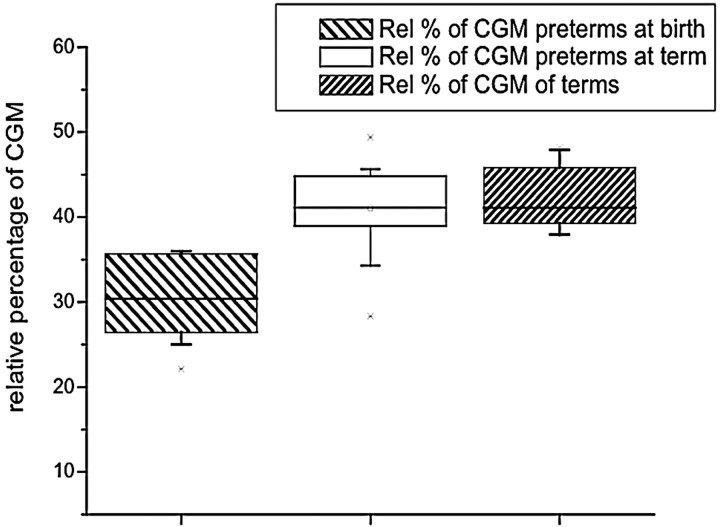
The absolute and relative cortical gray matter volume was significantly different (F = 46.60; P < .001) (F = 23.07; P < .001) between birth and term, respectively (Table 1 and Fig 3). The increase of absolute cortical gray matter volume was 14.17 mL/week of gestational age, which represents an average increase of 34%. We also found an increase in relative cortical gray matter volume of 1.5%/week (P < .001).
Fig 3.
Volume of cortical gray matter. The preterm infants at birth had a lower volume of cortical gray matter, but at term, they had a volume similar to that of the term neonates.
Unmyelinated White Matter
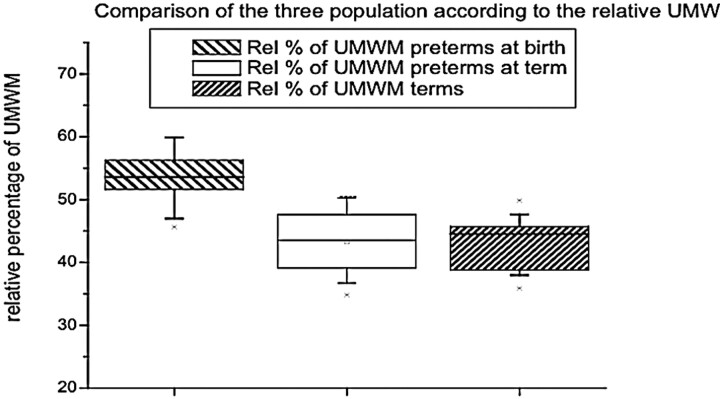
Unmyelinated white matter represented 53% of the whole volume at birth and 43% at term (Table 1). The absolute volume of unmyelinated white matter was significantly lower at birth than at term (F = 17.65; P < .001) (Table 1 and Fig 4). Absolute unmyelinated white matter volume increased at a rate of 0.66 mL/week (P < .001), but a decrease of the relative volume of unmyelinated white matter (−1.43%/week; P < .001) occurred as a result of a greater increase of the other intracranial structures in the time period we observed.
Fig 4.
Volume of unmyelinated white matter. The preterm neonates at birth had a lower volume of unmyelinated white matter, but at term, they had a volume similar to that of the term neonates.
Myelinated White Matter
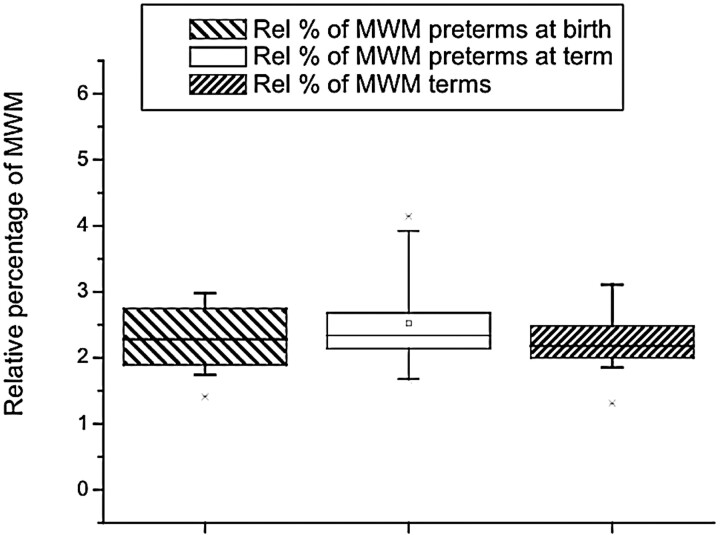
Myelinated white matter represented the smallest percentage of brain tissue volume in both populations. For the preterm population at birth, it represented 6.099 mL ± 1.8 and at theoretic term, 10.66 mL ± 3.05. The absolute volume of myelinated white matter was lower at birth than at term (F = 18.81; P < .001) (Table 1). Relative to the total brain tissue volume, the percentages at birth (2.25% ± 0.5) and at term (2.52% ± 0.8) were not significantly different (F = 1.03; P = .321) (Table 1 and Fig. 5). The absolute volume of myelinated white matter increased by 0.7 mL/week (P < .001), but no significant increase in relative myelinated white matter volume was observed.
Fig 5.
The relative volume of myelinated white matter showed no difference between preterms, preterms at term, and full-term infants
CSF
The absolute volume of CSF was largest in the preterm infants at term (23.33 mL ± 9.6 for preterm at birth; 40.66 mL ± 21.23 for preterm at term, and 32.4 mL ± 11.1 in full-term infants). The relative volumes of CSF were not significantly different (Table 1).
BG
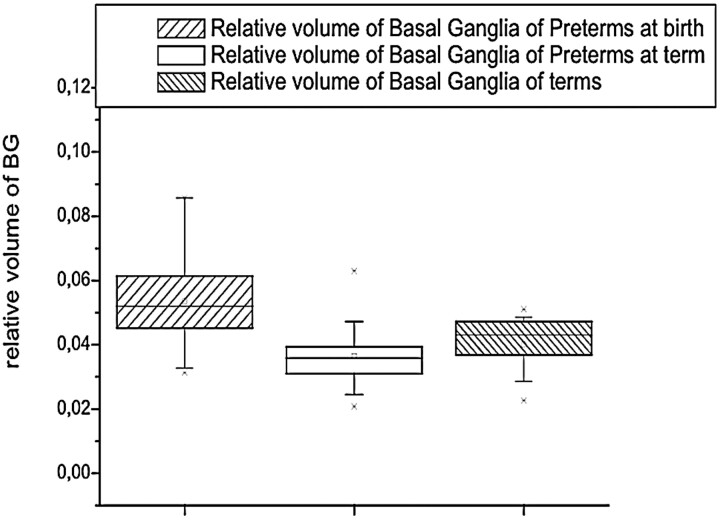
The absolute volumes of BG were not significantly different between the groups (F = 1.03; P = .37), whereas the relative BG volume was highest at birth (F = 5.77; P = .007) (Table 1 and Fig 6).
Fig 6.
The relative volume of BG was highest in preterms. Preterm infants at term and full-term infants had similar relative volumes of basal ganglia.
Comparison Between Term-Born Infants and Preterm Infants at Term
Term-born infants and preterm infants at term showed similar absolute and relative volumes of cortical gray matter, unmyelinated white matter, myelinated white matter, and CSF (P > .241) with F values between 0.00 and 1.45. We did not find any statistical difference comparing the relative volumes of cortical gray matter, unmyelinated white matter, myelinated white matter, and CSF between the term-born population and the term population (P > .18). F values were between 0.00 and 1.94.
When assessing effects of gestational age at birth on brain tissue volumes at term, we did not find any significant association. This relationship was tested with linear regression analysis. The correlation coefficient (r) varied between −0.50 and 0.18; the probability (t) of a relationship between gestational age at birth and term volume varied between −0.40 and 0.55 (P > .1197).
Discussion
This study demonstrates similar brain tissue volumes of moderately preterm infants assessed at term and term-born control infants by using quantitative MR image segmentation. In this early sequential MR imaging study, we were further able to determine brain growth in preterm infants from 32 to 40 weeks gestation.
Total intracranial volume, which represents both brain growth and growth of the intracranial cavity, increased by 24 mL/week, comparing the first and second examination in preterm infants. The total brain volume also increased by 22 mL/week. This is similar to the growth values determined by Hüppi et al15 in a cross-sectional study from preterm and term infants, born between 28 and 40 weeks’ gestation, who were studied at birth.
In their study of preterm infants at term and full-term control infants (intracranial volume), Inder et al19 reported a significant difference in brain volume when comparing very and extremely low–birth weight neonates with full-term control infants. In the current study of moderately preterm infants, the intracranial volume at term and total brain volume at term were not different from the intracranial volume and the total brain volume of full-term control infants. Inder et al studied preterm infants with a mean gestational age at birth of 27 weeks, whereas the gestational age of the current study population was 32 weeks. These findings indicate that the extrauterine growth of the intracranial cavity for moderately preterm infants is similar to the intrauterine growth.
Tolsa et al18 showed that in a population with a gestational age similar to the current study population, a significant decrease of the overall intracranial volume and cortical gray matter volume occurred in preterm infants born with intrauterine growth retardation. With normal intrauterine growth, a moderately preterm population had similar brain tissue volumes at term, compared with full-term controls.
Regarding the cortical gray matter, we found an increase of the global and the relative cortical volume from the first to the second examination at term, without any significant difference between the preterm population at term and the control full-term infants. Prior studies had shown reduced cortical gray matter volume at term in preterm infants with white matter injury16 and after perinatal corticosteroid treatment.17 In a more recent large cohort study of very low- and extremely low–birth weight infants, a reduction in cortical gray matter volume at term in the overall group of premature infants, including infants with cerebral pathology, was confirmed.19 The results of the current study clearly indicate that moderate premature birth (mean GA, 32 weeks) itself is not associated with any difference in cortical gray matter volume at term. In an earlier cross-sectional study, Hüppi et al15 showed a fourfold increase of cortical gray matter volume between 30 and 40 weeks of postconceptional age. In the current study, we show a twofold increase from the first to the second examination at term. These changes are probably influenced by the increase of the synaptic attenuation as well as the increase of the cortical foldings.22 Studies using diffusion-weighted imaging have shown a decrease of apparent diffusion coefficient in the cortical gray matter with age, indicating the decreased water content and the increase of cellular attenuation.23,24 The current results indicate that cortical cerebral maturation seems to be preserved after moderate prematurity.
The subcortical gray matter volume, comprising the BG (caudate, putamen, globus pallidus) and thalamus was similar between preterm infants at term and full-term control infants. This is in accordance with data by Inder et al,19who showed a reduction of subcortical gray matter volume at term correlating with early gestational age at birth. This effect was most pronounced for preterm infants with a gestational age at birth of less than 28 weeks and was aggravated by the presence of white matter injury. This finding was further correlated to the severity of respiratory illness and duration of ventilatory support. In the current study, none of the infants had significant respiratory illness or required ventilatory support. Again, moderate prematurity itself does not seem to alter subcortical gray matter volume at term.
Cerebral white matter during early human brain development undergoes important steps of maturation, including initiation of myelination, which alters MR imaging signal intensity. In the current study, quantification of cerebral white matter differentiates unmyelinated and myelinated white matter, as described in earlier studies.15,16,18,19 Unmyelinated white matter is the largest brain tissue volume at birth (53%) in premature infants, whereas at term and in full-term infants, cortical gray matter volume represents the largest brain tissue volume. In absolute value, unmyelinated white matter still increases from the first to the second examination, but its relative volume will decrease, representing the normal maturational process of myelination and increased cortical development. No differences were noted in our study between the volume of unmyelinated white matter at term in preterm infants and in full-term infants, again indicating that moderate prematurity itself does not affect normal white matter maturation. The integrity of the white matter is of critical importance for the long-term neurologic or cognitive outcome in preterm infants.25 Inder et al19 showed that very premature infants (27 +/ 2.4 weeks) have a high incidence of white matter injury at term-equivalent age, which correlates with later neurodevelopmental problems. For example, neurodevelopmental delay and cerebral palsy are associated with a delay in myelination of the cerebral white matter.26–29
MR imaging is the only in vivo technique that can differentiate myelinated and unmyelinated white matter in the developing brain. Active myelination starts in the third trimester of pregnancy30,31and continues throughout the first years of life. Because of quantitative MR imaging with image analysis tools, quantitative assessment of myelination has become possible.15 In the current study, we demonstrate significant increase in volume of myelinated white matter from the first to the second examination in preterm infants, with no difference in the absolute amount of myelinated white matter at term in preterm infants compared with full-term infants. In earlier studies assessing preterm infants with white matter injury, myelinated white matter was decreased at term age; this decrease indicates a reduction in myelination in preterm infants with prior brain injury.16 Prematurity itself was not associated with significant reduction in myelinated white matter; this finding is also in accordance with a larger recent study19 in which immaturity alone did not affect myelinated white matter volume at term.
In a cross-sectional study of brain development,15 CSF has been shown to decrease with gestational age. In the presence of brain injury and reduction of cerebral tissue, CSF is increased, both with enlargement of the ventricles as well as with enlargement of the subarachnoid spaces.16,32 As shown by Nosarti et al,33 these changes in CSF volume, which reflect a certain cerebral atrophy, can persist until adolescence. In our population, there was no difference in the relative CSF volumes between term and preterm neonates. Absolute volume of CSF was highest in preterm infants at term, which might be related to increased CSF in extracerebral spaces
The data reported here indicate that moderate prematurity itself, in the absence of intrauterine growth restriction and perinatal brain injury, does not alter cerebral tissue volumes at term, compared with full-term neonates. Overall structural cerebral maturation assessed by quantitative MR imaging with advanced image analysis is not affected by moderate prematurity alone. Further studies will be required to determine the effects of prematurity on specific brain regions and their predictive effect on later development.
Conclusion
Sequential MR imaging–based segmentation techniques demonstrate a similitude in cortical neonatal maturation in moderately premature infants at term and term-born infants. Therefore, there is no retardation in structural brain maturation for preterm infants without focal brain lesions born between 29–34 weeks GA.
Footnotes
This work was supported by a grant from the Swiss National Science Foundation to E. Bossi (SNF Project no. 43426 Postnatal Brain Development: The Neonatal Period).
Presented in part at the annual meeting of the ESNR, Istanbul, Turkey, September 2003.
References
- 1.Hüppi PS, Inder TE. Magnetic resonance techniques in the evaluation of the perinatal brain: recent advances and future directions. Semin Neonatol 2001;6:195–210 [DOI] [PubMed] [Google Scholar]
- 2.Barkovich A. MR of the normal neonatal brain: assessment of deep structures. AJNR Am J Neuroradiol 1998;19:1397–403 [PMC free article] [PubMed] [Google Scholar]
- 3.Barkovich A, Latal-Hajnal B, Partridge J, et al. MR contrast enhancement of the normal neonatal brain. AJNR Am J Neuroradiol 1997;18:1713–17 [PMC free article] [PubMed] [Google Scholar]
- 4.Barkovich A, Kjos B, Jackson D, et al. Normal maturation of the neonatal infant brain: MR-imaging at 1.5T. Radiology 1988;166:173–80 [DOI] [PubMed] [Google Scholar]
- 5.van der Knaap MS, Valk J. MR imaging of the various stages of normal myelination during the first year of life. Neuroradiology 1990;31:459–70 [DOI] [PubMed] [Google Scholar]
- 6.Hüppi P, Barnes P. Magnetic resonance techniques in the evaluation of the newborn brain. In: Du Plessis A, ed. Neurologic Disorders in the Newborn Period: Part 1. Philadelphia, Pa: WB Saunders;1997. :693–724 [PubMed]
- 7.Martin E, Kikinis R, Zuerrer M, et al. Developmental stages of human brain: an MR study. J Comput Assist Tomogr 1988;12:917–22 [DOI] [PubMed] [Google Scholar]
- 8.Ferrie JC, Barantin L, Saliba E, et al. MR assessment of the brain maturation during the perinatal period: quantitative T2 MR study in premature newborns. Magn Reson Imaging 1999;17:1275–88 [DOI] [PubMed] [Google Scholar]
- 9.Als H, Duffy FH, McAnulty GB, et al. Early experience alters brain function and structure. Pediatrics 2004;113:846–57 [DOI] [PubMed] [Google Scholar]
- 10.Kreis R, Hofmann L, Kuhlmann B, et al. Brain metabolite composition during early human brain development as measured by quantitative in vivo 1H magnetic resonance spectroscopy. Magn Reson Med 2002;48:949–58 [DOI] [PubMed] [Google Scholar]
- 11.Giedd J, Snell J, Lange N, et al. Quantitative magnetic resonance imaging of human brain development: ages 4–18. Cereb Cortex 1996;6:551–60 [DOI] [PubMed] [Google Scholar]
- 12.Caviness VS, Kennedy DN, Richelme C, et al. The human brain age 7–11 years: a volumetric analysis based upon magnetic resonance images. Cereb Cortex 1996;6:726–36 [DOI] [PubMed] [Google Scholar]
- 13.Pfefferbaum A, Mathalon D, Sullivan E, et al. A quantitative magnetic resonance imaging study of changes in brain morphology from infancy to late adulthood. Arch Neurol 1994;51:874–87 [DOI] [PubMed] [Google Scholar]
- 14.Sowell ER, Thompson PM, Leonard CM, et al. Longitudinal mapping of cortical thickness and brain growth in normal children. J Neurosci 2004;24:8223–31 [DOI] [PMC free article] [PubMed] [Google Scholar]
- 15.Hüppi P, Warfield S, Kikinis R, et al. Quantitative magnetic resonance imaging of brain development in premature and mature newborns. Ann Neurol 1998;43:224–35 [DOI] [PubMed] [Google Scholar]
- 16.Inder T, Hüppi P, Warfield S, et al. Periventricular white matter injury in the premature infant is associated with a reduction in cerebral cortical gray matter volume at term. Ann Neurol 1999;46:755–60 [DOI] [PubMed] [Google Scholar]
- 17.Murphy B, Inder T, Hüppi P, et al. Impaired cerebral cortical gray matter growth after treatment with dexamethasone for neonatal chronic lung disease. Pediatrics 2001;107:217–21 [DOI] [PubMed] [Google Scholar]
- 18.Tolsa CB, Zimine S, Warfield SK, et al. Early alteration of structural and functional brain development in premature infants born with intrauterine growth restriction. Pediatr Res 2004;56:132–38 [DOI] [PubMed] [Google Scholar]
- 19.Inder TE, Warfield SK, Wang H, et al. Abnormal cerebral structure is present at term in premature infants. Pediatrics 2005;115:286–94 [DOI] [PubMed] [Google Scholar]
- 20.Warfield S, Dengler J, Zaers J, et al. Automatic identification of grey matter structures from MRI to improve the segmentation of white matter lesions. J Image Guid Surg 1995;1:326–38 [DOI] [PubMed] [Google Scholar]
- 21.Warfield S, Kaus M, Jolesz FA, et al. Adaptive, template moderated spatially varying statistical classification. Med Image Anal 2002;4:43–55 [DOI] [PubMed] [Google Scholar]
- 22.Bourgeois JP. Synaptogenesis, heterochrony and epigenesis in the mammalian neocortex. Acta Paediatr Suppl 1997;422:27–33 [DOI] [PubMed] [Google Scholar]
- 23.Neil J, Miller J, Mukherjee P, et al. Diffusion tensor imaging of normal and injured developing human brain: a technical review. NMR Biomed 2002;15:543–52 [DOI] [PubMed] [Google Scholar]
- 24.Lovblad KO, Schneider J, Ruoss K, et al. Isotropic apparent diffusion coefficient mapping of postnatal cerebral development. Neuroradiology 2003;45:400–03 [DOI] [PubMed] [Google Scholar]
- 25.Perlman J. White matter injury in the preterm infant: an important determination of abnormal neurodevelopment outcome. Early Hum Dev 1998;53:99–120 [DOI] [PubMed] [Google Scholar]
- 26.Guit G, Van der Bor M, Den Ouden L, et al. Prediction of neurodevelopmental outcome in the preterm infant: MR-staged myelination compared with cranial US. Radiology 1990;175:107–09 [DOI] [PubMed] [Google Scholar]
- 27.DeVries L, Eken P, Groenendaal F, et al. Correlation between the degree of periventricular leukomalacia diagnosed using cranial ultrasound and MRI later in infancy in children with cerebral palsy. Neuropediatrics 1993;24:263–68 [DOI] [PubMed] [Google Scholar]
- 28.Hoon AH Jr, Lawrie WT Jr, Melhem ER, et al. Diffusion tensor imaging of periventricular leukomalacia shows affected sensory cortex white matter pathways. Neurology 2002;59:752–56 [DOI] [PubMed] [Google Scholar]
- 29.Krageloh-Mann I, Toft P, Lunding J, et al. Brain lesions in preterms: origin, consequences and compensation. Acta Paediatr 1999;88:897–908 [DOI] [PubMed] [Google Scholar]
- 30.Kinney H, Brody B, Kloman A, et al. Sequence of central nervous system myelination in human infancy. II. Patterns of myelination in autopsied infants. J Neuropathol Exp Neurol 1988;47:217–34 [DOI] [PubMed] [Google Scholar]
- 31.Brody B, Kinney H, Kloman A, et al. Sequence of central nervous system myelination in human infancy. I. An autopsy study of myelination. J Neuropathol Exp Neurol 1987;46:283–301 [DOI] [PubMed] [Google Scholar]
- 32.Leviton A, Gilles F. Ventriculomegaly, delayed myelination, white matter hypoplasia, and “periventricular” leukomalacia: how are they related? Pediatr Neurol 1996;15:127–36 [DOI] [PubMed] [Google Scholar]
- 33.Nosarti C, Al Asady MH, Frangou S, et al. Adolescents who were born very preterm have decreased brain volumes. Brain 2002;125:1616–23 [DOI] [PubMed] [Google Scholar]


