

Abstract
BACKGROUND AND PURPOSE: During the review of MR studies of multiple patients with polymicrogyria (PMG), it was noted that the patterns of cortical abnormality differed significantly among affected patients. In particular, the cortex appeared very thin in some patients, but was thick in others. The purpose of the present study was to attempt to clarify the cause of the different imaging appearances.
METHODS: T1- and T2-weighted images obtained in 17 patients (age range, 3 days to 43 years) with PMG diagnosed on the basis of imaging characteristics were retrospectively reviewed. One patient was examined four times over a period of 21 months. Particular attention was paid to the thickness and signal intensity of the cortex and underlying white matter and how these features varied with maturation of the cortex and white matter.
RESULTS: T2-weighted images revealed two patterns of PMG. Pattern 1 showed small, fine, and undulating cortex with normal thickness (3–4 mm) in seven patients, all younger than 12 months; and pattern 2, a bumpy cortex that appeared abnormally thick (6–8 mm) and had an irregular cortical–white matter junction in seven patients older than18 months. Both patterns were observed in four patients between 15 months and 2 years of age (ie, pattern 1 in the anterior frontal region and pattern 2 in the posterior frontal, parietal, or perisylvian regions). A layer of T2 prolongation (2–3 mm) was recognized between pattern 1 PMG and underlying myelinated white matter in four patients 11 months to 2 years of age. T1-weighted images showed either poor differentiation of the cortex and underlying white matter or pattern 2. Serial MR imaging in one patient depicted longitudinal changes of the PMG from pattern 1 to pattern 2.
CONCLUSION: These findings suggest that the two appearances (thin and thick) of the cortex seen in PMG likely represent the same process, with the apparent difference being the result of myelination in subcortical and intracortical fibers that cause a change of the appearance and apparent thickness of PMG on T2-weighted images.
Polymicrogyria (PMG) is a malformation of cortical development characterized by excessive small and prominent convolutions separated by shallow sulci, giving the cortical surface and cortical–white matter junction an irregular appearance (1–4). PMG is believed to result from a developmental disorder or injury that occurs between 17 and 25 or 26 weeks’ gestation (5), toward the end of the period of neuronal migration and the early phase of cortical organization (1). Several syndromes have been described in which patients have rather specific clinical manifestations associated with imaging of bilateral symmetrical PMG (6–9). These include bilateral perisylvian PMG, bilateral parasagittal parieto-occipital PMG, and bilateral frontoparietal PMG. Recently, genetic loci for bilateral perisylvian PMG and bilateral frontoparietal PMG were mapped to Xq28 and 16q12.2–21, respectively (10, 11).
The combination of three characteristics on MR images has been used to identify PMG: abnormal gyral pattern, increased cortical thickness, and irregularity of the cortical-white matter junction due to packing of microgyri (6); however, we performed MR imaging in several patients in whom the cortex had small, fine, and undulating gyri, very similar to the undulating cortical ribbon of PMG described by pathologists. To better understand this variable appearance, we retrospectively reviewed the MR imaging findings in patients with PMG that were obtained by using thin-section, high-quality images, including one patient with sequential studies during development. Our hypothesis was that myelination in the intracortical and subcortical fibers causes changes in the appearance and apparent thickness of the polymicrogyric cortex on T2-weighted images.
Methods
A review of the teaching files and radiologic information system at our institution yielded 17 patients in whom PMG was diagnosed on the basis of Raybaud et al’s criteria (MR imaging appearance showing irregularity of the cortical–white matter junction in affected area; 12). Some of the patients have been reported elsewhere (6–9). Seven patients were female, and 10 were male (Table 1). Their ages ranged from 3 days to 43 years at the time of examination; imaging was performed to investigate the cause of developmental delay, fixed neurologic deficit, or epilepsy. Their clinical manifestations are described in Table 1. MR imaging was performed four times at the ages of 3, 7, and 11 months and 2 years for patient 4. No other patient had repeated MR examinations.
Clinical and MR imaging findings in PMG patients
| Patient | Age | Sex | Clinical Manifestation | Other MR Findings | PMG Location | Evaluated Lesion | T1 Pattern | Thickness (mm) Axial (Coronal) | T2 Pattern | Thickness (mm) Axial (Coronal) | Layer between Cortex and White Matter |
|---|---|---|---|---|---|---|---|---|---|---|---|
| 1 | 3D | F | Zellweger syndrome | Germinolytic cysts | bil. Syl | Syl | 2 | 4 (4) | 1 | 4 | |
| 2 | 2M | M | Epilepsy | bil. F, Syr, P | Syl | 2 | 4 (3) | 1 | 4 (3) | ||
| 3 | 3M | F | Infantile spasmus | Microcephaly, hypoplastic CC | bil. Syl, P | Syl | Undifferentiated | 1 | 3 (4) | ||
| 4 | 3M | M | Large head, retardation | rt. hemi | P | 2 | 5 (5) | 1 | 4 | ||
| 7M | P | 2 | 6 (6) | 1 | 4 | ||||||
| 11M | P | 2 | 6 | 1 | 4 | Present | |||||
| 2Y | F | 2 | 5 | 1 | 3 | Present | |||||
| P | 2 | 6 | 2 | 6 | |||||||
| 5 | 5M | M | Retardation | bil. T | T | Undifferentiated | 1 | 3 | |||
| 6 | 7M | M | Infantile spasmus | diffuse | Syl | 2 | 6 | 1 | 3 (3) | ||
| 7 | 12M | F | In utero drug exposure | lt. F, Syl | Syl | 2 | 7 (6) | 1 | 4 | ||
| 8 | 15M | F | rt. hemiparesis | lt. F, P, bil. Syr | F | 2 | 6 (5) | 1 | 3 | Present | |
| P | 2 | 6 (6) | 2 | 6 | |||||||
| 9 | 15M | M | lt. hemiparesis | rt. hemi | F | 2 | 7 (7) | 1 | 4 | Present | |
| P | 2 | 7 (6) | 2 | 7 | |||||||
| 10 | 18M | F | Retardation, focal seizure | small rt. Th, peducle | rt. hemi | F | 2 | 6 (6) | 1 | 3 | Present |
| P | 2 | 6 (6) | 2 | 6 | |||||||
| 11 | 18M | M | Seizure | heterotopia | bil. Syl, P | Syr | 2 | 6 (6) | 2 | 6 | |
| 12 | 3Y | M | rt. hemiparesis | lt. hemi | Syr | 2 | 7 (6) | 2 | 7 | ||
| 13 | 8Y | M | Speech delay | rt. hemi, lt. F | Ins | 2 | 8 (8) | 2 | 8 | ||
| 14 | 8Y | M | Hydrocephalus | heterotopia, Agenesis of CC | bil. F | F | 2 | 6 (6) | 2 | 6 | |
| 15 | 9Y | F | Retardation | heterotopia, hypoplastic CC | bil. F | F | 2 | 8 (7) | 2 | 8 | |
| 16 | 11Y | M | Retardation | heterotopia, agenesis of CC | lt. F | F | 2 | 7 (6) | 2 | 7 | |
| 17 | 43Y | F | Epilepsy | bil. Syr | Syr | 2 | 6 (6) | 2 | 6 |
Note.—PMG, polymicrogyria; D, day; M, month; Y, year; CC, corpus callosum; Th, thalamus; bil, bilateral; rt, right; lt, left; F, frontal; Syl, Sylvian; P, parietal; hemi, hemispheric.
All MR imaging was performed with a 1.5-T superconducting magnet (General Electric Medical Systems, Milwaukee, WI). Axial spin-echo T2-weighted images (3000/120/1 [TR/TE/NEX], for less than 1 year, and 2500/80/1 for over 1 year) and spin-echo T1-weighted images (600/9/2) were obtained in all patients with 4-mm section thickness. Thin-section (1.5-mm) coronal images were also obtained either by T1-weighted 3D Fourier-transformed gradient-recalled-echo (35/9), or by T2-weighted fast spin-echo (4000/105/1) sequences, which usually enable us to differentiate PMG from pachygyria by allowing the identification of the irregular cortical–white matter junction (12).
The MR studies of these patients were examined retrospectively to confirm the presence of PMG. The images were initially evaluated, and the diagnosis was made, by a number of neuroradiologists. All images were reviewed again by both authors to ensure that the diagnosis was correct and to further evaluate the appearance of the dysplastic cortex. In particular, the thickness of the cortex and the signal intensity of the underlying white matter were examined.
We evaluated axial T1- and T2-weighted images, which were always at or nearly at the same section level (in a few patients, the levels were not precisely the same because of patient motion). In addition, we also evaluated thin-section coronal images through the same regions, aided by an automatic cross-reference function on our PACS workstation. The images were examined for the appearance and thickness of PMG. Measurements of the cortical thickness were made on the PACS workstation for images that had been magnified. The thickness was the distance from the outermost gray matter to the innermost gray matter, measured perpendicular to the cortex at the thickest part of a typical region of PMG. When two patterns of the cortical appearance existed, we analyzed both. A layer of T2 hyperintensity was also observed between abnormal cortex and myelinated white matter in some patients and therefore this feature was included in the analysis.
Results
Appearance of Abnormal Cortex
MR imaging findings are summarized in Table 1. T2-weighted images revealed two different appearances of abnormal cortex: a thin cortex with a small, fine, and undulating appearance (pattern 1; Fig 1); and a thicker cortex with a bumpy appearance at the surface and the cortical-white matter junction (pattern 2; Fig 2). Pattern 1 was observed in seven patients younger than 12 months (patients 1–7), whereas pattern 2 was observed in seven patients older than 18 months (patients 11–17). In four patients between 15 months and 2 years of age (patients 4 and 8–10), both patterns were seen, with pattern 1 in the anterior frontal region and pattern 2 in the posterior frontal, parietal, or perisylvian regions. A layer of T2 prolongation was recognized between the pattern 1 PMG and myelinated white matter in four patients (patient 4 and patients 8–10) ranging in age from 11 months to 2 years (Fig 3C-E).
Fig 1.

Patient 2 (aged 2 months), with bilateral frontal and sylvian PMG.
T2-weighted image shows pattern 1: abnormal cortex with a small, fine, and undulating appearance in the insulae and orbital surfaces of the frontal lobes (arrowheads). The cortical thickness was 4 mm.
Fig 2.
Patient 12 (aged 3 years), with left hemispheric PMG.
T2-weighted image shows pattern 2: abnormally thick sylvian and perisylvian cortex (7 mm at the left sylvian cortex) with a bumpy appearance at the surface and the cortical-white matter junction.
Fig 3.
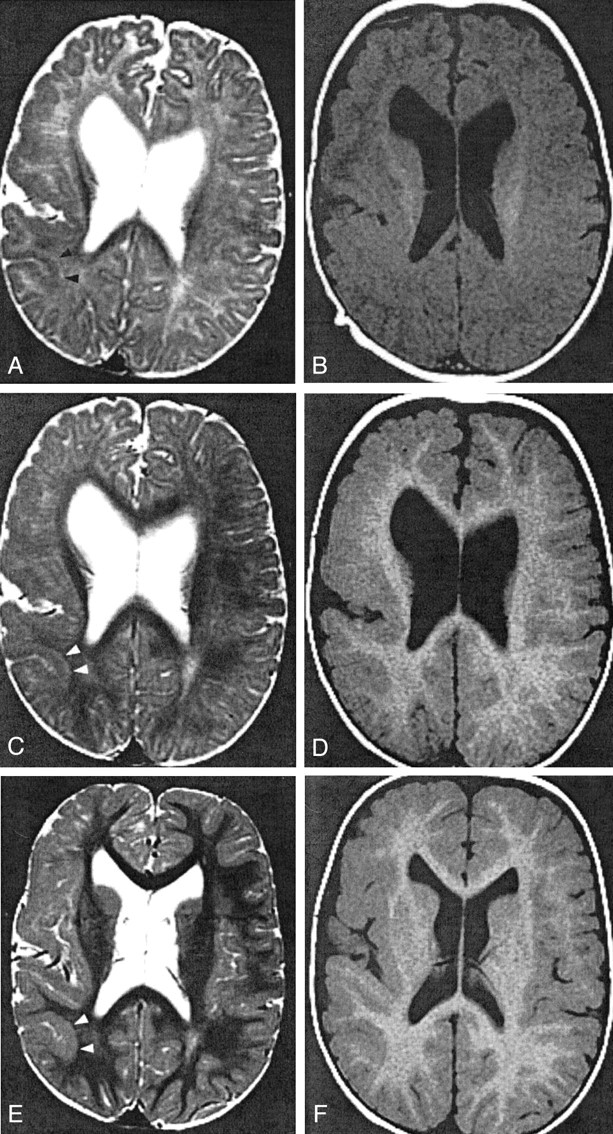
Patient 4, with right hemispheric PMG.
A and B, Images obtained when the patient was 3 months old. T2-weighted image (A) shows pattern 1: 4-mm-thick cortex in the parietal lobe (arrowheads). T1-weighted image (B) shows pattern 2: 5-mm thickness in the same region.
C and D, Images obtained when the patient was 11 months old. T2-weighted image (C) at the parietal lobe shows pattern 1: 4-mm thickness and a 2-mm-thick layer of T2 prolongation between the cortex and myelinated white matter (arrowheads). T1-weighted image (D) shows pattern 2: 6-mm thickness of the same cortex.
E and F, Images obtained when the patient was 2 years old. In the parietal lobe (arrowheads), T2- (E) and T1-weighted (F) images show pattern 2: 6-mm thickness. The T1-weighted image (F) shows pattern 2 in the frontal lobe: 5-mm thickness. Conversely, the T2- weighted image (E) reveals pattern 1 in the frontal lobe: 3-mm thickness with subjacent layer of T2 prolongation.
T1-weighted images showed poor differentiation of the cortex and underlying white matter in two patients (patients 3 and 5) 3 and 5 months of age, respectively. In the remaining patients, T1-weighted images showed pattern 2 adjacent to hypointense unmyelinated white matter in patients 1, 2, and 4 (younger than 3 months) and adjacent to hyperintense myelinated white matter in the other patients (all older than 7 months).
Cortical Thickness
The thickness of the cortex, measured on axial and thin-section coronal images, are shown in Table 1. The cortex that showed pattern 2 on T2-weighted images (Fig 2) was thicker than normal (normal cortex has a thickness of 3–4 mm) (13), ranging from 6 mm to 8 mm. Similar measurements were recorded from T1-weighted images in those patients. By contrast, the thickness of the pattern 1 PMG on T2-weighted images (Fig 1) was normal (3–4 mm) and thinner than the pattern 2 cortex seen on T1-weighted images (5–7 mm) in six patients (patients 4 and 6–10) between 7 months and 2 years of age. The thickness of the layer of T2 prolongation between the pattern 1 PMG and the myelinated white matter (Fig 3C) was 2–3 mm.
Serial MR Imaging in Patient 4
The serial images obtained in patient 4 are of considerable interest, because they showed typical findings of both patterns as well as interesting longitudinal changes. The initial MR imaging at age 3 months showed pattern 1 on T2-weighted images (Fig 3A) in the right hemisphere with cortical thickness of 4 mm in the parietal lobe. T1-weighted images showed pattern 2 with thickness of 5 mm (Fig 3B). At age 11 months, T2-weighted images of the parietal lobe showed pattern 1, with a cortical thickness of 4 mm and a 2-mm layer of T2 prolongation between the pattern 1 PMG and myelinated white matter (Fig 3C). T1- weighted images showed pattern 2 with thickness of 6 mm (Fig 3D). The fourth image, obtained when the patient was 2 years old, showed pattern 2: thickness of 6 mm on both T1- and T2-weighted images (Fig 3E and F) in the parietal lobe. On images obtained in the same series, T1-weighted images showed pattern 2 in the less mature frontal lobe with a thickness of 5 mm, whereas T2-weighted images revealed pattern 1 3-mm thickness with a layer of T2 prolongation.
Discussion
The present study revealed two significant findings. The first was that T2-weighted images of patients with PMG revealed two different cortical patterns; pattern 1 was a small, fine, and undulating appearance with normal thickness (3–4 mm), and pattern 2 was a thick and bumpy appearance (5–8 mm). The second finding was that pattern 1 seemed to evolve into pattern 2 as the brain underwent myelination.
PMG has a variety of histologic patterns, but in all of them the cortical ribbon is abnormally thin and laminated, excessively folded, and shows fusion of adjacent gyri (4, 14–16). No pathologic evidence could be found for the two different patterns that we observed on these MR images. We observed pattern 1 on T2-weighted images of neonates and infants, whereas pattern 2 was recognized later in childhood. The clue to the cause of the two patterns came from studying serial MR images of patient 4. Pattern 1, which was observed in the parietal lobe at 3, 7, and 11 months of age, changed into pattern 2 on an image obtained at 2 years of age. In addition, both patterns were recognized on the same image in four patients, including the fourth image obtained in patient 4. These findings suggested that the two patterns of the cortex seen on T2-weighted images did not represent differences of morphology but rather differences in the maturity of the cortex and underlying white matter; pattern 1 is seen in infancy and pattern 2 in childhood. Although we did not have neuropathologic specimens of the cortex in any of our patients, and cannot therefore comment on whether the early or the late appearance more closely resembles gross anatomy, it is noteworthy that pattern 1 most closely resembled the cortical appearance of PMG as seen in neuropathology textbooks (4, 14–16).
What is the mechanism of the changing appearance of PMG on T2-weighted images? One possibility is that myelination in the subcortical or intracortical fibers may change the cortical appearance on T2-weighted images. Microscopically, two types of PMG have been distinguished; four-layered and unlayered PMG. Four-layered PMG is composed of a molecular layer and two layers of neurons separated by an intermediate cell-sparse layer of a few cells and myelinated fibers (Fig 4) (4). Unlayered PMG is composed of a molecular layer and a layer of neurons and myelinated fibers without laminar organization (4; personal communication to Dr. Masaharu Hayashi, Department of Clinical Neuropathology, Tokyo Metropolitan Institute for Neuroscience, Tokyo, Japan). Brain myelination causes T1 and T2 shortening, which occurs at different rates and at different times; T1 shortening precedes T2 shortening (17, 18). In general, the deep white matter matures earlier, as does the white matter in the sensorimotor and visual pathways. The subcortical white matter matures last, particularly in the anterior frontal and temporal lobes. The process depicted on T2-weighted image begins at ages 9–12 months in the occipital white matter and at ages 11–14 months frontally. Development of hypointensity in the subcortical white matter begins at about 1 year and is essentially completed on T2-weighted MR studies, by the end of the second year or early in the third year of life (15).
Fig 4.
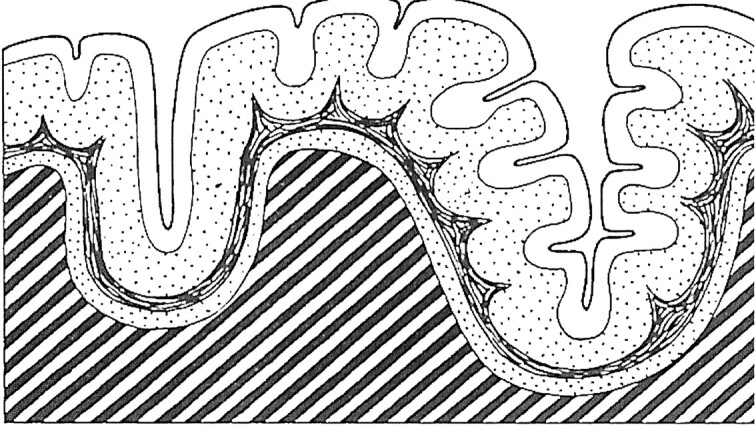
Diagrammatic representation of the cerebral cortex in four-layered PMG. (Reprinted from Fig 210, R. Excourolle and J. Poirier, Manual of Basic Neuropathology. 2nd ed. [1978] with permission of Elsevier Science.)
The two cortical patterns of PMG were strongly related to underlying white matter signal intensity. Pattern 2 hypointensity was observed on T2-weighted images only after the subcortical white matter myelinated. The cortical pattern in the parietal region in patient 4 actually changed from pattern 1 to pattern 2 between ages 11 months and 2 years, during which time the subcortical white matter decreased in signal intensity, probably because of myelination. The four patients who had both patterns on the same image had pattern 1 in the anterior frontal lobe (with underlying immature white matter), whereas pattern 2 was in the posterior frontal, parietal, or perisylvian regions (with underlying mature white matter). Therefore, it seems reasonable to suggest that the hypointensity of the cortical ribbon of PMG seen in pattern 1 might be masked when the intracortical or surrounding subcortical fibers myelinate and decrease in signal intensity.
Why does the same cortex seem to have different thickness on T1- and T2-weighted images, with normal thickness seen in pattern 1 on T2-weighted images and increased thickness in pattern 2 seen on T1-weighted images in six patients between 7 months and 2 years of age? If the changing of the cortical appearance on T2-weighted images is due to the surrounding fibers’ myelination, the changing of the thickness may also be related to myelination. Intracortical curvilinear T2 and T1 prolongation is observed in the “type 3 cortical dysplasia” in patients with Fukuyama congenital muscular dystrophy. According to pathologic-radiologic correlation (19, 20), this signal intensity alteration may represent unmyelinated fibers in the third layer of the dysplastic cortex. The increased T2 signal intensity of these unmyelinated fibers may be difficult to detect after the white matter matures (19). In the present study, a subcortical layer of T2 prolongation, measuring 2–3 mm in thickness, was observed between pattern 1 PMG and myelinated white matter in four patients (Fig 3C); in all of these patients, the cortex appeared thicker on T1-weighted images than on T2-weighted images. The cell-sparse layer of PMG contains axons that eventually myelinate and astrogliosis, and the folding may affect only the superficial neuronal layer with the deeper cell-sparse layer running parallel to the cortical surface (15, 16). Therefore, it seems likely that the layer of T2 prolongation represents a combination of intracortical unmyelinated fibers and astrogliosis in the third layer of the four-layered PMG (Fig 4) and that this layer becomes visible when myelination occurs in the subcortical white matter. In addition, it is likely that later myelination of the intracortical axons may make it difficult to depict and change the appearance and the thickness of the cortex. The presence of a small amount of astrogliosis in the third layer presumably changes the signal intensity of the tissue sufficiently that it differs from that of the normal underlying white matter. Actually, the thickness of the parietal cortex on T2-weighted images of patient 4 increased longitudinally in proportion to the changing from pattern 1 (4 mm) to pattern 2 (6 mm) and also in proportion to the disappearance of the layer of T2 prolongation (2 mm), which might support this hypothesis; however, the absence of histologic correlation in our patients limits our interpretation. For example, it still remains uncertain whether this hypothesis is applicable to unlayered PMG and why T1 prolongation corresponding to the unmyelinated fiber layer could not be observed in PMG; perhaps the latter is the result of not imaging any of our patients at precisely the correct age. Better correlation of images with neuropathology in animal models as well as neuroradiologic assessment, including thin sections on both T1- and T2-weighted images, will be necessary to substantiate and further clarify this hypothesis.
Conclusion
To clarify the cortical abnormality in patients with PMG, we retrospectively examined T1- and T2-weighted images of 17 patients with PMG. T2-weighted images revealed two different patterns: pattern 1, small, fine and undulating cortex with normal thickness (3–4 mm) in seven patients, all under the age of 12 months; and pattern 2, a thick bumpy cortex that appeared abnormally thick (6–8 mm) and had an irregular cortical-white matter junction in seven patients over the age of 18 months. Serial MR imaging in one patient demonstrated longitudinal changes of the PMG from pattern 1 to pattern 2. These findings suggest that the two appearances (thin and thick) of the cortex seen in PMG likely represent the same process, with the apparent difference being the result of myelination in subcortical and intracortical fibers that cause changing of the appearance and apparent thickness of PMG on T2-weighted images.
Acknowledgments
We wish to thank Dr. Masaharu Hayashi (Department of Clinical Neuropathology, Tokyo Metropolitan Institute for Neuroscience, Tokyo, Japan) for helpful advice.
References
- 1.Barkovich AJ, Kuzniecky RI, Jackson GD, Guerrini R, Dobyns WB. Classification system for malformations of cortical development: update 2001.Neurology 2001;57:2168–2178 [DOI] [PubMed] [Google Scholar]
- 2.Kuzniecky RI, Barkovich AJ. Malformations of cortical development and epilepsy.Brain Dev 2001;23:2–11 [DOI] [PubMed] [Google Scholar]
- 3.Guerrini R, Carrozzo R. Epilepsy and genetic malformations of the cerebral cortex.Am J Med Genet 2001;106:160–173 [DOI] [PubMed] [Google Scholar]
- 4.Harding B, Copp AJ. Malformations. In: Graham DI, Lantos PL, eds.Greenfield’s Neuropathology. 6th ed. London: Arnold;1997:397–533
- 5.Golden JA. Cell migration and cerebral cortical development.Neuropathol Appl Neurobiol 2001;27:22–28 [DOI] [PubMed] [Google Scholar]
- 6.Barkovich AJ, Hevner R, Guerrini R. Syndromes of bilateral polymicrogyria.AJNR Am J Neuroradiol 1999;20:1814–1821 [PMC free article] [PubMed] [Google Scholar]
- 7.Guerrini R, Barkovich AJ, Sztriha L, Dobyns WB. Bilateral frontal polymicrogyria: a newly recognized brain malformation syndrome.Neurology 2000;54:909–913 [DOI] [PubMed] [Google Scholar]
- 8.Gropman AL, Barkovich AJ, Vezina LG, Conry JA, Dubovsky EC, Packer RJ. Pediatric congenital bilateral perisylvian syndrome: clinical and MRI features in 12 patients.Neuropediatrics 1997;28:198–203 [DOI] [PubMed] [Google Scholar]
- 9.Guerrini R, Dubeau F, Dulac O, et al. Bilateral parasagittal parietooccipital polymicrogyria and epilepsy.Ann Neurol 1997;41:65–73 [DOI] [PubMed] [Google Scholar]
- 10.Piao X, Basel-Vanagaite L, Straussberg R, et al. An autosomal recessive form of bilateral frontoparietal polymicrogyria maps to chromosome 16q12.2–21.Am J Hum Genet 2001;70:1028–1033 [DOI] [PMC free article] [PubMed] [Google Scholar]
- 11.Villard L, Nguyen K, Cardoso C, et al. A locus for bilateral perisylvian polymicrogyria maps to Xq28.Am J Hum Genet 2001;70:1003–1008 [DOI] [PMC free article] [PubMed] [Google Scholar]
- 12.Raybaud C, Girard N, Canto-Moreira N, Poncet M. High-definition magnetic resonance imaging identification of cortical dysplasias: micropolygyria versus lissencephaly. In: Guerrini R, Andermann F, Canapicchi R, Roger J, Zifkin B, Pfanner P, eds.Dysplasias of Cerebral Cortex and Epilepsy. Philadelphia: Lippincott-Raven;1996:131–143
- 13.Barkovich AJ, Koch TK, Carol CL. The spectrum of lissencephaly: report of ten patients analyzed by magnetic resonance imaging.Ann Neurol 1991;30:139–146 [DOI] [PubMed] [Google Scholar]
- 14.Crone J, Stern J. Pathological aspects: general. In: Crone J, Stern J, eds.Pathology of Mental Retardation. 2nd ed. Edinburgh: Churchill Livingstone;1972:121–191
- 15.Friede RL. Dysplasias of cerebral cortex. In: Freide RL, ed.Developmental Neuropathology. 2nd ed. Berlin: Springer;1989:330–346
- 16.Volpe JJ. Neuronal proliferation, migration, organization, and myelination. In: Volpe JJ, ed.Neurology of the Newborn. 4th ed. Philadelphia: Saunders;2001:45–102
- 17.Barkovich AJ. Normal development of the neonatal and infant brain, skull, and spine. In: Barkovich AJ, ed.Pediatric Neuroimaging. 3rd ed. New York: Lippincott Williams & Wilkins;2000:9–54
- 18.van der Knaap MS, Valk J Myelination and retarded myelination. In: van der Knaap MS, Valk J, eds.Magnetic Resonance of Myelin, Myelination, and Myelin Disorders. 2nd ed. Berlin: Springer;1995:31–52
- 19.Aida N. Fukuyama congenital muscular dystrophy.J Mag Reson Imaging 1998;8:317–326 [DOI] [PubMed] [Google Scholar]
- 20.Takada K, Nakamura H, Tanaka J. Cortical dysplasia in congenital muscular dystrophy with central nervous involvement (Fukuyama type).J Neuropathol Exp Neurol 1984;43:395–407 [DOI] [PubMed] [Google Scholar]