

Abstract
BACKGROUND AND PURPOSE: Focal cerebral ischemia results in neuronal changes in remote areas that have fiber connections with the ischemic area. We reported previously that a high-signal-intensity lesion was observed in the substantia nigra after striatal infarction on T2-weighted MR images in both clinical and experimental cases. However, the origin of these changes in signal intensity remains unclear. The aim of this study was to investigate the nigral changes by examining the correlation between the apparent diffusion coefficient (ADC) and the tissue structure.
METHODS: Sprague-Dawley rats were subjected to middle cerebral artery occlusion. Four days after the occlusion, when T2-weighted images revealed the presence of an area of high signal intensity in the ipsilateral substantia nigra, diffusion-weighted imaging was performed using a 4.7-T superconductive MR unit, and the ADCs were calculated and imaged. Histopathologic examination by both light and electron microscopy was performed on day 4 after surgery.
RESULTS: Diffusion-weighted images showed an area of high signal intensity in the ipsilateral substantia nigra, and the ADC map revealed uniform reduction of the ADC in this area. Swelling of astrocytic end-feet was observed, especially in the pars reticulata.
CONCLUSION: These findings suggest that MR changes in the ipsilateral substantia nigra after striatal injury consist mainly of swelling in the astrocytic end-feet.
Neuronal loss in the ipsilateral substantia nigra is observed after striatal injury both in humans (1, 2) and in animals (3–7). It takes several days before these changes become detectable histopathologically (7, 8). This neuronal death may result from excessive excitation caused by the loss of the inhibitory transmitter γ-aminobutyric acid (GABA) in the striatum (6, 7), as the intraventricular infusion of the GABA-agonist muscimol prevents neuronal loss after destruction of the striatum (6, 9).
Secondary changes in the substantia nigra have been detected by MR imaging (on T2-weighted sequences) in patients with a wide infarction in the territory of the middle cerebral artery (MCA) (10) and in rats with MCA occlusion (11). In both humans and rats, the substantia nigra lies outside the ischemic area. Lesions in the substantia nigra are seen as areas of high signal intensity on T2-weighted images several days after infarction (10, 11).
In a previous study, the high signal intensity in the substantia nigra appeared transiently only at day 4 after MCA occlusion in the rat (11). In our rat MCA occlusion model, light microscopy revealed no pathologic change in the substantia nigra at day 2 after occlusion (7). One week after MCA occlusion, a small number of degenerated dark neurons were apparent, and after 2 weeks or more, neuronal loss, gliosis, and marked atrophy were observed in all animals (7, 12). The question then arises as to what causes the signal change in the substantia nigra at day 4, when neuronal degeneration is barely discernible. In an attempt to answer this question, we examined the apparent diffusion coefficient (ADC) values and the ultrastructural changes in the substantia nigra 4 days after MCA occlusion in the rat. Our findings are presented here, along with a discussion of the cause of the signal change on T2-weighted images.
Methods
Experimental Animals
The experimental and surgical procedures were approved by the animal research committee of the Teikyo University School of Medicine. Twelve male Sprague-Dawley rats, 9 to 10 weeks of age and weighing 320–350 g, were used. Eight rats were anesthetized with 2% halothane before the proximal part of the left MCA was exposed and permanently cauterized (13, 14). The remaining four rats were subjected to a sham operation and served as controls; in these animals, the MCA was exposed under anesthesia but not cauterized. After surgery, the animals were transferred to observation cages and given free access to food and water for 4 days.
MR Imaging
MR imaging was performed 4 days after surgery in five of the eight MCA-occluded rats and in two of the four sham-operated animals. Images were acquired using a 4.7-T imager/spectrometer system (Unity INOVA, Varian, Palo Alto, CA). An 8-cm quadrature coil was tuned to a radio frequency of200 MHz for excitation and reception of proton nuclear MR signals. The animals were placed supine on a thermal water blanket maintained at 37.5°C and artificially ventilated with 1.5% isoflurane using a home-built plastic cone device that fit tightly over the nose. To obtain reproducible images, a T1-weighted midsagittal scout image was taken, and nine consecutive coronal sections were selected. The T1-weighted images were obtained with conventional multislice spin-echo sequences (600/20/2 [TR/TE/excitations], 2-mm slice thickness, 128 × 128 pixel matrix, and 3-cm field of view). The T2- and diffusion-weighted images were also obtained with conventional multislice spin-echo sequences (1500/80/2, 2-mm slice thickness, 128 × 128 pixel matrix, 3-cm field of view). For diffusion weighting, b-values of 1200 s/mm2 were used. Diffusion-encoding gradients were irradiated along the x-, y- or z-axes in turn. MR data analyses were performed on a Sun Spark 10 (Sun Microsystems, Palo Alto, CA) workstation using image analyzing software (XSD software, Daris Bioengineering, St. Louis, MO). ADC maps were calculated on a pixel-by-pixel basis using standard equations (15): ADC = ln (S0/S1)/(b1−b0), where S0 is the signal intensity of the T2-weighted image, S1 is the averaged signal intensity of three diffusion-weighted images (x, y, and z), and b0 and b1 are 0 and 1200 s/mm2, respectively. The ADCs were assessed in the substantia nigra of both sides. Regions of interest were determined according to a stereotaxic atlas (16) at the level of the substantia nigra. It took about1 hour to perform the MR examination for one animal.
Histologic Examination
Three experimental animals were prepared for histopathologic examination 4 days after MCA occlusion. They were perfused transcardially with a solution of 3% paraformaldehyde and 1% glutaraldehyde in a buffer under pentobarbital anesthesia (50 mg/kg intraperitoneally). The brains were removed and postfixed for more than 24 hours in the same fixative at 4°C. Small blocks including the substantia nigra were cut and postfixed with 1% OsO4 for 2 hours. After dehydration through a graded alcohol series, the blocks were transferred to propylene oxide and embedded in Epon. Thin sections, stained with 1% toluidine blue, were examined with a light microscope. For electron-microscopic examination, ultrathin sections were stained with uracyl acetate and lead citrate. The two control animals that were subjected to sham operations were prepared similarly.
Statistical Analysis
Data are shown as mean ± SEM. The values in the ipsilateral substantia nigra were compared with those on the opposite side by a paired Student's t-test analysis.
Results
MR Imaging
All the MCA-occluded rats showed cerebral infarction as revealed by high signal intensity in the left caudate putamen and cortex on T2- and diffusion-weighted images (Fig 1A). The ADC map revealed heterogeneous reduction or elevation of the ADC in the ischemic area. T2- and diffusion-weighted images 4 days after MCA occlusion showed an area of high signal intensity in the ipsilateral substantia nigra in all the experimental animals (Fig 1B and C). The ADC map revealed uniform reduction of the ADC in the ipsilateral substantia nigra (426.2 ± 19.7 × 10⁻⁶ mm2/s), which was significantly lower than that in the contralateral substantia nigra (637.0 ± 4.7 × 10⁻⁶ mm2/s; P < .001, n = 5). No significant abnormality in the substantia nigra was observed in the sham-operated rats (data not shown).
fig 1.

Representative MR images 4 days after MCA occlusion. A–C, The infarction is seen as an area of high signal intensity on diffusion-weighted image (A). The ipsilateral substantia nigra shows high signal intensity on T2-weighted (B) and diffusion-weighted (C) images (arrowhead)
Histologic Examination
Histologic analysis was done 4 days after MCA occlusion. Light microscopy revealed perivascular enlargement as the characteristic finding in the pars reticulata. Most of the neurons were normal in appearance (Fig 2). A few neurons in the ipsilateral pars reticulata showed cytoplasmic condensation; however, the nuclear membranes were preserved. The ultrastructural characteristics of the pars reticulata are shown in Figure 3. Swelling of the astrocytes was observed around blood vessels, but it was restricted to the perivascular end-feet. There was no remarkable change in the pars compacta.
fig 2.
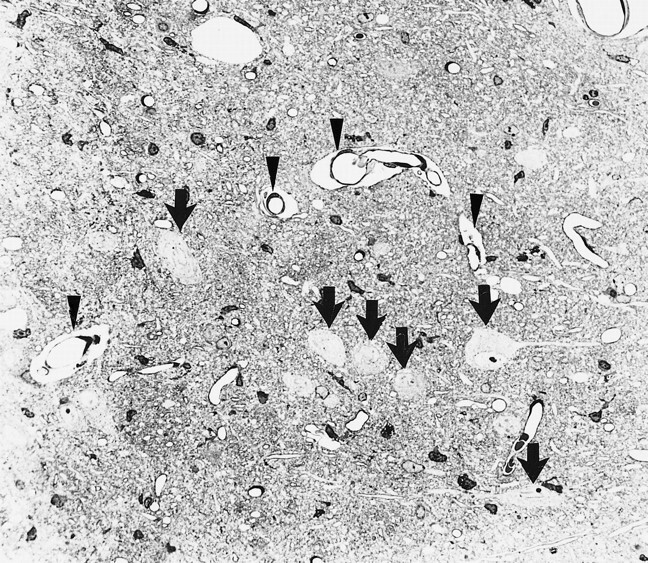
Light micrograph of the left substantia nigra pars reticulata shows perivascular enlargement (arrowheads) and intact neurons (arrows) (toluidine blue, original magnification ×320)
fig 3.
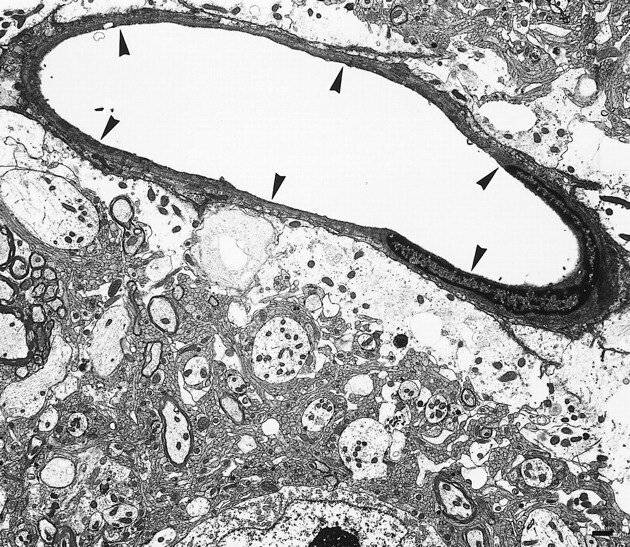
Electron micrograph of the left substantia nigra pars reticulata shows the blood vessel (arrowheads) surrounded by lucent swollen astrocytic end-feet. Bar = 1 μm
Discussion
Focal cerebral infarction results in delayed neuronal changes in remote areas that have fiber connections with the infarcted area (7, 10, 11, 17). In this study, we found MR imaging changes reflective of the secondary changes in the substantia nigra, which might be caused by transneuronal mechanisms.
MR imaging is a noninvasive and powerful tool for detecting cerebral edema in experimental animals. Diffusion-weighted images can reveal changes of cerebral ischemia as early as 30 minutes after the onset of ischemia, and more clearly than T2-weighted images (18). T2- and diffusion-weighted images reflect differences in water content and water diffusion, respectively (15, 19). The development of cellular edema is associated with a reduction of the ADC (20). ADC mapping is a sensitive method for detecting ischemic edema, and ADC reduction was found to occur as early as 15 minutes after the onset of ischemia (21).
In one recent study, reduction of the ADC at the substantia nigra was detected after temporary hypoxia-ischemia in rats (22). In this model, the substantia nigra was exposed to hypoxia; therefore, the change in the substantia nigra was not delayed, and might have derived from direct injury. Conversely, there was no ischemia of the substantia nigra in our model (23); hence, the changes in the substantia nigra are considered to represent remote effects of striatal injury.
It has been reported that either hypoxic-ischemic injury or excitotoxic striatal injury during development induces apoptotic cell death of the dopaminergic neurons in the pars compacta in rats (24, 25), and that neuronal death does not occur in the pars reticulata as a result of combined lesions of the striatum and globus pallidus in rats younger than postnatal day 20 (26). DeGiorgio et al (27) reported that neuronal loss in the pars reticulata began 4 days after neurotoxic injury of the caudate-putamen and globus pallidus in rats, followed by significant loss (50%) at 6 days and a plateau after 8 days. Substantia nigra lesions induced by striatal injury are likely to differ depending on the age or the model used. Further studies are needed to explore the mechanism of neuronal death in the substantia nigra.
We focused on the findings at day 4 after MCA occlusion in this study because the substantia nigra lesion is reproducibly observed as an area of high signal intensity on T2-weighted images at this time point. The lesion was not seen on either T2- or proton–density–weighted images at days 1, 7, 14, or 28 after MCA occlusion (11), or on diffusion-weighted images at days 1 and 7 in our preliminary study (data not shown). It is unclear why the lesion is not detectable on MR images at days 7 and 14, when neuronal degeneration in the substantia nigra is observed neuropathologically (7).
Conclusion
Four days after MCA occlusion, cell swelling in the pars reticulata took place not in the neurons, but in the astrocytes. This finding was consistent with the high signal intensity seen on T2- and diffusion-weighted images, as well as with the ADC reduction, but we did not expect to observe uniform ADC reduction attributable mainly to astrocytic swelling in the perivascular end-feet. This is new knowledge regarding secondary degeneration. We are still unclear as to the process of subsequent neuronal loss. Nonetheless, we can confirm that the abnormality of the substantia nigra observed on T2-weighted images was due to astrocytic swelling. Careful examination by MR imaging thus enables us to detect degeneration that occurs in remote areas from the primary lesion.
Acknowledgments
We thank Shizuko Ichinose, Kimi Tatebe, Noriko Kishino, and Tomomi Iwasawa for their excellent assistance in this study; and we gratefully acknowledge the helpful contributions and support of Professor Kimiyoshi Hirakawa.
Footnotes
Supported in part by a grant-in-aid for scientific research from the Ministry of Education, Science, Sports and Culture of Japan.
Address reprint requests to Makoto Nakane, MD, Department of Neurosurgery, Teikyo University School of Medicine, 2–11–1 Kaga, Itabashi-ku, Tokyo 173–8605, Japan.
References
- 1.Forno LS. Reaction of the substantia nigra to massive basal ganglia infarction. Acta Neuropathol (Berl) 1989;62:96-102 [DOI] [PubMed] [Google Scholar]
- 2.Ohara S, Kondo K, Kagoshima M, Yanagisawa N. Secondary degeneration of substantia nigra after massive basal ganglia infarction [in Japanese with English abstract]. Clin Neurol (Tokyo) 1989;29:1352-1356 [PubMed] [Google Scholar]
- 3.Holmes GH. The nervous system of the dog without a forebrain. J Physiol (Lond) 1901;27:1-25 [DOI] [PMC free article] [PubMed] [Google Scholar]
- 4.Rosegay H. An experimental investigation of the connections between the corpus striatum and the substantia nigra in the cat. J Comp Neurol 1944;80:293-321 [Google Scholar]
- 5.Mettler FA. Nigrofugal connections in the primate brain. Neurology 1970;138:291-321 [DOI] [PubMed] [Google Scholar]
- 6.Saji M, Reis DJ. Delayed transneuronal death of substantia nigra neurons prevented by γ-aminobutyric acid agonist. Science 1987;235:66-69 [DOI] [PubMed] [Google Scholar]
- 7.Tamura A, Kirino T, Sano K, Takagi K, Oka H. Atrophy of the ipsilateral substantia nigra following middle cerebral artery occlusion in the rat. Brain Res 1990;510:154-157 [DOI] [PubMed] [Google Scholar]
- 8.Yamada K, Goto S, Sato K. et al. “Reactive change” of the substantia nigra neurons subsequent to striatal infarction in rats. Biomed Res 1996;17:339-346 [Google Scholar]
- 9.Tamura A, Kirino T, Fujie W, et al. Neuropathological changes in remote areas after focal cerebral ischemia. In: Ito U, Kirino T, Kuroiwa T, Klatzo I, eds. Maturation Phenomenon in Cerebral Ischemia. Berlin: Springer 1992;57-63
- 10.Nakane M, Teraoka A, Asato R, Tamura A. Degeneration of the ipsilateral substantia nigra following cerebral infarction in the striatum. Stroke 1992;23:328-332 [DOI] [PubMed] [Google Scholar]
- 11.Nakane M, Tamura A, Nagaoka T, Hirakawa K. MR detection of secondary changes remote from ischemia: preliminary observations after occlusion of the middle cerebral artery in rats. AJNR Am J Neuroradiol 1997;18:945-950 [PMC free article] [PubMed] [Google Scholar]
- 12.Nakanishi H, Tamura A, Kawai K, Yamamoto K. Electrophysiological studies of rat substantia nigra neurons in an in vitro slice preparation after middle cerebral artery occlusion. Neuroscience 1997;77:1021-1028 [DOI] [PubMed] [Google Scholar]
- 13.Tamura A, Graham DI, McCulloch J, Teasdale GM. Focal cerebral ischaemia in the rat, I: description of technique and early neuropathological consequences following middle cerebral artery occlusion. J Cereb Blood Flow Metab 1981;1:53-60 [DOI] [PubMed] [Google Scholar]
- 14.Yamamoto M, Tamura A, Kirino T, Shimizu M, Sano K. Behavioral changes after focal cerebral ischemia by left middle cerebral artery occlusion in rats. Brain Res 1988;452:323-328 [DOI] [PubMed] [Google Scholar]
- 15.Le Bihan D, Breton D, Lallemand D, Grenier P, Cabanis E, Laval-Jeantet M. MR imaging of intravoxel incoherent motions: application to diffusion and perfusion in neurologic disorders. Radiology 1986;161:401-407 [DOI] [PubMed] [Google Scholar]
- 16.Paxinos G, Watson C. The Rat Brain in Stereotaxic Coordinates.. Sydney: Academic Press 1982;
- 17.Fujie W, Kirino T, Tomukai N, Iwasawa T, Tamura A. Progressive shrinkage of the thalamus following middle cerebral artery occlusion in rats. Stroke 1990;21:1485-1488 [DOI] [PubMed] [Google Scholar]
- 18.Mintorovitch J, Yang GY, Shimizu H, Kucharczyk J, Chan PH, Weinstein PR. Diffusion-weighted magnetic resonance imaging of acute focal cerebral ischemia: comparison of signal intensity with changes in brain water and Na+,K(+)-ATPase activity. J Cereb Blood Flow Metab 1994;14:332-336 [DOI] [PubMed] [Google Scholar]
- 19.Horikawa Y, Naruse S, Tanaka C, Hirakawa K, Nishikawa H. Proton NMR relaxation times in ischemic brain edema. Stroke 1986;17:1149-1152 [DOI] [PubMed] [Google Scholar]
- 20.Benveniste H, Laurence W, Hedlund WH, Johnson GA. Mechanism of detection of acute cerebral ischemia in rats by diffusion weighted magnetic resonance microscopy. Stroke 1992;23:746-754 [DOI] [PubMed] [Google Scholar]
- 21.Kuroiwa T, Nagaoka T, Ueki M, Yamada I, Miyasaka N, Akimoto H. Different apparent diffusion coefficient: water content correlations of gray and white matter during early ischemia. Stroke 1998;29:859-865 [DOI] [PubMed] [Google Scholar]
- 22.Dijkhuizen RM, Knollema S, van der Worp HB, et al. Dynamics of cerebral tissue injury and perfusion after temporary hypoxia-ischemia in the rat: evidence for region-specific sensitivity and delayed damage. Stroke 1998;29:695-704 [DOI] [PubMed] [Google Scholar]
- 23.Tamura A, Graham DI, McCulloch J, Teasdale GM. Focal cerebral ischaemia in the rat, II: regional cerebral blood flow determined by [14C]iodoantipyrine autoradiography following middle cerebral artery occlusion. J Cereb Blood Flow Metab 1981;1:61-69 [DOI] [PubMed] [Google Scholar]
- 24.Macaya A, Munell F, Gubits RM, Burke RE. Apoptosis in substantia nigra following developmental striatal excitotoxic injury. Proc Natl Acad Sci U S A 1994;91:8117-8121 [DOI] [PMC free article] [PubMed] [Google Scholar]
- 25.Oo TF, Henchcliffe C, Burke RE. Apoptosis in substantia nigra following developmental hypoxic-ischemic injury. Neuroscience 1995;69:893-901 [DOI] [PubMed] [Google Scholar]
- 26.Yoshimura M, Saji M. Transsynaptic cell death of neurons following striatopallidal lesions does not occur in substantia nigra pars reticulata in developing rats. Brain Res Dev Brain Res 1998;105:25-33 [PubMed] [Google Scholar]
- 27.DeGiorgio LA, Dibinis C, Milner TA, Saji M, Volpe BT. Histological and temporal characteristics of nigral transneuronal degeneration after striatal injury. Brain Res 1998;795:1-9 [DOI] [PubMed] [Google Scholar]