

Abstract
BACKGROUND AND PURPOSE: Tumor progression is often difficult to distinguish from nonneoplastic treatment response on the basis of MR images alone. This study correlates metabolite levels measured by preoperative MR spectroscopic (MRS) imaging with histologic findings of biopsies, obtained during image-guided resections of brain mass lesions, to clarify the potential role of MRS in making this distinction.
METHODS: Twenty-nine patients with brain tumors underwent high-resolution (0.2–1 cc) 3D proton MRS imaging and MR imaging before undergoing surgery; 11 had a newly diagnosed neoplasm, and 18 had recurrent disease. Surgical biopsies were obtained from locations referenced on MR images by guidance with a surgical navigation system. MR spectral voxels were retrospectively centered on each of 79 biopsy locations, and metabolite levels were correlated with histologic examination of each specimen.
RESULTS: All mass lesions studied, whether attributable to tumor or noncancerous effects of previous therapy, showed abnormal MR spectra compared with normal parenchyma. When the pattern of MRS metabolites consisted of abnormally increased choline and decreased N-acetyl aspartate (NAA) resonances, histologic findings of the biopsy specimen invariably was positive for tumor. When choline and NAA resonances were below the normal range, histologic findings were variable, ranging from radiation necrosis, astrogliosis, and macrophage infiltration to mixed tissues that contained some low-, intermediate-, and high-grade tumor.
CONCLUSION: This study demonstrated that 3D MRS imaging can identify regions of viable cancer, which may be valuable for guiding surgical biopsies and focal therapy. Regions manifesting abnormal MR spectra had a mixture of histologic findings, including astrogliosis, necrosis, and neoplasm.
Each year, 15,000 new patients are diagnosed with primary brain tumors in the United States (1, 2). Gliomas are the most prevalent histologic finding. Standard therapies for patients with a central nervous system glioma include maximum safe resection, external beam radiation, focal radiation with radiosurgery or brachytherapy, and chemotherapy (3, 4). Contrast-enhanced MR imaging is the radiologic method of choice for diagnosis, local staging, and posttherapeutic monitoring of brain tumors. Although this technique is valuable for visualizing regions where the blood-brain barrier has broken down, it is not specific for tumor, and there are circumstances when it can provide ambiguous or misleading results. Examples of this are the development of a new mass lesion or an increase in contrast enhancement, which, although possibly indicative of tumor progression, may also reflect a nonneoplastic response to therapy. Although the differential diagnosis of a new or enlarged focus of abnormal contrast enhancement is not always critical to patient management decisions, there are many clinical and research settings wherein precise diagnosis is particularly important. These include management of asymptomatic patients with a new or enlarged lesion revealed by routine MR imaging as well as evaluation of response to current and future therapeutic regimens.
In vivo MR spectroscopy (MRS) is a technique that allows noninvasive monitoring of metabolites within the tissue of interest, and has the potential for providing information about a lesion's composition and response to therapy (5–34). A number of water-suppressed proton (1H) MRS techniques have been developed for obtaining spectra from selected regions within the brain (35–40). These provide either a single-spectrum (single-voxel MRS) or a multidimensional array of spectra from the region of interest (multivoxel MRS imaging). In this study, 3D MRS imaging has been applied to presurgical MR studies of brain tumors. By including both the abnormal region as well as a substantial volume of normal parenchyma in the volume of acquisition, it is possible to compare the spectral characteristics of abnormal tissue with normal tissue from within the same patient and acquired during the same imaging sequence. Volume MRS imaging also generally acquires spectra from smaller voxels than does single-voxel spectroscopy, leading to a decrease in partial volume effects and improved spatial resolution. Despite its great advantages, 3D MRS imaging has not been widely used for studies of the brain owing to the lack of commercially available software for acquisition and analysis of the large 3D arrays.
Since the late 1980s, a number of 1H MRS studies of patients with brain tumors have been conducted (7, 10–34, 41–55). Even the earliest feasibility studies have shown significant spectral differences between tumor and normal brain tissue. These differences in metabolite spectra have been consistently detected, even for different acquisition parameters, as techniques have progressed from obtaining single-voxel spectra within a tissue volume as large as 4 × 4 × 4 cm (12, 15, 19, 21, 22, 41–44) to present techniques that provide hundreds or even thousands of contiguous voxels at resolutions of 1 cc or less (45, 51–53, 55). Tumor spectra have been characterized in part by reduction in signal intensity of the N-acetyl aspartate (NAA) resonance at 2.0 ppm (NAA and other N-acetyl-containing compounds), which has been shown by extract studies to be present in millimolar concentrations, mainly within neurons (56–58). Although the majority of studies have reported increased choline levels (measured at 3.1 ppm) in tumors compared with normal brain tissue, the measured levels can be highly variable presumably because of the lesion's cellular density and to partial volume averaging tumor tissue with normal or necrotic tissues (21, 53, 59–62). The choline resonance observed in vivo comprises choline, phosphocholine, acetylcholine, phosphotidylcholine, and other choline compounds. The choline-containing compounds found in the membranes are immobile and, thus, invisible to MRS. However, during membrane turnover, there may be increased visible amounts of these compounds. Therefore, the in vivo choline signal is normally associated with increased membrane turnover or higher cellular density (63). In human brain tumor studies, tissue necrosis has been repeatedly characterized as showing abnormally decreased NAA and choline resonances in a pattern distinct from both normal parenchyma and tumor (29–34).
Recent improvements in the spatial resolution and 3D acquisition of contrast-enhanced MR images have facilitated the use of volumetric data to assist in performing image-guided surgery (64, 65). These systems allow multiple, directed biopsies to be acquired at the time of surgery and their respective locations recorded and related to the anatomic locations. Analysis of spectral results from these anatomic locations can then be directly related to histologic findings. As tumors are often quite heterogeneous, the alignment of the spectra to the biopsy location is very important to assess spectroscopy's role in discriminating among tissue types. For the present study, 3D MRS imaging was used 1) to acquire small (1-cm3) voxels to reduce partial volume averaging, 2) to acquire many voxels to allow comparisons between spectra from tumor regions and spectra from normal (MR-revealed) regions, and 3) to center the spectra retrospectively at each biopsy site, determined via a stereotactic, 3D image guidance system. Spectral patterns were correlated with histologic findings of the same brain tissues by use of image-guided biopsies to assess the role of MRS imaging for discriminating tissue types in patients with gliomas.
Methods
Patient Population
Patients scheduled for surgical resection of a brain mass lesion, to be performed using the ISG Viewing Wand (ISG Technologies, Mississauga, Ontario), were recruited into the study. Informed consent was obtained from all subjects by using a protocol approved by the Committee on Human Research at our institution. Twenty-nine adult patients with a preoperative diagnosis of primary or recurrent brain tumor (glioma) were enrolled in this study. Two patients were studied prior to two different resections, with the second study performed 6 to 8 months after the first study, for a total of 31 preoperative MRS examinations. The subjects ranged in age from 18 to 68 years. Twenty-three were male, and six were female. Eleven resections were for newly diagnosed neoplasms and 20 were for progression after prior resection, radiation, and/or chemotherapy treatments.
MR and MRS Imaging
Contrast-enhanced MR and MRS imaging were performed during a single examination the day before surgery. The MR imaging examination was necessary to facilitate the use of the ISG Viewing Wand during surgery. All MR data were obtained on a 1.5-T SIGNA (General Electric, Milwaukee, WI) clinical imaging system by use of either the standard head coil (29/31 examinations) or a surface coil for superficial lesions (2/31 examinations). Manual shimming was done to fine-tune magnetic field uniformity across the volume of interest. A pulse sequence developed in our laboratory incorporating point-resolved spectroscopy (PRESS) volume selection, and an 8 × 8 × 8 or a 16 × 8 × 8 phase-encoding matrix was used to obtain a 3D array of spectra with nominal spatial resolution of 1 cc in 17 minutes (1000/144 [TR/TE]). A spectral bandwidth of 1250 Hz was used with 512 data points. Spatial suppression pulses were applied in three dimensions to the outsides of the PRESS volume to reduce spectral contamination. The spectra were then transferred off-line to Sun SPARC workstations (Sun Microsystems, Palo Alto, CA) for processing.
Intraoperative Tissue Specimen Collection and Pathologic Examination
At the time of surgery, multiple biopsy specimens, which typically measured 2 × 3 × 3 mm3 (less than 2% of the spectroscopy voxel volume of 1 cc), were taken for each patient from within the volume to be resected. Immediately prior to the removal of a biopsy specimen, a multiplanar MR image of the origin of the biopsy was saved using the ISG Viewing Wand (Fig 1). Each tissue sample was then taken with small surgical forceps and labeled and handled separately. Biopsy specimens were fixed in formalin after removal and were submitted for routine hematoxylin eosin pathologic examination in addition to immunohistochemistry for glial fibrillary acidic protein and a macrophage marker (CD68).
fig 1.
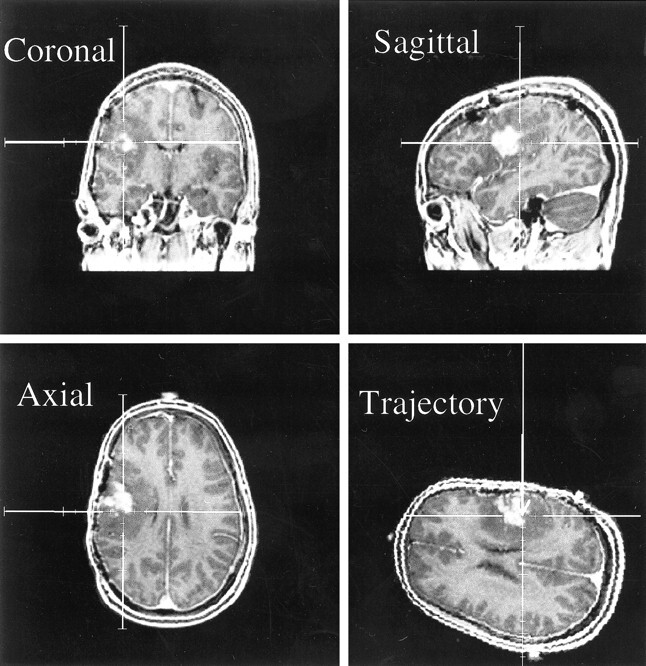
Screen saver on the ISG workstation correlating to position of biopsy for a patient with oligoastrocytoma. The spectra and images for this biopsy are shown in figure 3A. MR images are from a 3D spoiled gradient (SPGR) (34/3/1 [TR/TE/excitations]) with 1.5-mm slice thicknesses
The surgical biopsy specimens taken for this study were examined by a neuropathologist. The percentage of tumor, necrosis, and other tissue, which included white matter, gray matter, astrogliosis, and macrophage infiltration, were estimated for each biopsy sample and recorded. Additionally, the presence of astrogliosis was noted and the tumor grade assigned using the World Health Organization II criteria.
MRS Data Processing
The spectra were automatically phased, frequency aligned, and baseline corrected, and spectral parameters were calculated using software developed in this laboratory. Choline, creatine and NAA peak areas were estimated by integrating the resonances at 3.2, 3.0 and 2.0 ppm, respectively. Normal values for each metabolite peak area were determined by averaging values in 10 to 20 voxels selected within brain parenchyma with a normal MR appearance, usually in the hemisphere contralateral to the primary tumor. Datasets were excluded when there was poor shimming such that the choline and creatine peaks were not resolvable, when the signal to noise of the spectral peaks was below 5:1, or when the water or lipid suppression was inadequate for accurate removal of the baseline below the peaks of interest.
The volume MRS imaging dataset was then resampled to center a single 1 × 1 × 1 cm3 voxel at each biopsy site on the basis of coordinates obtained at surgery. The metabolite spectrum of this voxel was analyzed, and the ratios of choline/NAA, choline/normal choline, and NAA/normal NAA were calculated and correlated to the histologic findings for each biopsy specimen. In order to resample the spectroscopy with a voxel centered precisely at each biopsy site, it was necessary to identify the coordinates of the biopsy site within the MRS imaging dataset. It was assumed there was no motion of the head and brain between the time of the MR image acquisition and the subsequent MRS imaging component of the examination. During surgery, the biopsy locations were recorded on the MR images. Coordinates of these locations were determined by visually aligning the MR images to the recorded biopsy location image.
For the MRS imaging examinations (three of 31) that were done at a different time than preoperative MR imaging, the volume MR images acquired in the MRS imaging examination were retrospectively aligned, using registration software developed in this laboratory (66), to the preoperative volume MR images to allow the spatial correlation of the biopsy site coordinates to the MRS imaging data.
Results
Good-quality MRS imaging data were obtained from 28 of the 31 MR examinations performed as part of this study. The remaining three examinations yielded poor spectral quality, as defined in the Methods section, and were excluded from the analysis. From the 28 MR examinations that had good-quality spectra, a total of 86 biopsy specimens were obtained. Correlations with the resampled spectroscopy voxels centered at the biopsy sites were possible for 79 of the biopsies. The remaining seven biopsy specimens were from regions outside the MRS imaging volume.
Considerable heterogeneity was present within the tissues of the surgical specimens, which typically measured 2 × 3 × 3 mm3 (less than 2% of the nominal spectroscopy voxel resolution of 1 cc). Some specimens were solid, densely cellular neoplasms; others were mostly necrotic, with a small percentage by volume of tumor cells. Although all of the patients had at some point a diagnosis of tumor, two of the 28 examinations had no histologically identifiable tumor from the biopsies obtained in this study. Tumor later progressed in both of these patients. For the 26 patients (28 resections) included in the MRS analysis, histologic grading demonstrated the following breakdown of the patient population: grade I, one astrocytoma; grade II, three oligoastrocytoma, one astrocytoma; grade III, five anaplastic oligoastrocytoma, five anaplastic astrocytoma, one anaplastic ependymoma; and grade IV, 10 glioblastoma multiforme (GBM). Ten of the tumors were newly diagnosed, and thus, untreated.
Although the spectra from normal-appearing brain tissue were similar in terms of their choline, creatine, and NAA levels, spectra from the mass lesions all showed a reduction in the NAA resonance, and many showed an elevation in the choline resonance. This is illustrated by the case of oligoastrocytoma, shown in Figure 2, wherein a contiguous region of six voxels had spectra with these characteristics.
fig 2.

A, Axial image from a contrast-enhanced SPGR 3D volume dataset (34/3/1) of a patient with an oligoastrocytoma. The locations for which spectra are reconstructed are shown by the grid.
B, Spectral array (16 × 8 × 8 [phase encodes], 1000/144/1) corresponding to the grid shown in the image of A. Note the high NAA levels and moderate choline and creatine levels in the spectra corresponding to the normal MR regions (right side of spectral array). Note the very high choline and low NAA in portions of the contrast enhancement and surrounding tissue (dashed lines) and the lower metabolites in adjacent tissue (double lines).
There were cases in which the MR imaging results were very similar for different biopsy specimens, but the histologic and spectral results were quite different. In the case shown in Figure 3, the two biopsy locations shown each have partial contrast enhancement within the spectral voxel. However, the histologic analysis from one biopsy specimen demonstrated a high percentage (75%) of oligoastrocytoma cells, whereas the other biopsy specimen had astrogliosis and white matter, but no definite tumor. Choline was highly elevated in the spectrum with a high percentage of tumor (1.8 times normal) and was reduced (0.7 times normal) in the spectrum centered on the biopsy site, with no tumor noted after histologic analysis. NAA was very low for both of these spectra.
fig 3.

Contrast-enhanced SPGR (34/3/1) MR and MRS (16 × 8 × 8, 1000/144/1) data from a patient with oligoastrocytoma.
A, MR location and the spectrum for a biopsy that yielded 75% oligoastrocytoma. Note the elevated choline (1.8 times normal) and absent NAA levels.
B, MR location and the spectrum for a biopsy that correlated with the pathologic finding of necrosis, astrogliosis, and white matter. Note the minimal choline, creatine and NAA resonances in this spectrum. Although the image intensity is similar to the region in A, significant spectral differences were observed with elevated choline/normal choline levels correlated with the presence of tumor.
Histologic specimens obtained as part of this study also demonstrated differences in the percentage of viable tumor from the different sites within the same patient. The choline resonance was most prominent in the regions with a high percentage of tumor and progressively lower in the moderate- and low-percentage tumor locations. This suggests that an elevation of tumor cell density correlates with an elevation in choline levels, and is demonstrated in Figure 4, for a patient with a newly diagnosed GBM.
fig 4.

Multiple MR spectra (16 × 8 × 8, 1000/144/1) and corresponding images (contrast-enhanced SPGR [34/3/1]) centered on biopsy locations for a patient with a newly diagnosed GBM. Higher normalized choline levels were observed in the location of the biopsy with 90% tumor compared with others of lower percentages. (WM = white matter)
A further general finding was that regions of astrogliosis/necrosis correlated with spectra with low NAA (NAA/normal NAA = 0.13 ± 0.16) and choline levels ranging from nondetectable to near-normal levels. The mean choline/normal choline ratio for samples identified as having astrogliosis, but no tumor, was 0.69 ± 0.53.
In an example in which the histologic analysis comprised low cellularity white matter, the MRS imaging data demonstrated low but observable choline, creatine, and NAA resonances. The NAA peak seems to indicate normal brain tissue, either gray matter or white matter. Although it is present in spectra that contain white matter, such as in Figure 4, it is not present in the other tumor and necrotic spectra.
An overall assessment of the metabolite levels for different tissues is given in the Table and Figure 5. These demonstrate the low NAA levels found throughout the abnormal tissues sampled by biopsy. All tissue groups in which biopsies were performed contained significantly lower NAA than did the normal-appearing white matter. Choline, on the other hand, was significantly elevated in those biopsies that were mainly tumor. Figure 5 illustrates the good separation between biopsies with greater than 90% tumor and biopsies without any tumor and between these groups and normal regions determined on the basis of normalized choline and NAA levels.
Normalized metabolite levels in different tissues
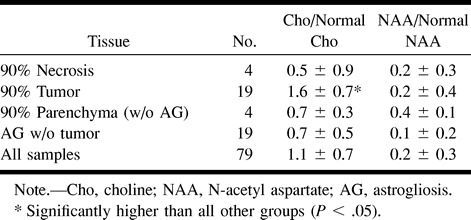
fig 5.

Metabolite levels in different tissues. The ellipses show the mean ± SD. for each tissue type. Abnormal regions have significantly lower normalized NAA, whereas tumor regions also have significantly increased normalized choline levels
When MRS showed choline elevated two standard deviations above normal and NAA decreased two standard deviations below normal levels, the histologic specimen was invariably tumor (21/21). When the choline resonance was larger than the NAA resonance and larger than the normal choline levels, histologic findings were usually tumor (32/37 [85%]). When MRS demonstrated choline/normal choline ratios below the normal level and NAA decreased below normal levels, the histologic specimen ranged from radiation necrosis, astrogliosis, and macrophage infiltration to mixtures containing low-, intermediate- and high-grade tumor. Only 44% (18/41) of these specimens contained any histologically confirmed tumors. In the newly diagnosed, untreated patients, 89% of spectra with this pattern were histologically confirmed tumors. In fact, both treated patients and patients with GBMs tended to have lower choline levels than those with untreated or lower-grade tumors. Patients with a diagnosis of oligoastrocytoma were significantly more likely to have elevated choline than were the other patients (P<.006 [χ2 analysis]).
Discussion
MR imaging is very useful for identifying pathologic abnormalities, but has limitations when evaluating gliomas. One such limitation of conventional MR imaging is that tumor and radiation necrosis may appear very similar to enhancing masses. In such cases, the MRS imaging data correlated more closely with histologic findings and provided a tool for assessing tumor presence and extent. Abnormal MR regions had consistently lower NAA than in normal-appearing tissue, which is consistent with the theory that NAA is found primarily in neurons, and that tumor and necrotic and reactive tissues all demonstrate an abnormally low neuronal cell density. Tumor regions had significantly increased choline and decreased NAA compared with normal tissue. Lower levels of choline may still be associated with a mixture of tumor and necrosis. Although the highest levels of choline were found in grade II and III gliomas, both treated patients and patients with GBMs tended to have lower choline levels. Spectra from regions with astrogliosis showed low NAA but observable levels of choline and creatine. These results are consistent with those found from single-voxel spectroscopy (12, 15, 19, 41–44), MRS imaging (53–55), high-resolution nuclear MR imaging (59–62), and magic-angle spinning MRS of biopsy samples (67–69). In this study, however, 3D MRS imaging allowed assessment of multiple, small measurements from individual patients and, combined with the image guidance system, allowed the spectra and the biopsy results to be centered in the same locations, reducing effects from partial voluming and heterogeneity. Although extract studies can yield more distinct spectral differences and allow the comparison of histologic analysis and spectroscopy from the same small tissue sample, they depend upon the most appropriate tissue being sampled and can be adversely affected by postextraction tissue changes. Also, although a tissue extract may be performed at the time of initial biopsy or at surgery, it is not practical or desirable for routine imaging, treatment planning, and treatment follow-up. For such cases, an in vivo technique is required. This study showed that in vivo 3D MRS imaging could identify regions of tumor and discriminate them from normal tissue.
Many of the subjects had very heterogeneous tissue, shown by both histologic analysis and spectroscopy, underlining the need for accurate diagnosis before performing targeted therapies. Although the spectra did not always correlate with the biopsies, it must be remembered that the histologic analysis is performed on a fraction of the biopsy tissue, which is in turn only a few percent of the volume of the spectral voxel. This difference in size was especially problematic near the borders of different types of tissues. Another limitation of this type of analysis was that the number of biopsy samples taken was relatively small, generally less than five per patient, and they were not always taken from the most spectrally abnormal tissue.
This study shows the feasibility of obtaining MRS imaging data during the same sitting as a standard preoperative MR examination, and suggests that 1H MRS imaging may be useful for guiding stereotatic biopsies. As the number of biopsies taken per patient is typically small, sampling error may occur, leading to an inaccurate tumor grade for the patient. As tumor grade is a strong indicator of clinical progression, treatment decisions often heavily rely on this information. By guiding stereotactic biopsies to the regions with low NAA and high choline, sampling error may be reduced and better diagnoses determined. Proton MRS imaging is also likely to contribute in treatment planning, particularly for focal treatments, and for the assessment of treatment efficacy in follow-up. As 1H MRS was more closely correlated with histologic findings than were MR images, treatment planning should take these data into account in defining the target for focal therapy.
Conclusion
This study showed that tissues appearing similar on conventional MR images may have different spectral characteristics. Abnormal metabolite levels were found in a range of histologic specimens, including astrogliosis, necrosis, and neoplasm. The presence of elevated choline and decreased NAA correlated with tumor histologic findings and may be used in distinguishing regions of viable cancer from normal and other noncancerous tissue, such as necrosis and astrogliosis. This suggests that 3D MRS imaging may be valuable for guiding surgical biopsies and planning focal therapies.
Acknowledgments
The authors thank Mary Hanna and the GE Medical Systems Spectroscopy Group for their assistance. The authors also thank the MR technologists who helped with this project, Pauline Bartholomew, Patricia Memon, Evelyn Proctor and Niles Bruce.
Footnotes
This project was funded by a grants from the American Cancer Society (RPG-93-023-06-CCE) and the National Cancer Institute (ROI CA79719, CA57236).
Address reprint requests to Daniel B. Vigneron, Magnetic Resonance Science Center, Department of Radiology, Box 1290, University of California, San Francisco, CA 94143-1290.
References
- 1.Landis SH, Murray T, Bolden S, Wingo PA. Cancer statistics, 1998. CA Cancer J Clin 1998;8:6-29 [DOI] [PubMed] [Google Scholar]
- 2.Nelson DJ, McDonald JV, Lapham LW, Qazi R, Rubin P. Central nervous system tumors. In: Rubin P, eds. Clinical Oncology A Multidisciplinary Approach for Physicians and Students. 7th ed. Philadelphia: WB Saunders Company 1993;
- 3.Black P, Wen P. Clinical, imaging and laboratory diagnosis of brain tumors. In: Kaye A, Laws E, eds. Brain Tumors. New York: Churchill Livingstone 1995;
- 4.Giles G, Gonzales M. Epidemiology of brain tumors and factors in prognosis. In: Kaye A, Laws E, eds. Brain Tumors. New York: Churchill Livingstone 1995;
- 5.Bottomley PA. Human in vivo NMR spectroscopy in diagnostic medicine: clinical tool or research probe? Radiology 1989;170:1-15 [DOI] [PubMed] [Google Scholar]
- 6.Cohen SM. Physiological NMR spectroscopy: from isolated cells to man. New York: New York Academy of Sciences 1987; [PubMed]
- 7.Barker PB, Glickson JD, Bryan RN. In vivo magnetic resonance spectroscopy of human brain tumors. Top Magn Reson Imaging 1993;5:32-45 [PubMed] [Google Scholar]
- 8.Radda GK, Bore PJ, Rajagopalan B. Clinical aspects of NMR spectroscopy. Br Med Bull 1984;40:155-160 [DOI] [PubMed] [Google Scholar]
- 9.Matson GB, Weiner MW. MR spectroscopy in vivo: principles, animal studies and clinical applications. In: Stark DD, Bradley WG, eds. Magn Reson Imaging St. Louis: Mosby 1988:201-228 [Google Scholar]
- 10.Glickson JD. Clinical NMR spectroscopy of tumors: current status and future directions. Invest Radiol 1989;24:1011-1016 [DOI] [PubMed] [Google Scholar]
- 11.Arle JE, Morriss C, Wang ZJ, Zimmerman RA, Phillips PG, Sutton LN. Prediction of posterior fossa tumor type in children by means of magnetic resonance image properties, spectroscopy, and neural networks. J Neurosurg 1997;86:755-761 [DOI] [PubMed] [Google Scholar]
- 12.Arnold D, Shoubridge E, Villemure J, Feindel W. Proton and phosphorus magnetic resonance spectroscopy of human astrocytomas in vivo. Preliminary observations on tumor grading. NMR Biomed 1990;3:184-189 [DOI] [PubMed] [Google Scholar]
- 13.Bárány M, Langer BG, Glick RP, Venkatasubramanian PN, Wilbur AC, Spigos DG. In vivo H-1 spectroscopy in humans at 1.5 T. Radiology 1988;167:839-844 [DOI] [PubMed] [Google Scholar]
- 14.Broniscer A, Gajjar A, Bhargava R, et al. Brain stem involvement in children with neurofibromatosis type 1: role of magnetic resonance imaging and spectroscopy in the distinction from diffuse pontine glioma. Neurosurgery 1997;40:331-338 [DOI] [PubMed] [Google Scholar]
- 15.Bruhn H, Frahm J, Gyngell M, et al. Noninvasive differentiation of tumors with use of localized H-1 MR spectroscopy in vivo: initial experience in patients with cerebral tumors [see comments]. Radiology 1989;172:541-548 [DOI] [PubMed] [Google Scholar]
- 16.Daly PF, Cohen JS. Magnetic resonance spectroscopy of tumors and potential in vivo clinical applications: a review. Cancer Res 1989;49:770-779 [PubMed] [Google Scholar]
- 17.Gill SS, Small RK, Thomas DG, et al. Brain metabolites as 1H NMR markers of neuronal and glial disorders. NMR Biomed 1989;2:196-200 [DOI] [PubMed] [Google Scholar]
- 18.Go KG, Keuter EJ, Kamman RL, et al. Contribution of magnetic resonance spectroscopic imaging and L-[1–11C]tyrosine positron emission tomography to localization of cerebral gliomas for biopsy. Neurosurgery 1994;34:994-1002 [DOI] [PubMed] [Google Scholar]
- 19.Langkowski JH, Wieland J, Bomsdorf H, et al. Pre-operative localized in vivo proton spectroscopy in cerebral tumors at 4.0 Tesla—first results. Magn Reson Imaging 1989;7:547-555 [DOI] [PubMed] [Google Scholar]
- 20.Moats RA, Watson L, Shonk T, et al. Added value of automated clinical proton MR spectroscopy of the brain. J Comput Assist Tomogr 1995;19:480-491 [DOI] [PubMed] [Google Scholar]
- 21.Negendank WG, Sauter R, Brown TR, et al. Proton magnetic resonance spectroscopy in patients with glial tumors: a multicenter study. J Neurosurg 1996;84:449-458 [DOI] [PubMed] [Google Scholar]
- 22.Negendank W. Studies of human tumors by MRS: a review. NMR Biomed 1992;5:303-324 [DOI] [PubMed] [Google Scholar]
- 23.Shimizu H, Kumabe T, Tominaga T, et al. Noninvasive evaluation of malignancy of brain tumors with proton MR spectroscopy. AJNR Am J Neuroradiol 1996;17:737-747 [PMC free article] [PubMed] [Google Scholar]
- 24.Sijens PE, Knopp MV, Brunetti A, et al. 1H MR spectroscopy in patients with metastatic brain tumors: a multicenter study. Magn Reson Med 1995;33:818-826 [DOI] [PubMed] [Google Scholar]
- 25.Tzika AA, Vajapeyam S, Barnes PD. Multivoxel proton MR spectroscopy and hemodynamic MR imaging of childhood brain tumors: preliminary observations. AJNR Am J Neuroradiol 1997;18:203-218 [PMC free article] [PubMed] [Google Scholar]
- 26.Tzika AA, Vigneron DB, Dunn RS, Nelson SJ, Ball WS Jr. Intracranial tumors in children: small single-voxel proton MR spectroscopy using short- and long-echo sequences. Neuroradiology 1996;38:254-263 [DOI] [PubMed] [Google Scholar]
- 27.Wang Z, Sutton LN, Cnaan A, et al. Proton MR spectroscopy of pediatric cerebellar tumors. AJNR Am J Neuroradiol 1995;16:1821-1833 [PMC free article] [PubMed] [Google Scholar]
- 28.Wang Z, Zimmerman RA, Sauter R. Proton MR spectroscopy of the brain: clinically useful information obtained in assessing CNS diseases in children. AJR Am J Roentgenol 1996;167:191-199 [DOI] [PubMed] [Google Scholar]
- 29.Kamada K, Houkin K, Abe H, Sawamura Y, Kashiwaba T. Differentiation of cerebral radiation necrosis from tumor recurrence by proton magnetic resonance spectroscopy. Neurol Med Chir 1997;37:250-256 [DOI] [PubMed] [Google Scholar]
- 30.Sijens PE, Vecht CJ, Levendag PC, van Dijk P, Oudkerk M. Hydrogen magnetic resonance spectroscopy follow-up after radiation therapy of human brain cancer. Unexpected inverse correlation between the changes in tumor choline level and post-gadolinium magnetic resonance imaging contrast. Invest Radiol 1995;30:738-744 [DOI] [PubMed] [Google Scholar]
- 31.Taylor JS, Langston JW, Reddick WE, et al. Clinical value of proton magnetic resonance spectroscopy for differentiating recurrent or residual brain tumor from delayed cerebral necrosis. Int J Rad Oncol Biol Phys 1996;36:1251-1261 [DOI] [PubMed] [Google Scholar]
- 32.Tien RD, Lai PH, Smith JS, Lazeyras F. Single-voxel proton brain spectrsocopy exam (PROBE/SV) in patients with primary brain tumors. AJR Am J Roentgenol 1996;167:201-209 [DOI] [PubMed] [Google Scholar]
- 33.Tomoi M, Kimura H, Yoshida M, et al. Alterations of lactate (+lipid) concentration in brain tumors with in vivo hydrogen magnetic resonance spectroscopy during radiotherapy. Invest Radiol 1997;32:288-296 [DOI] [PubMed] [Google Scholar]
- 34.Usenius T, Usenius JP, Tenhunen M, et al. Radiation-induced changes in human brain metabolites as studied by 1H nuclear magnetic resonance spectroscopy in vivo. Int J Rad Oncol Biol Phys 1995;33:719-724 [DOI] [PubMed] [Google Scholar]
- 35.Frahm J, Bruhn H, Gyngell ML, Merboldt KD, Hänicke W, Sauter R. Localized high-resolution proton NMR spectroscopy using stimulated echoes; initial applications to human brain in vivo. Magn Reson Med 1989;9:79-93 [DOI] [PubMed] [Google Scholar]
- 36.Frahm J, Michaelis T, Merboldt KD, Bruhn H, Gynchell ML, Hanicke W. Improvements in localized proton NMR spectroscopy of human brain, water suppression, short echo times, and 1 ml resolution. J Magn Reson 1990;90:464-473 [Google Scholar]
- 37.Duijn JH, Matson GB, Maudsley AA, Weiner MW. 3D phase-encoding 1H spectroscopic imaging of human brain. Magn Reson Imaging 1992;10:315-319 [DOI] [PubMed] [Google Scholar]
- 38.Luyten PR, Mariën AJ, den Hollander JA. Acquisition and quantitiation in proton spectroscopy. NMR Biomed 1991;4:64-69 [DOI] [PubMed] [Google Scholar]
- 39.Moonen CTW, von Kienlin M, van Zijl PCM, Cohen J, Gillen J, Daly P, Wolf G. Comparison of single-shot localization methods (STEAM and PRESS) for in vivo proton NMR spectroscopy. NMR Biomed 1989;2:201-208 [DOI] [PubMed] [Google Scholar]
- 40.Bottomley PA. Selective volume method for performing localized NMR spectroscopy. US patent 4 480 228 1984;
- 41.Damaerel P, Johannik K, Van Hecke P, et al. Localized 1H NMR spectroscopy in fifty new cases of newly diagnosed intracranial tumors. J Comput Assist Tomogr 1991;15:67-76 [DOI] [PubMed] [Google Scholar]
- 42.Alger JR, Frank JA, Bizzi A, et al. Metabolism of human gliomas: assessment with H-1 MR spectroscopy and F-18 flourodeoxyglucose PET. Radiology 1990;177:633-641 [DOI] [PubMed] [Google Scholar]
- 43.Gill SS, Thomas DG, Van Bruggen N, et al. Proton MR spectroscopy of intracranial tumors: in vivo and in vitro studies. J Comp Assist Tomogr 1990;14:497-504 [DOI] [PubMed] [Google Scholar]
- 44.Kugel H, Heindel W, Ernestus RI, Bunke J, du Mesnil R, Friedman G. Human brain tumors: spectral patterns detected with localized H-1 MR spectroscopy. Radiology 1992;183:701-709 [DOI] [PubMed] [Google Scholar]
- 45.Barker PB, Glickson JD, Bryan RN. In vivo magnetic resonance of human brain tumors. Top Magn Reson Imaging 1993;5:32-45 [PubMed] [Google Scholar]
- 46.Chang L, Mc Bride D, Miller BL, et al. Localized in vivo 1H magnetic resonance spectroscopy and in vitro analyses of hetergeneous brain tumors. J Neuroimag 1995;5:157-163 [DOI] [PubMed] [Google Scholar]
- 47.McBride DQ, Miller BL, Nikas DL, et al. Analysis of brain tumors using 1H magnetic resonance spectroscopy. Surg Neurol 1995;44:137-144 [DOI] [PubMed] [Google Scholar]
- 48.Usenius JP, Kauppinen RA, Vaino P, et al. Quantitative metabolite patterns of human brain tumors: detection by 1H NMR spectroscopy in vivo and in vitro. J Comp Assist Tomogr 1994;18:705-713 [DOI] [PubMed] [Google Scholar]
- 49.Usenius JP, Vaino P, Hernesniemi J, Kauppinen RA. Choline-containing compounds in human astrocytomas studied by 1H NMR spectroscopy in vivo and in vitro. J Neurochem 1994;63:1538-1543 [DOI] [PubMed] [Google Scholar]
- 50.Heesters MA, Kamman RL, Mooyaart EL, Go KG. Localized proton spectroscopy of in operable brain tumuors. Response to radiation therapy. J Neuro-Oncol 1993;17:27-35 [DOI] [PubMed] [Google Scholar]
- 51.Segebarth CM, Baleriaux DF, Luyten PR, den Hollander JA. Detection of metabolic heterogeneity of human intracranial tumors in vivo by H-1 NMR spectroscopic imaging. Magn Reson Med 1990;13:62-76 [DOI] [PubMed] [Google Scholar]
- 52.Luyten PR, Marien AJ, Heindel W, et al. Metabolic imaging of patients with intracranial tumors: H-1 MR spectroscopic imaging and PET. Radiology 1990;176:791-799 [DOI] [PubMed] [Google Scholar]
- 53.Fulham MJ, Bizzi A, Dietz MJ, et al. Mapping of brain tumor metabolites with proton MR spectroscopic imaging: clinical relevance. Radiology 1992;185:675-686 [DOI] [PubMed] [Google Scholar]
- 54.Go KG, Keuter EJ, Kamman RL, et al. Contribution of magnetic resonance spectroscopic imaging and L-[1-11C]Tyrosine positron emission tomography to localization of cerebral gliomas for biopsy. Neurosurgery 1994;34:994-1002 [DOI] [PubMed] [Google Scholar]
- 55.Preul MC, Caramanos Z, Collins DL, et al. Accurate non-invasive diagnosis of human brain tumors by using proton magnetic resonance spectroscopy. Nat Med 1996;2:323-325 [DOI] [PubMed] [Google Scholar]
- 56.Simmons ML, Frondoza CG, Coyle JT. Immunocytochemical localization of N-acetyl-aspartate with monoclonal antibodies. Neuroscience 1991;45:37-45 [DOI] [PubMed] [Google Scholar]
- 57.Petroff O, Spencer D, Alger J, Prichard J. High-field proton magnetic resonance spectrsocopy of human cerebrum obtained during surgery for epilepsy. Neurology 1989;39:1197-1202 [DOI] [PubMed] [Google Scholar]
- 58.Urenjak J, Williams S, Gadian D, Noble M. Proton nuclear magnetic resonance spectroscopy unambiguously identifies different neural cell types. J Neurosci 1993;13:981-989 [DOI] [PMC free article] [PubMed] [Google Scholar]
- 59.Peeling J, Sutherland G. High-resolution 1H NMR spectroscopy studies of extracts of human cerebral neoplasms. Magn Reson Med 1992;24:123-136 [DOI] [PubMed] [Google Scholar]
- 60.Kinoshita Y, Kajiwara H, Yokota A, Koga Y. Proton magnetic resonance spectroscopy of astrocytic tumors: an in vitro study. Neurol Med Chir 1993;33:350-359 [DOI] [PubMed] [Google Scholar]
- 61.Kinoshita Y, Kajiwara H, Yokota A, Koga Y. Proton magnetic resonance spectroscopy of brain tumors: an in vitro study. Neurosurgery 1994;35:606-613 [DOI] [PubMed] [Google Scholar]
- 62.Rutter A, Hugenholtz H, Saunders JK, et al. Classification of brain tumors by ex vivo 1H NMR spectroscopy. J Neurochem 1995;64:1655-1661 [DOI] [PubMed] [Google Scholar]
- 63.Michaelis T, Merboldt KD, Bruhn H, Hänicke W, Frahm J. Absolute concentrations of metabolites in the adult human brain in vivo: quantification of localized proton MR spectra. Neuroradiology 1993;187:219-227 [DOI] [PubMed] [Google Scholar]
- 64.McDermott MW, Gutin PH, Edwards MSB, Barbaro NM, Dillon WP, Wilson CB. Frameless stereotactic neurosurgery: clinical experience using the ISG wand. Can J Neurol Sci 1994;21: (Suppl.2) 16 [Google Scholar]
- 65.McDermott MW. Image guided surgery. In: Berstein M, Berger MS, eds. Essentials in Neuro-Oncology New York: Thieme Medical Publishers 2000;
- 66.Nelson SJ, Nalbandian AB, Proctor E, Vigneron DB. Registration of images from sequential MR studies of the brain. J Magn Reson Imaging 1994;4:877-883 [DOI] [PubMed] [Google Scholar]
- 67.Barton SJ, Howe FA, Tomlins AM, Cudlip SA, Nicholson JK, Bell BA, Griffiths JR. Comparison of in vivo 1H MRS of human brain tumours with 1H HR-MAS spectroscopy of intact biopsy samples in vitro. Magma 1999;8:121-128 [DOI] [PubMed] [Google Scholar]
- 68.Cheng LL, Chang IW, Louis DN, Gonzalez RG. Correlation of high-resolution magic angle spinning proton magnetic resonance spectroscopy with histopathology of intact human brain tumor specimens. Cancer Res 1998;58:1825-1832 [PubMed] [Google Scholar]
- 69.Cheng LL, Ma MJ, Becerra L, Ptak T, Tracey I, Lackner A, Gonzaalez RG. Quantitative neuropathology by high resolution magic angle spinning proton magnetic resonance spectroscopy. Proc of the Natl Acad of Sciences of the USA 1997;94:6408-6413 [DOI] [PMC free article] [PubMed] [Google Scholar]