

Abstract
PURPOSE: To optimize the multi CTA (MSCTA) protocol, the influence of pitch, kilovoltage peak (kVp), reconstruction algorithm, type, and orientation of the clip on clip-induced artifacts was investigated in a phantom study. Also, the influence of kVp, concentration of contrast material, and clip orientation in clipped patients was studied.
METHODS: A phantom containing a clip was scanned with varying parameters. Artifact was quantified with 3D volumetry. Artifact volumes were compared for the different parameters. In addition, the number of artifact streaks was presented as a function of the pitch. Five clipped patients were scanned with 90 kVp and 120 kVp and 5 with 120 kVp and 140 kVp. The artifact area was compared. The visualization at the clip site was evaluated for different clip orientations in 50 patients, and for 140 kVp with 370 mg iodine/mL contrast (I/mL) compared with 120 kVp/300 mg I/mL in 7 patients.
RESULTS: Up to a pitch of 0.6, there was hardly an increase in artifact. Higher kVp and linear interpolation resulted in fewer artifacts. Alloy clips containing cobalt produced more artifact than did titanium clips. Clips positioned perpendicular to the scan plane led to significantly less artifact. In patients with clips, scanning with 140 kVp/370 mgI/mL led to a decrease of artifact area and a better visualization of the clip site. The visualization at the clip site was also better for clips perpendicular to the scan plane.
CONCLUSIONS: If clip artifacts are to be minimized, we suggest scanning with a pitch of 0.6, by using 140 kVp and 370 mgI/mL contrast.
Patients who survive subarachnoid hemorrhages and are surgically treated by means of clipping are at risk for mortality or morbidity in the postoperative period because of vasospasm-related delayed cerebral ischemia1 or rebleeding from an incompletely clipped aneurysm.2,3 Also, on long-term follow-up, these patients have increased risk for a new episode of bleeding, which may arise from either a regrowth aneurysm at the clip site or from a de novo aneurysm that develops at a location different than the clip site.3-6 To facilitate early diagnosis of vasospasm, incompletely clipped aneurysms, or regrowth and de novo aneurysms, follow-up imaging of the intracranial vessels is required.
Digital subtraction conventional angiography (DSA) is seen as the gold standard and carries a very low risk (0.07%) for developing permanent cerebrovascular complications,7 though it is time consuming as a screening tool. MR angiography (MRA) is not a reasonable alternative, because the clip-induced signal intensity loss precludes the evaluation in the vicinity of the clip.8 CT angiography (CTA) measures the vessel diameter accurately and is consequently useful for detecting vasospasm9,10 and seems promising for screening patients with previously clipped aneurysms. With the introduction of multi CTA (MSCTA), better visualization of small vascular details can be obtained, leading to detection of smaller aneurysms.10-12 The main problem in visualizing intracranial blood vessels in clipped patients is clip-induced artifacts, which hamper evaluation of the aneurysm neck and surrounding vascular structures.
Few articles report on the role of CTA for postoperative evaluation of patients treated with clips.12-15 CTA was considered valuable in the postoperative evaluation of patients treated with titanium clips13 however, patients are still treated with alloy clips containing cobalt, and, when screening for new aneurysms years after treatment, a considerable percentage of patients will have cobalt-containing alloy clips.
We undertook this study to investigate the influence of pitch, kilovoltage peak (kVp), reconstruction algorithm, and orientation of the clip relative to the scan plane on clip-induced artifacts in a phantom study and studied the influence of kVp and orientation of the clip in patients with clipped intracranial aneurysms, to optimize the CTA protocol for this specific subgroup of patients.
Materials and Methods
All CT data were acquired on a 16-section CT scanner (MX8000 IDT, Philips Medical Systems, Best, the Netherlands). The study was approved by the ethics committee of the participating university medical center. Informed consent was obtained from all patients.
Phantom
A cylindrical polymethylmethacrylate (PMMA) phantom (thickness, 60 mm; diameter, 185 mm) was used. In the center of the phantom, a 5-cm PMMA cylinder could be inserted, into which a titanium or cobalt clip was placed (Sugita clip no. 2, Mizuho, Tokyo, Japan; volume, 25–26 mm3), positioned with its long axis either in the scan plane or perpendicular to the scan plane (Fig 1).
Fig 1.

Phantom. A cylindrical PMMA phantom (A) with a cylinder containing a clip (B).
To investigate the influence of varying pitch, the phantom was scanned in high-resolution mode (small focal spot, quarter detector offset, resolution: 16 line pairs per centimeter) with a pitch (P) varying between 0.3 and 1 and in standard mode (large focal spot, no detector offset, resolution: 12 lp/cm) with a pitch varying between 0.3 and 1.5, both at intervals of 0.1. To investigate the influence of kVp, scans were acquired by using 90, 120, or 140 kVp with 450 (up to pitch of 0.7), 200 or 135 mAs, respectively, keeping the CT dose index (CTDIvol) : average local dose to a patient within the scan volume16 constant at 28 mGy. From pitch 0.8 to 1.5, it was not possible to scan with 450 mAs, and, with increasing pitch, the maximal kVp decreased to 245 mAs at pitch of 1.5. Thus, scanning was performed with lower CTDIvol..
The 120-kVp acquisitions were reconstructed with either linear interpolation or conebeam reconstruction (SP filter) : data interpolation algorithm, correcting for effects of the conebeam geometry of the radiographic beam.16 The 90- and 140-kVp acquisitions were reconstructed by using only linear interpolation. All scans were acquired with the long axis of the clips in the scan plane. In addition, we performed acquisitions with the long axis of the clips perpendicular to the scan plane at 120 kVp. Other scan parameters were collimation, 16 × 0.75; rotation time, 0.75 seconds; section thickness, 1.0 mm; reconstruction increment, 0.5 mm; slightly smoothing head filter (filter B for Philips scanner); field of view, 160 mm; matrix, 512 × 512.
Patients
We assessed the influence of clip orientation and kVp on the visualization of the clip site in clinical practice. Patients were selected from a CTA screening program for regrowth and de novo aneurysms in clipped patients. Patients were scanned with the following protocol: 120 kVp; 200 mAs; collimation, 16 × 0.75; rotation time, 0.75 seconds; pitch, 0.6; section thickness, 1 mm; reconstruction increment, 0.5 mm; filter B, by using 70 mL nonionic contrast of 300 mg I/mL (Iopromide, Ultravist 300, Schering, Berlin, Germany): 50 mL at a rate of 5 mL/s, 20 mL at a rate of 3 mL/s, and a 30 mL saline flush at a rate of 3 mL/s.
To assess the influence of clip orientation on clip-induced artifacts in clinical practice, we selected 50 patients who were treated with only one clip. Depending on aneurysm characteristics, different clips were used. Clip sizes and volumes were comparable with the clips used in the phantom study.
To study the effect of kVp on the amount of clip artifact, we also scanned the region of the clip with 90 kVp and 450 mAs in 5 patients and in another 5 with 140 kVp and 135 mAs. The CTDIvol was kept constant at 28 mGy for the 3 kVp/mAs combinations. On the basis of findings in the phantom study and the 10 patients in whom the region of the clip was scanned twice, we performed a follow-up scan of 7 patients, 1 year after screening, by using 140kVp/135 mAs. At 140 kVp, however, the attenuation of iodine-containing contrast, and thus arterial enhancement, is decreased compared with 120 kVp.17,18 To compensate for this loss of enhancement, we used contrast with an iodine concentration of 370 mg I/mL.
Artifact Quantification
All measurements were done on a workstation (MX View; Philips Medical Systems). The clip-induced artifact was composed of white and black components and was affected by the window width and the position of the clip to the scan plane. The white component consisted of a local halo surrounding the clip and a variable number of white streaks, radiating in all directions. The black component was bandlike and emanated on either side from the end of the clip (Fig 2).
Fig 2.
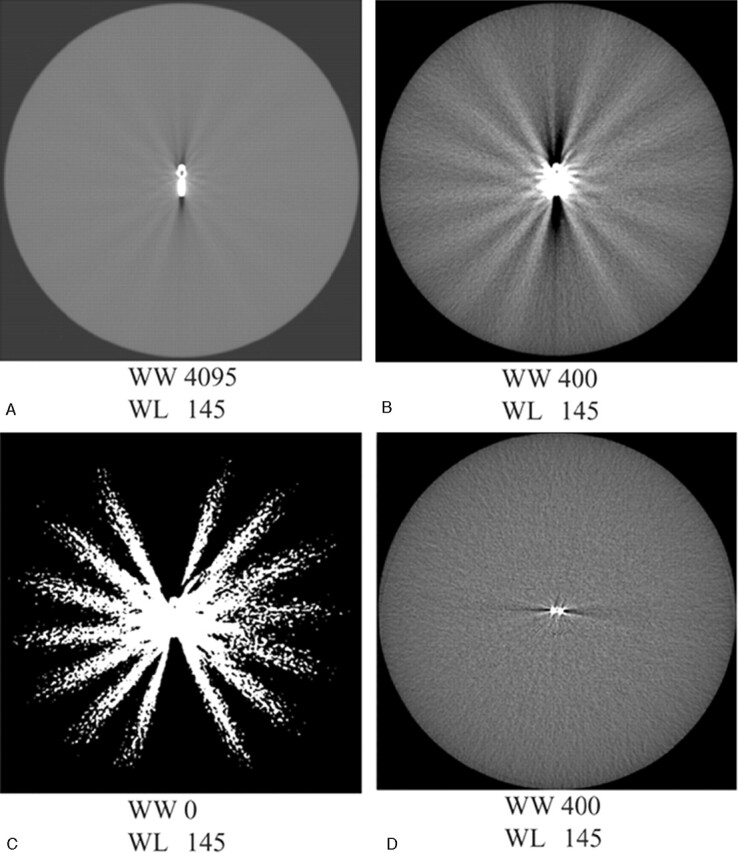
Metal artifact of Cobalt clips scanned at pitch 1 positioned in the scanplance (A–C) and perpendicular to the scan plane (D). The metal artifact consists of a black-and-white component. The aspect of the artifact changes with decreasing window width: widest width (A); window width as used in clinical practice (B); and binary picture (C). The artifact volume largely depends on the position of the clip to the scan plane, with much less artifact for a clip perpendicular to the scan plane (D) compared to a clip in the scan plane (B).
Phantom
The amount of artifact was measured by means of 3D volumetry. When quantifying the clip-induced local image degradation, both positive (white) and negative (black) components need to be taken into account. The threshold values above and below the white and black components of the artifact were taken into account and were calculated by adding or subtracting 3 times the SD of the background to the attenuation value of the background. In addition, we quantified the radiating streak component of the artifact by counting the number of white streaks arising from the clip for both clips at 120 kVp in high and standard modes.
Patients
The amount of artifact in clipped patients was quantified by measuring the area of the white and black components at the level where the artifact was most pronounced, in the same scan position for both kVp values. Once again, the threshold values above which the white and below which the black components of the artifact were taken into account were calculated by adding or subtracting 3 times the SD of the background to the attenuation value of the background (Fig 3).
Fig 3.

Artifact quantification in patients: quantification of the black-and-white component of the artifact in patients in CTA source images.
A, Clip artifact in clinical window setting, with background of 32 HU and an SD of 21.
B, Area of the black component of the artifact enclosing all pixels with HU < 31 (±3 SD).
C, Area of the white component of the artifact enclosing all pixels with HU > 95 (±3 SD).
Clinical Evaluations
To study the influence of the orientation of the clip on the amount of artifact, the angle of the clip relative to the scan plane was measured on the sagittal scout view in 50 patients (by I.v.d.S.) and divided into 3 categories: (1) 0°–25°: in-plane to the scan plane; (2) 26°–65°: diagonal to the scan plane); and (3) 66°–90°: perpendicular to the scan plane). In addition, 2 of 3 readers (B.V., G.d.K., T.W.), blinded to the measurements of clip orientation, scored the grade of visualization of the vessel adjacent to the clip site in the following categories: (1) well-visualized: the vessel in the proximity of the clip can be followed along its whole length; (2) partly visualized: the visualization of the vessels in the proximity of the clip site is somewhat hampered by clip artifact, but no streaks >3 mm obscure the vessel; and (3) poorly visualized: the visualization at the clip site is obscured by the artifact. The visualization of the vessel adjacent to the clip site of the 7 patients in whom a second follow-up scan with 140 kVp/370 mg I/mL was performed was categorized in the same manner.
Data Analysis
Phantom
To compare the amount of artifact at different kVp/mAs combinations, for linear interpolation versus conebeam reconstruction, for cobalt-containing alloy versus Titanium clips, and for the clips positioned in the scan plane compared with perpendicular to the scan plane, the mean volume of artifact for all pitches of each series was calculated and the ratio between mean artifact volumes assessed. The numbers of white radiating streaks, for both clips at 120 kVp, in the standard and high-mode series, were counted for each pitch value.
Patients
For the 50 patients in whom the angle of the clip to the scan plane was measured, we calculated for each category of clip orientation the proportion of patients with well-, partly, or poorly visualized vessels adjacent to the clip site and performed a χ2 test to study the relation between the orientation of the clip on the one hand and visualization at the clip site on the other. For the 10 patients in whom the clip site was also scanned at different kVp/mAs combinations, we calculated the percentage of increase or decrease in area of artifact at 90 and 140 kVp, with 120 kVp as the reference for comparison. In the 7 patients in whom a second follow-up scan was performed at 140 kVp, we compared the visualization at the clip site of the 120-kVp scan with the 140-kVp scan and calculated proportions of patients with well, partly, or poorly visualized vessels adjacent to the clip site for both the 120-kVp/300-mg I/mL and 140-kVp/370-mg I/mL scans.
Results
Phantom
Figure 4 shows the effect of increasing pitch for both clips and kVp/mAs combinations in high and standard modes. The minimum volume of artifact and clip at pitch 0.3 of approximately 1000 mm3 constitutes of the volume of the clip itself, a white halo surrounding the clip and a black bandlike artifact (Fig 5). An increase in pitch led to an increase in total artifact volume, for both clips and for all kVp/mAs combinations in both high and standard modes. Up to a pitch of 0.6, there was hardly an increase in artifact volume for all kVp/mAs combinations and both clips. From pitch 0.6 to pitch 1.5, there was a gradual increase in artifact volume, which was more prominent for lower kVp and for the alloy clips containing cobalt and hardly present for the titanium clip scanned at 140 kVp. Both clips produced more artifacts for all pitches and all kVp/mAs combinations when scanned in standard mode. The influence of different kVp/mAs combinations, reconstruction algorithm, clip composition, and clip orientation to the scan plane are shown in Table 1. At all pitches, scanning with higher kVp resulted in fewer artifacts for both clips. When the conebeam reconstruction algorithm (CBR) was used, the amount of artifact was slightly higher than with linear interpolation for both clips. For all kVp/mAs combinations, in high and standard mode, the cobalt-containing alloy clip produced more artifact than the titanium clip. The clip positioned perpendicular to the scan plane led to significantly less artifact compared with the clip positioned in the scan plane. The number of white radiating streaks increased with increase in pitch, starting at pitch of 0.4, though not in a linear fashion (Figs 5 and 6).
Fig 4.

Artifact volume of the Cobalt containing alloly and titanium clip at increasing pitch. Volume of clip artifact at increasing pitch for cobalt-containing alloy (upper, black lines) and titanium (lower, white lines) clip. Both clips were scanned in the high mode (superscript H, open symbols) up to pitch 1, and standard mode (superscript S, closed symbols) up to pitch 1.5 at 90 (triangles), 120 (squares), and 140 (circles) kVp.
Fig 5.

Number of white streaks for the cobalt-containing alloy (upper, black lines) and titanium clips (lower, white lines) scanned in high mode (H) (open symbols, up to P 1) and standard mode (S) (closed symbols, up to P 1.5).
Table 1:
Influence of kVp, CBR, slip composition, and orientation on artifact volume
| Ratio | |
|---|---|
| KVp* | |
| 90 vs 120, High mode | 1.3 |
| 120 vs 140, High mode | 1.2 |
| 90 vs 120, Standard mode | 1.4 |
| 120 vs 140, Standard mode | 1.2 |
| Conebeam reconstruction vs linear interpolation* | 1.1 |
| Cobalt-containing alloy vs Titanium clip# | |
| High mode | 1.3 |
| Standard mode | 1.5 |
| In plane vs perpendicular‡ | 1.4 |
Note:—CBR indicates conebeam reconstruction.
for titanium- and cobalt-containing alloy clip.
for all kVp/mAs combinations.
for both clips in high and standard mode.
Fig 6.

Aspect of a cobalt clip artifact, positioned in the scanplane, at increasing pitch. The numbers of white streaks increase with increasing pitch.
Artifact volume was higher in the standard mode than in the high mode over the whole range of pitches. This difference can be explained by the method of artifact quantification, which is based on the SD (noise) in the image. In the high mode, scan parameters are optimized for spatial resolution, whereas in the standard mode contrast and spatial resolution are more balanced, which results in a higher noise in the high mode than in the standard mode. Consequently, ±3 times the SD yields a narrower range of HU values in the standard mode, with a corresponding wider range of HU values incorporated into the artifact volume. When the artifact volume is evaluated subjectively by viewing the scans in high and standard mode side by side, this difference in amount of artifact was not of clinical importance, which confirms that the difference in volume can be explained by the method of quantification. The more prominent increase in artifact at 90 kVp from pitch 0.6 up to pitch 1.5 can be explained in the same manner (ie, above pitch 0.6 the maximal mAs decreased and scanning was performed with a lower CTDIvol, resulting in more noise). The differences in artifact volume caused by the scan and clip parameters studied could not be explained by the difference in background noise.
Patients
The visibility of the vessels around the clip was scored better for patients with the clip positioned perpendicular to the scan plane, though this difference was not statistically significant (P = .07; Table 2). In the in-plane category, 6.3% of the clip sites were well-visualized, 52% were partly visualized, and 42% were poorly visualized. In the perpendicular category, 25% of clip sites were well-visualized, 67% were partly visualized, and 8.3% were poorly visualized. Overall, taking into account clips in all positions, the clip sites were well-visualized in 12%, partly visualized in 58%, and poorly visualized in 30%.
Table 2:
Clip orientation and diagnostic quality at the clip site
| Position of Clip to Scan Plane | Completely Diagnostic | Clinically Useful | Not Diagnostic |
|---|---|---|---|
| In plane | 3 (6.3%) | 25 (52%) | 20 (42%) |
| (24 clips, 48 evaluations*) | |||
| Diagonal | 6 (15%) | 25 (63%) | 9 (23%) |
| (20 clips, 40 evaluations) | |||
| Perpendicular | 3 (25%) | 8 (67%) | 1 (8.3%) |
| (6 clips, 12 evaluations) | |||
| Total (all positions) | 12 (12%) | 58 (58%) | 30 (30%) |
| (50 clips, 100 evaluations) |
A double reading per clip site results in twice as many evaluations as clip sites.
Compared with 120 kVp, scanning with 90 kVp led to an increase of 30%, and scanning with 140 kVp led to a decrease of 20% of artifact area.
Seven patients were scanned twice with the standard protocol (120 kVp/300 mg I/mL) and a second follow-up scan performed with 140 kVp with 370 mg I/mL. The clip site was well-visualized in one patient (14%) when scanned with 120 kVp versus 5 patients (71%) when scanned at 140 kVp. The clip site was partly visualized in 4 patients (57%) scanned at 120 kVp versus one patient (14%) scanned at 140 kVp. The clip site was poorly visualized in 2 patients (29%) scanned at 120 kVp compared with one patient (14%) scanned at 140 kVp.
The percentages of the degree of visualization at the clip site in these 7 patients scanned at 120 kVp/300 I/mL reflect the overall proportions of degree of visualization in the 50 patients in whom we measured the clip position who were scanned with the same protocol.
Discussion
The main problem in visualizing intracranial blood vessels in patients with clipped aneurysms is the clip-induced artifact, which frequently hampers the evaluation of the aneurysm neck and surrounding vascular structures. To understand and subsequently minimize the clip-induced artifact in this group of patients, we investigated the influence of pitch, kVp, reconstruction algorithm, clip composition, and orientation of the clip relative to the scan plane on the artifact volume.
The titanium clip produces less artifact than the cobalt-containing alloy clip, which is in accordance with the literature.13,19,20 Although titanium clips were already introduced in 1995, many patients are still treated with cobalt-containing alloy clips, because of familiarity with these clips and corresponding application material. Information about the artifact behavior of cobalt-containing alloy clips and optimization of the scan protocol for patients with cobalt-containing alloy clips is therefore still of clinical importance. Artifacts produced by endovascular coils are so severe that this precludes CTA screening and MRA is more suitable.21
Increasing the pitch led to a gradual increase in artifact volume, which was more prominent for a pitch >0.6, for lower kVp, and for cobalt clips. The increase in the number of white streaks started at pitch 0.4. The reduced amount of artifact can be explained by the fact that the projections (raw data) used for reconstruction of the final CT images lie closer together at low pitches compared with higher ones. This increased oversampling of data decreases the data inconsistency and hence decreases the artifact volume in the reconstructed images. The effect of reduced artifact at lower pitch should therefore hold independent of the number of detector rows in multi CT scanners. A drawback of scanning with a relatively low pitch is venous enhancement due to longer scan time. Scanning patients with clips is a trade-off between increasing clip artifact with higher pitch and increasing venous enhancement at lower pitch because of longer scan duration. We consequently opted for scanning with a pitch of 0.6 as a compromise between clip artifact and venous enhancement. With a pitch of 0.6 and a rotation time of 0.75 seconds, the scan time to cover the whole brain is <15 seconds for the 16-s scanner used in this study. The venous enhancement might increase with a 4-s CT scanner because of slightly longer scan duration and should decrease with a 64-s CT scanner systems because of slightly shorter scan duration. Recently, a rotation time of 0.42 seconds has become available, with a resulting scan time <8.5 seconds for the 16-s scanner, which could give better results with less hindrance from venous enhancement but also requires further study for the effect on clip artifact.
Scanning with high kVp results in less artifact compared with scanning with low kVp; however, the attenuation of iodine-containing contrast, and thus arterial enhancement, also decreases at higher kVp.17,18 This drawback can be compensated for by increasing the iodine concentration to 350, 370, or 400 mg I/mL. Scanning patients with 140 kVp and 370 mg I/mL led to a better visualization of the vessels adjacent to the clip site. Only in one of the 7 patients scanned with an optimized protocol (pitch of 0.6, 140 kVp, and 370 mg I/mL) the visualization at the clip site was still poor, because of 3 clips, all positioned in different directions.
When using the CBR, the artifact volume increases slightly compared with linear interpolation. At present, the CBR is not useful for reducing metal artifact.
The position of the clip relative to the scan plane greatly influences the amount of artifact, with clips perpendicular to the scan plane resulting in less artifact compared with clips positioned in the scan plane. A head tilt technique has been described such that the axial plane through the aneurysm clip projects away from the remainder of the circle of Willis.22 Another way to reduce the artifact would be to position the head of the patients and tilt the gantry at such an angle that the clip is more perpendicular to the scan plane. This repositioning, however, will change the orientation of the axial plane with which the radiologist is accustomed. In addition, patients are frequently treated with more than one clip, each with a different orientation to the scan plane, which precludes such optimization.
We measured the angle on the scout view, which gives a 2D impression of the clip position in the sagittal view, while the position of the clip is in fact 3D. We chose to measure the angle on the sagittal scout view for pragmatic reasons, because in clinical practice usually only the sagittal scout view is available to adjust the scan by tilting the scan or head to get the long axis of the clip out of the scan plane. Despite this shortcoming in methods of measurement, we found a relationship between the angle as measured only in the sagittal view and the amount of artifact. A stronger relationship can be expected if the position of the clip is measured in more directions.
In the phantom study, the minimum artifact was 1000 mm3. Although this is a large volume by the standards of intracranial pathology, a large part of this artifact volume is not centered around the clip but extends more peripherally in white and black streaks (Figs 2 and 5).
Viewing the clip site between the streak artifacts is, in our experience, easiest by using thin-slab interactive multiplanar reformations with a wide window setting. Additional volume rendering can help, but maximum intensity projections (MIP) only enhance the artifact and should therefore not be used in the evaluation of the clip site.
Metal-artifact-reduction (MAR) algorithms have been described as reducing the metal artifact.23 In our recent experience with a prototype MAR, the value of MAR was noticeable, but modest, in better visibility of the surrounding vessels. Methods eliminating bone pixels from CTA source images (matched mask bone elimination24) also remove other high-attenuating structures, such as aneurysm clips from the CTA images. In our experience, although the clip and white streaks of the artifact are eliminated, the loss of information due to the artifact leads to discontinuous vessel segments in the proximity of the clip and consequently does not improve diagnostic quality at the clip site.
This study carries limitations concerning the quantification of the artifact. The clip-induced artifact is a complex phenomenon caused by various physical processes, of which beam hardening, partial volume effect, and aliasing are likely to contribute. We have not, however, tried to differentiate and quantify the role of the individual physical processes involved. Instead, we have chosen a pragmatic approach, geared to minimize clip artifact occurrence in daily practice. The means used to quantify the artifact in the phantom and in patients were comparable, but different. Because the clip-induced artifact in patients was frequently adjacent to bone and enhancing vessels, simple 3D threshholding, as was used in the phantom, would include these high-attenuation structures. Instead, we used a 2D surface quantification at the level of maximum artifact, with subsequent manual editing of adjacent high-attenuation anatomic structures. The agreement between the results obtained in the phantom and in patients support the chosen strategy.
Conclusion
If clip artifacts are to be minimized, we suggest scanning with a pitch of 0.6 and using 140 kVp and 370-I/mL contrast. This is applicable for clip artifact on different multisection systems. Visualization of vessels bearing multiple clips and cobalt-containing alloy clips remains problematic.
References
- 1.van Gijn J, Rinkel GJ. Subarachnoid haemorrhage: diagnosis, causes and management. Brain 2001;124:249–78 [DOI] [PubMed] [Google Scholar]
- 2.Thornton J, Debrun GM, Aletich VA, et al. What percentage of surgically clipped intracranial aneurysms have residual necks? Neurosurgery 2000;46:1294–98 [DOI] [PubMed] [Google Scholar]
- 3.Lin T, Fox AJ, Drake CG. Regrowth of aneurysm sacs from residual neck following aneurysm clipping. J Neurosurg 1989;70:556–60 [DOI] [PubMed] [Google Scholar]
- 4.Tsutsumi K, Ueki K, Usui M, et al. Risk of subarachnoid hemorrhage after surgical treatment of unruptured cerebral aneurysms. Stroke 1999;30:1181–84 [DOI] [PubMed] [Google Scholar]
- 5.Tsutsumi K, Ueki K, Morita A, et al. Risk of aneurysm recurrence in patients with clipped cerebral aneurysms: results of long-term follow-up angiography. Stroke 2001;32:1191–94 [DOI] [PubMed] [Google Scholar]
- 6.Juvela S. Risk of subarachnoid hemorrhage from a de novo aneurysm. Stroke 2001;32:1933–34 [DOI] [PubMed] [Google Scholar]
- 7.Cloft HJ, Joseph GJ, Dion JE. Risk of cerebral angiography in patients with subarachnoid hemorrhage, cerebral aneurysm, and arteriovenous malformation: a meta-analysis. Stroke 1999;30:317–20 [DOI] [PubMed] [Google Scholar]
- 8.Gonner F, Lovblad KO, Heid O, et al. Magnetic resonance angiography with ultrashort echo times reduces the artifact of aneurysm clips. Neuroradiology 2002;44:755–58 [DOI] [PubMed] [Google Scholar]
- 9.Otawara Y, Ogasawara K, Ogawa A, et al. Evaluation of vasospasm after subarachnoid hemorrhage by use of multislice computed tomographic angiography. Neurosurgery 2002;51:939–42 [DOI] [PubMed] [Google Scholar]
- 10.Klingebiel R, Busch M, Bohner G, et al. Multi-slice CT angiography in the evaluation of patients with acute cerebrovascular disease- a promising new diagnostic tool. J Neurol. 2002;249:43–49 [DOI] [PubMed] [Google Scholar]
- 11.Wintermark M, Uske A, Chalaron M, et al. Multislice computerized tomography angiography in the evaluation of intracranial aneurysms: a comparison with intraarterial digital subtraction angiography. J Neurosurg 2003;98:828–36 [DOI] [PubMed] [Google Scholar]
- 12.Kato Y, Nair S, Sano H, et al. Multi-slice 3D-CTA: an improvement over single slice helical CTA for cerebral aneurysms. Acta Neurochir (Wien) 2002;144:715–22 [DOI] [PubMed] [Google Scholar]
- 13.van Loon JJ, Yousry TA, Fink U, et al. Postoperative spiral computed tomography and magnetic resonance angiography after aneurysm clipping with titanium clips. Neurosurgery 1997;41:851–56 [DOI] [PubMed] [Google Scholar]
- 14.Young N, Dorsch NWC, Kingston RJ, et al. Intracranial aneurysms: evaluation in 200 patients with spiral CT angiography. European Radiology 2001;11:123–30 [DOI] [PubMed] [Google Scholar]
- 15.Lawton MT, Heiserman JE, Prendergast VC, et al. Titanium aneurysm clips: Part III. Clinical application in 16 patients with subarachnoid hemorrhage. Neurosurgery 1996;38:1170–75 [DOI] [PubMed] [Google Scholar]
- 16.Prokop M. Image analysis. In: Prokop M, Galanski M, eds. Computed tomography of the body. 1st ed. Stuttgart, Germany: Georg Thieme Verlag;2003. :221
- 17.Zwicker C, Langer M, Langer R, et al. Comparison of iodinated and noniodinated contrast media in computed tomography. Invest Radiol 1991;26(suppl 1):S162–64 [DOI] [PubMed] [Google Scholar]
- 18.Wintermark M, Maeder P, Verdun FR, et al. Using 80 kVp versus 120 KVp in perfusion CT measurement of regional cerebral blood flow. AJNR Am J Neuroradiol 2000;21:1881–84 [PMC free article] [PubMed] [Google Scholar]
- 19.Steiger HJ, van Loon JJ. Virtues and drawbacks of titanium alloy aneurysm clips. Acta Neurochir Suppl (Wien) 1999;72:81–88 [DOI] [PubMed] [Google Scholar]
- 20.Kato Y, Sano H, Katada K, et al. Effects of new titanium cerebral aneurysm clips on MRI and CT images. Minim Invasive Neurosurg 1996;39:82–85 [DOI] [PubMed] [Google Scholar]
- 21.Masaryk AM, Frayne R, Unal O, et al. Utility of CT angiography and MR angiography for the follow-up of experimental aneurysms treated with stents or Guglielmi detachable coils. AJNR Am J Neuroradiol 2000;21:1523–31 [PMC free article] [PubMed] [Google Scholar]
- 22.Brown JH, Lustrin ES, Lev MH, et al. Reduction of aneurysm clip artifacts on CT angiograms: a technical note. AJNR Am J Neuroradiol 1999;20:694–96 [PMC free article] [PubMed] [Google Scholar]
- 23.Vannier MW, Hildebolt CF, Conover G, et al. Three-dimensional dental imaging by spiral CT: a progress report. Oral Surg Oral Med Oral Pathol Oral Radiol Endod 1997;84:561–70 [DOI] [PubMed] [Google Scholar]
- 24.Venema HW, Hulsmans FJ, den Heeten GJ. CT angiography of the circle of Willis and intracranial internal carotid arteries: maximum intensity projection with matched mask bone elimination-feasibility study. Radiology 2001;218:893–98 [DOI] [PubMed] [Google Scholar]