Abstract
Summary: We report the findings from whole-brain proton MR spectroscopy, quantifying the neuronal marker N-acetylaspartate (NAA), for 2 presurgical meningioma patients and 10 healthy controls. The patients’ whole-brain NAA (WBNAA) concentrations were considerably elevated (3+ SDs) compared with healthy controls when excluding the tumors from brain volume; WBNAA levels normalized following correction to approximate “preneoplastic” brain size. These results suggest global neuronal preservation in these 2 patients while their brains were compressed by large, slowly growing, extra-axial masses.
The age-adjusted annual incidence of meningiomas in the United States is 3.86 per 100,000, or >20% of primary intracranial tumors (1). These focal extra-axial neoplasms, thought to be derived from arachnoid cap cells, usually grow slowly and become symptomatic by compressing the brain and/or cranial nerves or irritating the subjacent cortex (2–4). Indeed, the phenomenon of “white matter buckling” on MR imaging and CT provides the radiologic evidence of that compression (5, 6). Following resection, the clinical signs of compression often disappear and the prognosis is usually good. Our aim was to quantify the effects, if any, of 2 large, focal extra-axial neoplasms on global neuronal health and density with whole-brain proton MR spectroscopy (1H-MR spectroscopy). Such evaluation may help a consulting neurosurgeon decide between monitoring with periodic imaging and immediate surgery and, if so, how likely the symptoms are to reverse.
Technique
The global effects of meningiomas on the brain can be assessed by using 1H-MR spectroscopy, which probes N-acetylaspartate (NAA). The second-most-abundant amino acid in the central nervous system, NAA yields the largest singlet peak in the brain’s 1H-MR spectrum (7–9). Because it is almost exclusive to neuronal cells, it is considered their marker, and the whole-brain NAA concentration (WBNAA) quantifies, noninvasively, their health and density (10).
Human Subjects
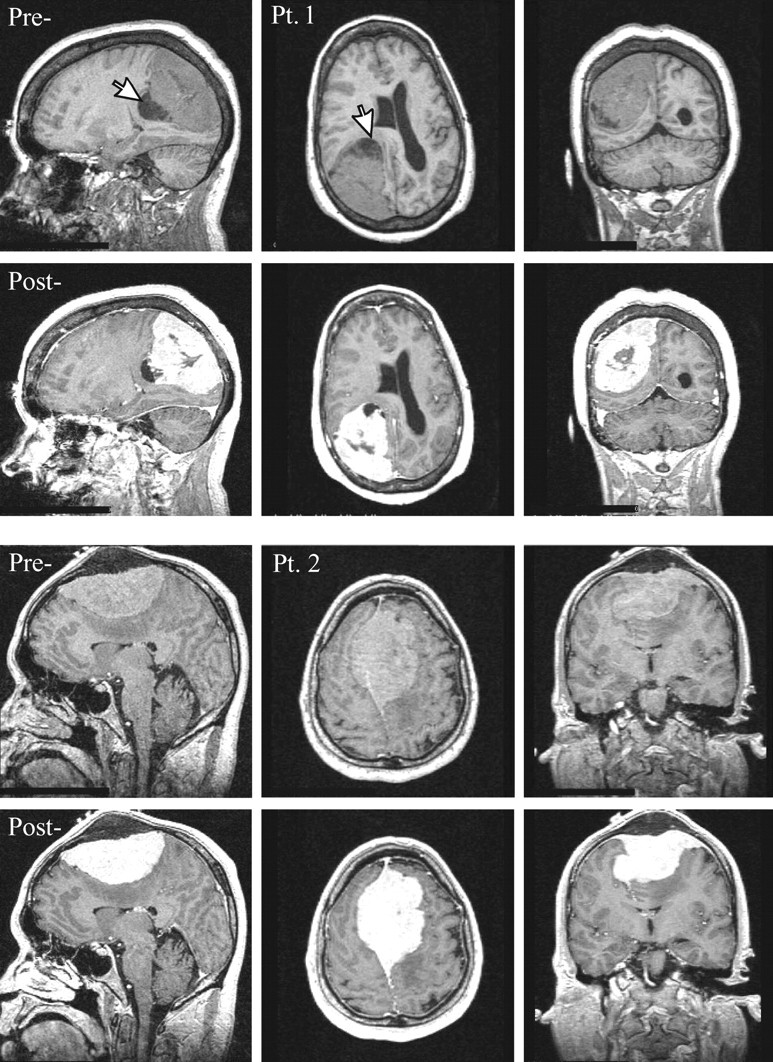
A 45-year-old man and a 58-year-old woman, each with a radiologically suspected supratentorial meningioma (Fig 1), underwent MR imaging as part of their surgical planning. WBNAA 1H-MR spectroscopy and 3D magnetization-preparation rapid gradient echo (MP-RAGE; to measure brain volume) were added to their clinically indicated protocol, for an additional ∼18 minutes scan time. These 2 sequences were also run on 10 (5 female) healthy, 40–60 years of age, controls. All subjects gave institutional review board–approved written informed consent.
Fig 1.

Top, Sagittal, axial and coronal T1-weighted images pre- and postcontrast for patient 1. Note the large (6 × 5 × 5 cm3) extra-axial lesion in the right parietal region, surrounding small cysts (largest ∼1.5-cm diameter, arrow) and marked mass effect on the right lateral ventricle, midline shift, and sulcal effacement.
Bottom, Same for Patient 2. Note the large (9 × 6 × 4 cm3) lesion with its broad dural tail superiorly in the midline extending bilaterally through the falx and into the calvaria, homogenous enhancement, and mass effect reflected in displacement of both lateral ventricles and corpus callosum with moderate left-to-right midline shift.
MR Imaging: Brain Volumetry
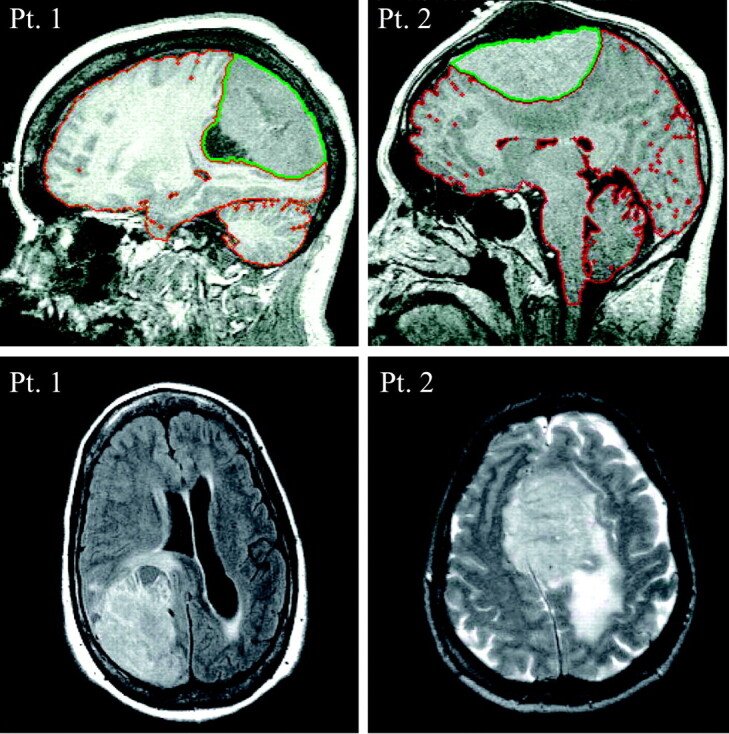
Each subject’s brain volume, VB, was obtained from T1-weighted sagittal MP-RAGE (TE/TR/TI, 7.0/14.7/300 ms; 128 sections; 1.5 mm thick; 256 × 256 matrix; 210 × 210 mm2 field of view) by using the MIDAS package (11). Specifically, a “seed” was placed in the periventricular white matter, followed by selection of all voxels at or above gray matter intensity and construction of a brain mask in 3 steps: (1) morphologic erosion; (2) recursive region growth retaining voxels connected to the “seed” region; and (3) morphologic inflation to reverse the effect of erosion. The masks were truncated at the foramen magnum to incorporate the brain stem and cerebellum but not the cord. The meningioma was manually excluded by tracing its well-defined margin (Fig 2) and then included by using the outer dural contour to approximate “preneoplastic” brain shape. Finally, VB was computed as the product of voxel volume and number of voxels in each mask. Because meningiomas can grow at the expense of either parenchyma or CSF, our approximate preneoplastic brain volume is probably a slight overestimation.
Fig 2.

Top, Sagittal T1 for patients 1 and 2. The red sulcal and ventricular outline is tissue/CSF segmentation. The extra-axial mass (outlined in green) is excluded from initial brain volume but then included to approximate preneoplastic VB.
Bottom, Axial fluid-attenuated inversion recovery and T2-weighted image for patients 1 and 2, respectively. In patient 2, note the considerable T2 hyperintensity, consistent with vasogenic edema, in the underlying parenchyma, particularly in the left centrum semiovale and parietal lobe.
MR Spectroscopy: WBNAA Quantification
The amount of WBNAA, QNAA, was measured in a 1.5T clinical imager. Shimming was followed by nonlocalizing TE/TI/TR (0/940/10,000 ms) 1H-MR spectroscopy (10). Quantification was done against a reference 3-L sphere of 1.5 × 10⁻² mole NAA in water. Subject and reference NAA peaks—SS and SR—were integrated, and QNAA obtained as done elsewhere (12):
 |
1 |
VR180° and VS180° are the transmitter voltages into 50Ω for nonselective 1-ms 180° inversion pulses on the reference and subject, reflecting their relative coil loading. Finally, to account for natural variations in brain size, we computed the specific (ie, volume-independent) concentration,
 |
2 |
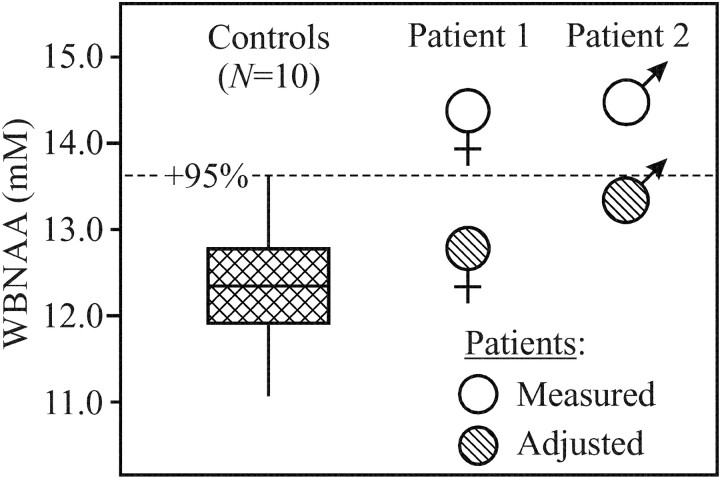
which is suitable for cross-sectional comparison. Its intersubject variability among the 10 controls, 12.6 ± 0.6 mmol/L (mean ± SD), shown in Fig 3, was similar to a previous report (10).
Fig 3.
Plot of first, second (median), and third quartiles (box) and ±95% (whiskers) range of the controls’ WBNAA distribution versus “measured” and “adjusted” levels of the 2 patients. Note that “measured” WBNAA (excluding the meningioma from brain volume) is significantly elevated, which suggests parenchymal compression. Correction of VB to preneoplastic size rendered adjusted WBNAA within the normal range, which indicates neuronal preservation.
Case Reports
Patient 1
A 58-year-old right-handed woman noticed deteriorating vision in her left eye for 3–4 weeks and bumping into objects on her left. Her friends observed her walking “crooked” with her head turned to the left. She was found to have a complete left homonymous hemianopsia and early papilledema. MR imaging revealed a 6.5 × 5.0 × 5.0 cm3 extra-axial lesion in the right parietal region consistent with a meningioma (Figs 1 and 2).
The patient was hospitalized, and treatment with intravenous corticosteroids was initiated in preparation for stereotactic craniotomy and tumor resection. Her QNAA, obtained during preoperative MR imaging for surgical planning, was 14.7 mmol, leading to WBNAA concentration of 14.4 mmol/L excluding the meningioma (VB = 1019 cm3; Fig 2, red outline) or 13.0 mmol/L including it (compare Fig 2, red plus green outlines) to approximate the preneoplastic VB = 1130 cm3 (Fig 3).
Histologic diagnosis was atypical meningioma. Surgical specimens revealed hypercellularity with necrosis and variable number of mitotic figures, as high as 8 per 10 high-power fields, in different regions. Immunostains for glial fibrillary acid protein (GFAP) and synaptophysin showed some focal brain invasion. MIB1 labeling index was variable (as much as 20%), and the tumor was progesterone receptor positive.
The signs and symptoms of compression quickly resolved following surgery. By her first return office visit on postoperative day 13, the patient was neurologically intact with visual fields grossly intact to confrontation. Three months after surgery, formal visual diagnostic testing was normal. The patient continues to be neurologically intact 11 months postoperatively.
Patient 2
A 45-year-old man presented with a bulge on top of his head, headaches, and blurry vision in his right eye that worsened during the course of a few weeks. Papilledema and decreased visual acuity in the right eye were noted. MR imaging revealed a 9 × 6 × 4 cm3 extra-axial lesion consistent with a meningioma superiorly in the midline (Figs 1 and 2).
Following endovascular embolization, stereotactic craniotomy and tumor resection were performed. His QNAA, obtained during presurgical MR imaging, was 22.4 mmol, leading to WBNAA concentration of 14.5 mmol/L, excluding the tumor (VB = 1539 cm3; Fig 2, red outline) and 13.6 mmol/L when estimating the preneoplastic VB = 1642 cm3 (compare Fig 2, red plus green outlines), as shown in Fig 3.
Pathologic examination of surgical specimens confirmed the suspected diagnosis. Dural samples were infiltrated by small nests of tumor cells. Sections of calvaria were permeated, as well with an osteoblastic reaction. Immunostaining for progesterone receptor showed nuclear positivity in more than a third of tumor cells.
The signs and symptoms of raised intracranial pressure gradually resolved following surgery. At his first return office visit 3 weeks postoperatively, the patient reported that his vision had stabilized and denied headaches, nausea, and vomiting. During the following 8 months, the papilledema resolved. At 9 months, the patient was neurologically intact.
Discussion
This case report aimed to confirm that meningiomas, because of their focal, extra-axial nature and in contrast to many other intra-axial brain pathologies, do not result in global neuronal cell damage. This was examined by verifying the answers to 2 testable questions: (1) what are the microscopic and, therefore, MR imaging occult changes to brain parenchyma; and (2) what are the changes to the neuronal cell density and integrity in that tissue?
The considerably (3+ SDs) higher WBNAA in both patients compared with their controls (Fig 3) indicates that the answer to the first question is that in addition to gross distortion, meningiomas also microscopically compress tissue. Furthermore, this microscopic tissue compression far outweighs any tendency for edema (compare Fig 2) to bias WBNAA lower by increasing VB. Although it is apparent from the MR imaging that the lesion also displaces ventricular and sulcal CSF (Figs 1 and 2), the latter volume, however, is excluded from VB for the WBNAA calculation. Therefore, according to equation [2], and because the meningioma itself lacks NAA (13), WBNAA increase can occur only due to brain NAA elevation, tissue compression, or both. Because parenchymal NAA elevation is known only in Canavan disease (14), compression is the likely scenario. Furthermore, the degree of WBNAA elevation, in these 2 patients, was proportional to the ratio of tumor-to-brain volumes.
Note that, although sulcal and ventricular volume losses and gross distortion (mass effects) are easily visible on the MR imaging, tissue compression is essentially completely invisible (compare Fig 1). In addition, biopsy or surgical brain samples from these patients are not clinically warranted and, therefore, rarely available. As a result, the noninvasive WBNAA, which represents that metabolite’s content in >90% of the brain (15), is the only accessible evidence of global microscopic tissue compression, as opposed to gross macroscopic distortion.
The fact that the estimated correction to preneoplastic brain volume scales both patients’ WBNAA levels into the “normal” range (Fig 3) and not below it, as in many other CNS disorders (16–18), indicates the answer to the second question: because the meningiomas themselves contain negligible NAA (13), the number of neuronal cells in these 2 (compressed) brains is similar to their estimated preneoplastic state. In fact, adjusting WBNAA with actual preneoplastic brain volume, which cannot be discerned a posteriori, would result in values no lower than the normal range. This is due to our approximation, a slight overestimation, that meningioma expansion came exclusively at the expense of parenchyma, and not CSF. Therefore, these substantial mass effects had not yet led to the neuronal loss or even the dysfunction frequently reflected by NAA decline (16–18). This observation is not surprising considering the slow growth and extra-axial nature of meningiomas (3, 19), which are, therefore, less likely to cause early, intra-axial damage. Furthermore, brain invasion from meningiomas, when present (as in Patient 1), is focal and would not cause diffuse neuronal injury detectable by WBNAA (19). Consequently, the observed compression must come at the expense of the intercellular water, myelin, glia, or even the neuronal cell dimensions, but not their number. This conclusion is consistent with the observation that meningioma resection frequently reverses clinical symptoms attributable to cerebral compression, such as contralateral hemianopsia as was seen in patient 1.
In summary WBNAA was shown to provide an instrumental and, therefore, objective means of quantifying microscopic brain tissue compression and consequent changes in neuronal/axonal density. The 2 patients studied indicated neuronal preservation despite significant compression. The current standard-of-care tools to gauge compression fall into 2 main categories. First, structural imaging modalities are very sensitive to morphologic deformations, but nonspecific with regard to the microscopic changes in that tissue. Second, clinical history and physical examination are completely opaque to brain anatomy and can only qualitatively infer what or where the (possible) problem(s) might be. Therefore, WBNAA, which adds little extra time to the standard, clinically indicated MR imaging protocol, provides a value-added assessment of global neuronal integrity to the radiologic evaluation of the compressed brain.
Future work is required to delineate how edema and tumor size, location, growth rate, and duration (eg, new vs long-standing) affect WBNAA and cerebral compression This may be advantageous to establish if, for example, (1) any of these characteristics influence whether the lesion preferentially displaces brain parenchyma or CSF, (2) clinical symptoms better correlate with degree of cerebral compression or tumor location, or (3) secondary vascular changes have a measurable effect. WBNAA provides an objective means of answering these questions so that the radiologist can help the clinical team make more informed management decisions, such as the necessity for surgical intervention.
Footnotes
Supported by National Institutes of Health grants EB01015 and CA92547.
Presented in part at the 89th annual meeting of the Radiological Society of North American, November 30–December 5, 2003, Chicago, IL.
References
- 1.Surawicz TS, McCarthy BJ, Kupelian V, et al. Descriptive epidemiology of primary brain and CNS tumors: results from the Central Brain Tumor Registry of the United States, 1990–1994. Neurooncol 1999;1:14–25 [DOI] [PMC free article] [PubMed] [Google Scholar]
- 2.D’Ambrosio AL, Bruce JN. Treatment of meningioma: an update. Curr Neurol Neurosci Rep 2003;3:206–214 [DOI] [PubMed] [Google Scholar]
- 3.Nakamura M, Roser F, Michel J, et al. The natural history of incidental meningiomas. Neurosurgery 2003;53:62–70; discussion 70–71 [DOI] [PubMed] [Google Scholar]
- 4.Quest DO. Meningiomas: an update. Neurosurgery 1978;3:219–225 [DOI] [PubMed] [Google Scholar]
- 5.George AE, Russell EJ, Kricheff II. White matter buckling: CT sign of extraaxial intracranial mass. AJR Am J Roentgenol 1980;135:1031–1036 [DOI] [PubMed] [Google Scholar]
- 6.Curnes JT. MR imaging of peripheral intracranial neoplasms: extraaxial vs intraaxial masses. J Comput Assist Tomogr 1987;11:932–937 [DOI] [PubMed] [Google Scholar]
- 7.Simmons ML, Frondoza CG, Coyle JT. Immunocytochemical localization of N-acetyl-aspartate with monoclonal antibodies. Neuroscience 1991;45:37–45 [DOI] [PubMed] [Google Scholar]
- 8.Tsai G, Coyle JT. N-acetylaspartate in neuropsychiatric disorders. Prog Neurobiol 1995;46:531–540 [DOI] [PubMed] [Google Scholar]
- 9.Frahm J, Bruhn H, Gyngell ML, et al. Localized high-resolution proton NMR spectroscopy using stimulated echoes: initial applications to human brain in vivo. Magn Reson Med 1989;9:79–93 [DOI] [PubMed] [Google Scholar]
- 10.Gonen O, Viswanathan AK, Catalaa I, et al. Total brain N-acetylaspartate concentration in normal, age-grouped females: quantitation with non-echo proton NMR spectroscopy. Magn Reson Med 1998;40:684–689 [DOI] [PubMed] [Google Scholar]
- 11.De Santi S, de Leon MJ, Rusinek H, et al. Hippocampal formation glucose metabolism and volume losses in MCI and AD. Neurobiol Aging 2001;22:529–539 [DOI] [PubMed] [Google Scholar]
- 12.Soher BJ, van Zijl PC, Duyn JH, Barker PB. Quantitative proton MR spectroscopic imaging of the human brain. Magn Reson Med 1996;35:356–363 [DOI] [PubMed] [Google Scholar]
- 13.Howe FA, Barton SJ, Cudlip SA, et al. Metabolic profiles of human brain tumors using quantitative in vivo 1H magnetic resonance spectroscopy. Magn Reson Med 2003;49:223–232 [DOI] [PubMed] [Google Scholar]
- 14.Baslow MH. Canavan’s spongiform leukodystrophy: a clinical anatomy of a genetic metabolic CNS disease. J Mol Neurosci 2000;15:61–69 [DOI] [PubMed] [Google Scholar]
- 15.Gonen O, Grossman RI. The accuracy of whole brain N-acetylaspartate quantification. Magn Reson Imaging 2000;18:1255–1258 [DOI] [PubMed] [Google Scholar]
- 16.Gonen O, Catalaa I, Babb JS, et al. Total brain N-acetylaspartate: a new measure of disease load in MS. Neurology 2000;54:15–19 [DOI] [PubMed] [Google Scholar]
- 17.Patel SH, Inglese M, Glosser G, et al. Whole-brain N-acetylaspartate level and cognitive performance in HIV infection. AJNR Am J Neuroradiol 2003;24:1587–1591 [PMC free article] [PubMed] [Google Scholar]
- 18.Movsas B, Li BS, Babb JS, et al. Quantifying radiation therapy-induced brain injury with whole-brain proton MR spectroscopy: initial observations. Radiology 2001;221:327–331 [DOI] [PubMed] [Google Scholar]
- 19.Mahmood A, Caccamo DV, Tomecek FJ, Malik GM. Atypical and malignant meningiomas: a clinicopathological review. Neurosurgery 1993;33:955–963 [DOI] [PubMed] [Google Scholar]


