

Abstract
Summary: Increased risk of hemorrhagic transformation (HT) limits the general use of thrombolytic therapy in acute ischemic stroke (AIS). This study shows that early blood-brain barrier defects in AIS can be assessed by using permeability MR imaging. Significantly increased permeability was found in 3 patients who later hemorrhaged. This method indicates the potential for identifying patients at higher risk of HT and offers the use of physiologic imaging rather than time from onset of symptoms to guide treatment decisions.
Increased risk of hemorrhagic transformation (HT) limits the general use of tissue plasminogen activators (tPA) for thrombolytic treatment of acute ischemic stroke (AIS) (1). Although some clinical (2, 3) and radiologic findings (4, 5) have retrospectively been associated with subsequent neurologic outcome, it remains difficult to identify patients at greater risk for HT and increased morbidity and mortality before administration of tPA (3, 4, 6–9). Thus, a method that can identify high-risk patients is urgently needed for safer application of tPA.
At present, selection criteria for tPA are clinically based assisted by CT to rule out intracerebral hemorrhage. Beyond fixed time windows (eg, 0–3 hours for IV tPA) tPA administration is contraindicated. However, this method for selecting patients for treatment may not be optimal. In fact, the concept of a fixed therapeutic time window in acute stroke therapy has been questioned by many authors (10), and there is an increasing demand to base therapy on individualized physiologic criteria at the time of clinical presentation rather than epidemiologically based timeframes. In contrast to clinical assessment and time criteria alone, physiologically based MR imaging has the potential to provide additional information for selecting tPA candidates, potentially leading to improved outcomes, reduced complications, and increased proportions of patients eligible for treatment. Development of physiologically based imaging including both diffusion-sensitive (an indicator of cytotoxic edema) and perfusion-sensitive (characterization of hemodynamic abnormalities) MR imaging has improved characterization of ischemic tissue. It is now possible to identify viable tissue at risk (and to operationally define “the ischemic penumbra”), commonly defined by the area of abnormal perfusion extending beyond the core of abnormal diffusion (the so-called perfusion-diffusion mismatch). Reestablishing normal levels of perfusion to the penumbral tissue has become the cornerstone of modern stroke management. A further, emerging MR imaging technique, based on dynamic contrast-enhanced imaging and subsequent kinetic modeling of microvascular permeability, allows quantitation of defects in the blood-brain barrier (BBB). This concept has proved highly efficacious in assessing neoplasms (11) and the purpose of this study is to investigate evidence of BBB leakage in AIS by using such an approach. It is the hypothesis of this work that loss of BBB integrity in AIS may be predictive of subsequent HT.
Methods
Ten patients (4 women, 6 men, aged 38–80 years) with AIS not treated with tPA were examined within 24 hours of documented onset of symptoms. All studies were performed in accordance with the institutional guidelines for human research; written informed consent was obtained. MR imaging consisted of using a comprehensive acute stroke MR imaging protocol including anatomical, diffusion- and perfusion-weighted MR imaging, as well as contrast-enhanced MRA. In addition, a dynamic contrast-enhanced (DCE) 3D-gradient-recalled echo (GRE) examination was performed to assess permeability/BBB integrity. All subjects were imaged on a 1.5T clinical MR imaging system (GE Healthcare, Milwaukee, WI) equipped with echo-speed gradients and a standard neurovascular head coil. Imaging parameters for the 3D-GRE acquisition were as follows: FOV 240 mm, 128 × 128 × 8 matrix, FA = 20°, section thickness 7 mm, TR = 5.9 ms, TE = 1.5 ms. The total acquisition time was 4:48 minutes for a collection of 31 volumes at a temporal resolution of ∼5 seconds. Contrast media (Omniscan, GE Healthcare; total volume of 15 mL Gd-DTPA) was injected as a bolus 30 seconds following the start of the 3D acquisition. Data were transferred to an independent workstation for quantitative analysis. Parametric maps of permeability (KPS) were calculated as described previously by Roberts et al (11) by using a unidirectional 2-compartment kinetic model and by obtaining a reference vascular contrast agent time course from a region of interest (ROI) placed in the sagittal sinus. Diffusion-weighted images (DWIs) were converted to apparent diffusion coefficient (ADC) maps by using Functool 2000 (GE Healthcare). Areas of ischemia were identified as regions of reduced diffusion relative to normal cortex on ADC maps. If the KPS map revealed an area of significant elevation (compared with a background of zero permeability, subject only to image noise and curve fitting uncertainty), a region of interest was placed in that area. If the KPS map showed no visible abnormality, a region of interest was placed within the ADC abnormality. A control region of interest was placed on the homologous location in the contralateral cerebral hemisphere.
To identify HT, follow-up imaging with noncontrast CT and magnetic susceptibility sensitive 3D-GRE-MR imaging was performed within 24–72 hours after initial imaging, according to patient symptoms. 3D-GRE-MR imaging has been reported to be more sensitive than CT for the detection of hemorrhage (12). Patients were then divided into 2 groups—those who proceeded to hemorrhage and those who did not. Within each group, KPS values in the lesion and contralateral hemisphere were tested for significant difference by using a Student paired t test. Differences between groups were tested by using a Student (unpaired) t test.
Results
Three patients proceeded to HT. Both images acquired at presentation (DWI, KPS map, T1-weighted post-Gd spin-echo [SE]) and follow-up (CT, 3D-GRE-MR imaging) are shown for all three cases in Fig 1. As can be seen, the appearance of hemorrhage on CT varies from subtle to frank, and is (in these 3 cases at least) somewhat more conspicuous on 3D-GRE-MR imaging. A typical set of images/maps obtained in a patient who did not progress to HT is shown in Fig 2.
Fig 1.
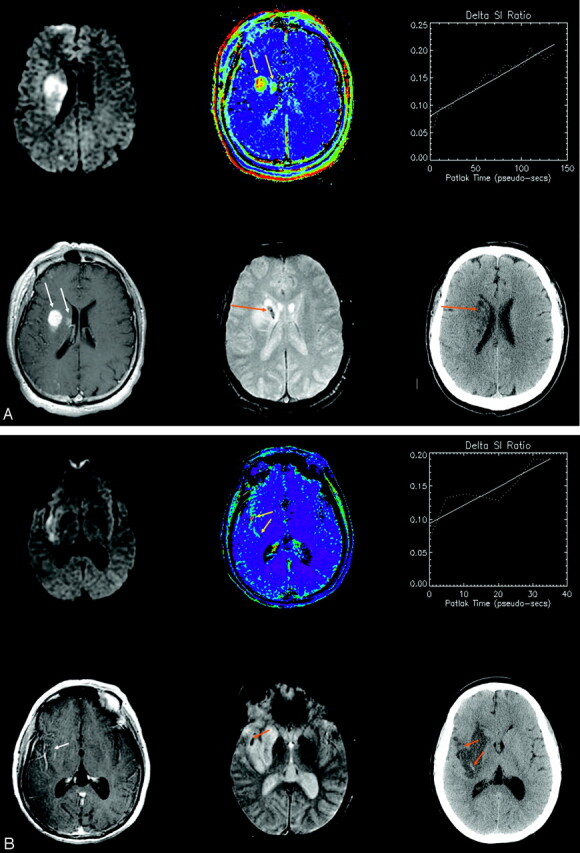

(A–C): Three patients experienced HT. Images from all 3 are shown from the initial MR imaging at presentation (upper left: DWI; upper middle: permeability map; upper right: dynamic enhancement time course; lower left: post-Gd T1 SE) and from follow-up scans after 24–72 hours (lower middle: 3D-GRE-MR imaging; lower right: CT). Progressive signal intensity increase on serial T1-weighted images demonstrates a clear positive increasing slope (upper right), and a corresponding hyperintensity on a pixel-by-pixel map of microvascular permeability (yellow arrows). In only 1 case (A) is enhancement clearly visible on the T1-weighted SE (white arrows). Follow-up CT shows hyperintensity characteristic of HT in the same area (orange arrows), but this appearance varies from subtle to frank; hemorrhage is additionally depicted on gradient recalled echo MR imaging (orange arrows). In Fig 1B, follow-up CT was performed 1 day after the follow-up MR imaging. The top arrow shows subtle evidence of hemorrhage corresponding to 3D-GRE-MR imaging; the bottom arrow shows new hemorrhage that must have developed after the follow-up MR imaging and that corresponds to the permeability abnormality on the initial MR imaging.
Fig 2.

A representative patient presenting with AIS (<24 hours), visible as hyperintensity on DWI (upper left). Lack of progressive signal intensity increase on serial T1-weighted images WIs is shown as a negligible slope of enhancement (upper right), and no corresponding hyperintensity on a pixel-by-pixel map of microvascular permeability (lower left). In this case, the permeability value in the hyperintense region was −0.14 mL/100 g/min. Follow-up CT (48 hours later) showed no evidence of HT (lower right).
Three of the 10 cases showed progressive signal intensity increase associated with increased permeability in the acute phase. In these cases, wherein regional KPS abnormalities were present, the site of KPS elevation always fell within the larger region of the ADC abnormality. All 3 went on to hemorrhage within 48 hours after symptom onset. KPS in the lesion of these cases was significantly elevated (Fig 3) compared with the contralateral normal hemisphere (3.10 mL/100 g/min ± 0.44 versus 0.01 mL/100 g/min ± 0.10, P < .01). All other patients showed no significant increase in permeability (−0.123 mL/100 g/min ± 0.09 for the lesion versus −0.243 mL/100 g/min ± 0.07 for the contralateral side, P = .2). Comparison of KPS in the lesion between the 2 groups (HT and non-HT) revealed a significant difference (P < .02). ADC was reduced in all cases within the infarct zone, but not significantly different between those who progressed to HT and those who did not (P = .50).
Fig 3.

Mean microvascular permeability values obtained at MR imaging at time of presentation in the lesion and contralateral (normal) hemisphere of patients who subsequently proceeded to HT (left) and those who did not proceed to HT (right). Significantly elevated permeability values are seen only in the lesion of patients who subsequently proceed to HT.
Discussion
The risk of HT in AIS is increased approximately 10-fold with tPA (13) administration. Although thrombolytic therapy represents an important step forward in AIS management, there is a clear need to make this treatment available to a larger number of patients while reducing the risk of hemorrhagic complications. Permeability MR imaging has the potential to provide critical information concerning these treatment decisions through assessing defects in the BBB (14). Our results show that understanding the relationship between BBB defects and HT could be of considerable clinical value. To that end, we think that the dynamic method of permeability assessment is more sensitive to subtle T1 enhancements (providing about 30 sampling times to characterize the enhancement, increasing conspicuity of low “effect-to-noise” ratio) than simple postcontrast SE imaging alone. In 1 of the 3 cases of elevated permeability in this report, clear T1 enhancement was indeed also visible on post-Gd T1-SE images. (Note that these were acquired about 5 minutes post-Gd, after the dynamic run.) However, the origin of such enhancement remains ambiguous because it could relate to (1) elevated fractional blood volume, or (2) contrast extravasation. The dynamic series resolves this ambiguity. Post-Gd T1-SE images that reveal generally weak enhancement from each of the 3 cases are shown in Fig 1.
If a link between BBB defects and hemorrhagic risk can be established, then it may be possible to additionally use permeability, rather than time since onset of symptoms alone, as the key parameter guiding the decision to treat with tPA. This could decrease morbidity and mortality in 2 ways: (1) withholding tPA in patients presenting less than 3 hours from symptom onset with early proved BBB defects; and (2) extension of the treatment window in patients with an intact BBB who present more than 3 hours after symptom onset. Strategies for stabilizing the BBB to prevent tPA from entering the interstitial space might also be aggressively pursued because it is now known that tPA can cause degradation of capillary basement membranes through receptor-mediated mechanisms (15).
Conclusion
This study shows that early BBB defects in AIS can be resolved by using permeability MR imaging. Significantly increased permeability was only found in patients who subsequently developed HT, implying a causal predictive relationship. This method indicates the potential to identify patients at higher risk of HT. If a strong correlation can be established by future work, then permeability could augment time of symptom onset as the clinical guideline for initiating tPA, and could result in potentially decreased morbidity and mortality and improved stroke outcome.
References
- 1.del Zoppo GJ, von Kummer R, Hamann GF. Ischaemic damage of brain microvessels: inherent risks for thrombolytic treatment in stroke. J Neurol Neurosurg Psychiatry 1998;65:1–9 [DOI] [PMC free article] [PubMed] [Google Scholar]
- 2.Lyden PD, Zivin JA. Hemorrhagic transformation after cerebral ischemia: mechanisms and incidence. Cerebrovasc Brain Metab Rev 1993;5:1–16 [PubMed] [Google Scholar]
- 3.The NINDS t-PA Stroke Study Group. Intracerebral hemorrhage after intravenous t-PA therapy for ischemic stroke. Stroke 1997;28:2109–2118 [DOI] [PubMed] [Google Scholar]
- 4.Larrue V, von Kummer R, del Zoppo G, Bluhmki E. Hemorrhagic transformation in acute ischemic stroke: potential contributing factors in the European Cooperative Acute Stroke Study. Stroke 1997;28:957–960 [DOI] [PubMed] [Google Scholar]
- 5.Toni D, Fiorelli M, Bastianello S, et al. Hemorrhagic transformation of brain infarct: predictability in the first 5 hours from stroke onset and influence on clinical outcome. Neurology 1996;46:41–45 [DOI] [PubMed] [Google Scholar]
- 6.Jaillard A, Cornu C, Durieux A, et al, for the MAST-E Group. Hemorrhagic transformation in acute ischemic stroke: the MAST-E study. Stroke 1999;30:1326–1332 [DOI] [PubMed] [Google Scholar]
- 7.The Multicenter Acute Stroke Trial-Europe Study Group. Thrombolytic therapy with streptokinase in acute ischemic stroke. N Engl J Med 1996;335:145–150 [DOI] [PubMed] [Google Scholar]
- 8.Hacke W, Kaste M, Fieschi C, et al, for the ECASS Study Group. Intravenous thrombolysis with recombinant tissue plasminogen activator for acute hemispheric stroke: the European Cooperative Acute Stroke Study (ECASS). JAMA 1995;274:1017–1025 [PubMed] [Google Scholar]
- 9.Hacke W, Kaste M, Fieschi C, et al, for the Second European-Australasian Acute Stroke Study Investigators. Randomised double-blind placebo-controlled trial of thrombolytic therapy with intravenous alteplase in acute ischaemic stroke (ECASS II). Lancet 1998;352:1245–1251 [DOI] [PubMed] [Google Scholar]
- 10.Baron JC, von Kummer R, del Zoppo GJ. Treatment of acute ischemic stroke: challenging the concept of a rigid and universal time window. Stroke 1999;30:180–182 [DOI] [PubMed] [Google Scholar]
- 11.Roberts HC, Roberts TP, Bollen AW, et al. Correlation of microvascular permeability derived from dynamic contrast-enhanced MR imaging with histologic grade and tumor labeling index: a study in human brain tumors. AJNR Am J Neuroradiol 2001;21:891–899 [DOI] [PubMed] [Google Scholar]
- 12.Kidwell CS, Chalea JA, Saver JL, et al. Comparison of MRI and CT for detection of acute intracerebral hemorrhage. JAMA 2004;292(15):1823–1830 [DOI] [PubMed] [Google Scholar]
- 13.The NINDS t-PA Stroke Study Group. Intracerebral hemorrhage after intravenous t-PA therapy for ischemic stroke. Stroke 1997;28:2109–2118 [DOI] [PubMed] [Google Scholar]
- 14.Kassner A, Roberts TPL, Taylor K, Silver F, Mikulis DJ. Detection of blood-brain barrier leakage in early acute stroke using dynamic contrast-enhanced MR imaging. Book of Abstracts, 42nd Annual Meeting of the American Society of Neuroradiology,2004;227
- 15.Yepes M, Sandkvist M, Moore EG, Bugge TH, Strickland DK, Lawrence DA. Tissue-type plasminogen activator induces opening of the blood-brain-barrier via the LDL receptor-related protein. J Clin Invest 2003;112:1533–1540 [DOI] [PMC free article] [PubMed] [Google Scholar]