

Abstract
Tensile testing is an essential experiment to assess the mechanical integrity of musculoskeletal soft tissues, yet standard test methods have not been developed to ensure the quality and reproducibility of these experiments. The ASTM International standards organization has created tensile test standards for common industry materials that specify geometric dimensions of test specimens (coupons) that promote valid failures within the gage section (midsubstance), away from the grips. This study examined whether ASTM test standards for plastics, elastomers, and fiber-reinforced composites are suitable for tensile testing of bovine meniscus along the circumferential fiber direction. We found that dumbbell (DB) shaped coupons based on ASTM standards for elastomers and plastics had an 80% and 60% rate of midsubstance failures, respectively. The rate of midsubstance failures dropped to 20% when using straight (ST) coupons based on ASTM standards for fiber-reinforced composites. The mechanical properties of dumbbell shaped coupons were also significantly greater than straight coupons. Finite element models of the test coupons revealed stress distributions that supported our experimental findings. In addition, we found that a commercial deli-slicer was able to slice meniscus to uniform layer thicknesses that were within ASTM dimensional tolerances. This study provides methods, recommendations, and insights that can advance the standardization of tensile testing in meniscus and other soft fibrous tissues.
Keywords: uniaxial tensile test, ultimate tensile strength, tensile test standards, meniscus, ligament and tendon, specimen dimensions
Introduction
Mechanical testing of any material requires adherence to proper test methods to ensure the validity and reproducibility of the measured material properties. This includes the tensile testing of musculoskeletal soft tissues that transfer tensile forces across joints, such as ligament [1], tendon [2], and meniscus [3]. The standards organization, ASTM International, has developed and published international standards for tensile testing of common industry materials including metals, composites, elastomers, and polymers [4–7]. These test standards specify geometric dimensions and tolerances of the test specimen, called a test coupon, in order to promote localized failures in a region of uniform tensile stress, called the gage section. The gage section is normally designed to have a reduced cross-sectional area and large aspect ratio that give the test coupon a dumbbell (DB) shape, also referred to as a dog-bone shape. Failure outside of this gage section, particularly near the grips, is problematic due to the unknown complex state of stress caused by both grip compression and restricted specimen deformation, as well as potential microtears from the grip jaws that may compromise the mechanical integrity of the tissue.
A limitation in musculoskeletal biomechanics research is that international tensile test standards have not been developed for biological soft tissue. The absence of a test standard has resulted in a wide variety of methods to prepare test coupons for tensile testing. These differences were apparent in an independent survey of twenty studies conducting uniaxial tensile tests to failure on ligament, tendon, annulus fibrosis, and meniscus [3,8–26]. Fifty-five percent of the studies exclusively used straight (ST) test coupons, also referred to as rectangular, while the remainder used DB test coupons. Large differences existed in the gage section between studies, with gage aspect ratios (length:width) varying in most studies between 2:1 and 10:1. The reported incidence of tissue ruptures in the gage section (i.e., midsubstance failures) ranged between 0 and 100% (mean = 52%), with 40% of the surveyed articles not reporting this information. Roughly half the surveyed articles used friction tabs (e.g., sandpaper) at the tissue–grip interface, which is a method that ASTM recommends to reduce the rate of failures at the grip [4]. In addition, ASTM standards provide tolerance limits to specify the allowable dimensional variability within the gage section, yet this intraspecimen variability was only reported in one of the surveyed articles [10]. These gross differences in test methods make it difficult to compare mechanical results across studies.
The objective of this study was to identify test methods that can reduce grip failures and improve the reproducibility of tensile testing in meniscus. To support this objective, we adopted ASTM tensile test standards for elastomers, plastics, and fiber polymer composites [4–6]. To our knowledge, this is the first study to determine the efficacy of different ASTM tensile test standards when applied to soft tissue.
Materials and Methods
Overview.
This study had two parts. The first part determined the effect of different techniques to layer nonplanar soft tissue to a uniform thickness. The second part determined the effect of coupon geometry and gripping technique on midsubstance failures and mechanical properties.
Layering of Meniscus Tissue.
Medial menisci were harvested from four unpaired hind bovine knees (stifle joint, mixed breed, ages 18–30 months) and were frozen for 24 h at −4. Each meniscus was wedged into thirds and the central region was used for this experiment (Fig. 1(a)). Specimens were layered after either covering in saline-soaked gauze (raw group) or embedding in cellulose (embedded group). To embed the meniscus, the meniscus wedge (Fig. 1(b)) was placed rim first in a 2 × 2 × 2 in. plastic container with the bottom lined with the cellulose mixture. The cellulose mixture, consisting of an 8:3 ratio of Celluclay (Activa, Marshall, TX) and de-ionized water, was then pressed into the container to fully surround the tissue and create a cellulose cube (Fig. 1(c)). All wedged specimens were refrozen for over 24 h at −4 .
Fig. 1.
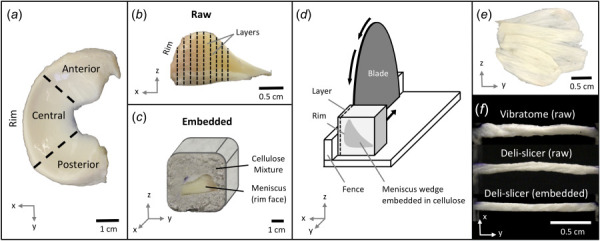
Overview of specimen layering using the deli-slicer. (a) Top view of the medial bovine meniscus separated into three regions. (b) Profile view of the central meniscus wedge showing the multiple layers that were harvested (dashed lines). (c) Embedded specimens were frozen in a cellulose cube and (d) layered with a commercial deli-slicer. (e) Layers were approximately 1 mm thick and (f) were cut into straight strips and imaged to determine intraspecimen thickness variability. Qualitative and quantitative differences were observed between the three different techniques used to layer the meniscus.
Two instruments were tested to layer meniscus to a targeted thickness of 1 mm: a vibratome (Leica Biosystems, Buffalo Grove, IL; VT1000S) and a commercial deli-slicer (Globe, Bridgeport, CT; Model C12). Vibratomes have been a standard instrument for layering tissue to thicknesses less than 1 mm, while deli-slicers are not an established instrument for layering soft tissue. For the vibratome, samples were submerged in 0.9% saline and cut at a travel speed of 0.25 mm/s with a vibrational frequency of 80 Hz and a cutting angle of 15 deg. For the deli-slicer, the rim side of the specimen (raw or embedded) was lightly pressed against the adjustable fence to prevent slipping and the specimen was manually advanced into the blade to slice a layer (Fig. 1(d)) at a speed of approximately 12 mm/s. After each layer was cut (Fig. 1(e)), the blade was lubricated with saline and the cube was rotated 90 deg, keeping the rim side of the cube on the fence face. The blade was regularly inspected and sharpened with the sharpening tool attached to the deli slicer. Straight specimens (width = 2 mm, length = 18 mm) were punched from the layers using a die with two parallel razor blades. Specimens were loaded into grips approximately 13 mm from grip-to-grip, preloaded to 0.1 N, and imaged with a digital camera (Fig. 1(f)). Side profile images were segmented using Otsu's method for edge detection in matlab (graythresh function), and the number of pixels spanning across the narrow specimen was used to calculate the distribution of thickness as a function of length (tissue within 1 mm of grips was excluded from analysis). Pixel values were converted to metric units using a two-dimensional calibration square. The coefficient of variation (i.e., intraspecimen variation) was calculated for each specimen by dividing the standard deviation of the specimen's thickness by the mean specimen thickness.
The intraspecimen variation in thickness was compared for three layering techniques: vibratome using raw specimens, deli-slicer using raw specimens, and deli-slicer using embedded specimens. For this part of the study, ten samples were tested in each group for a total of 30 specimens. The embedded specimens were not tested in the vibratome because the cellulose mixture (Fig. 1(c)) broke down in the vibratome's saline bath.
Coupon Geometry.
Four types of coupon geometries, based on ASTM standards, were tested to assess the mechanical effect of coupon shape (DB versus ST) and gage aspect ratio (HIGH versus LOW) (Figs. 2(a)–2(d)). All coupons had an overall length of 24 mm and a target thickness of 1 mm. Coupon dimensions for DB-HIGH were based on ASTM standards for elastomers [6], coupon dimensions for DB-LOW were based on ASTM standards for plastics [4], and coupon dimensions for ST-HIGH specimens were based on ASTM standards for polymer matrix fiber composites (Fig. 2(e))[5]. The ST-LOW geometry was given a lower aspect ratio by matching the gage length of ST-HIGH and the outer width of DB-LOW (Fig. 2(e)). The punches used to cut the coupon shapes were custom fabricated using razors and 3D printed polylactic acid components (Ultimaker 2; Ultimaker B. V., Geldermalsen, The Netherlands). The DB punches were fitted with flexible razor blades [27], while the ST punches were fitted with rigid razor blades.
Fig. 2.
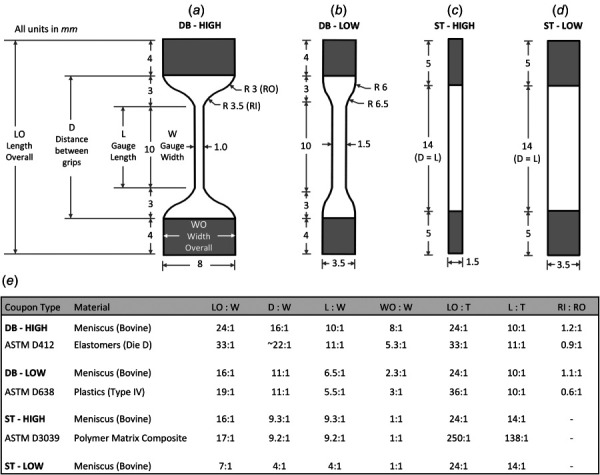
Dimensions of the four coupon geometries used for tensile tests of bovine meniscus. (a) Dumbbell coupon with a high aspect ratio in the gage section (DB-HIGH). (b) Dumbbell coupon with a low aspect ratio in the gage section (DB-LOW). (c) Straight coupon with a high aspect ratio in the gage section (ST-HIGH). (d) Straight coupon with a low aspect ratio in the gage section (ST-LOW). (e) Comparison of dimensional aspect ratios between the tensile coupons from this study and tensile coupons from ASTM standards. Shaded region = grip location. All units in mm.
Tensile Testing.
The medial menisci of 13 unpaired hind bovine knees (stifle joint, mixed breed, age = 18–30 months) were layered using the previously described protocol for embedding the meniscus wedge in cellulose and slicing with the deli-slicer (Fig. 1(c)). Specimen coupons were cut from each layer by aligning the long axis of the punch along the preferred circumferential direction of the visible collagen fiber bundles. A total of 80 specimens were tested, with four groups of twenty specimens representing the four coupon geometries (Figs. 2(a)–2(d)). Ten of the specimens in each coupon group were tested with friction tabs, and ten without friction tabs. Each subgroup of ten specimens was acquired from at least five different knees. After punching, individual coupons were covered with saline-soaked gauze and placed back in the freezer for 24 h at −4.
Prior to tensile testing, the coupon being tested was thawed for 1–2 h. Tensile testing was performed using an Instron Mechanical Testing System (Instron, Norwood, MA; Electro-Puls E10000), and force data were recorded using a 25-lb force sensor (Omega Engineering, Stamford, CT; LCFD-25). After the coupon thawed, friction tabs were cut from fine grit emery cloth and the rough face was adhered to the coupon grip region (Figs. 2(a)–2(d); shaded region) using cyanoacrylate (3 M, Maplewood, MN). The stainless steel grips had 0.1 mm deep flat serrated edges spaced 1 mm apart. Coupons were mounted, preloaded to 0.1 N from a buckled state (load cell balanced when buckled), preconditioned to 8% strain [28] with a 1 Hz triangular waveform for 20 cycles, preloaded again to 0.1 N (load cell balanced again after this second preload), and then pulled to failure at a rate of 1% strain/s. Specimens were kept moist throughout testing using a drip system that applied one drop of 0.9% saline approximately every second. The initial specimen length was established from the grip-to-grip displacement after the second preload, and at this position, side profile images were taken with a digital camera to measure the initial mean cross-sectional area and to analyze the intraspecimen variation in width and thickness within the gage section (Figs. 3(a)–3(b)) [29]. On average, specimens were imaged for dimensional analysis 5–10 min after the saline drip had been applied. Axial forces were converted to engineering stress (first Piola–Kirchoff) by dividing by the initial cross-sectional area, and axial displacements were converted to engineering strains by dividing by the initial grip-to-grip length.
Fig. 3.
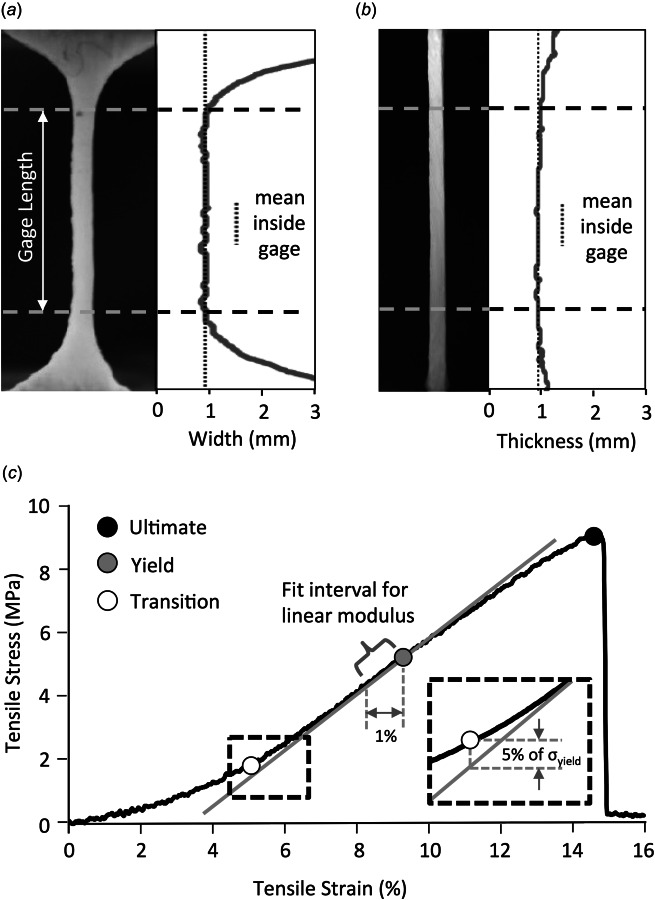
Methods used to analyze tensile tests. (a) The span of tissue within the gage section was plotted to calculate the intraspecimen width variation and (b) the intraspecimen thickness variation. (c) Mechanical properties were objectively measured from the stress–strain curve. Linear modulus was fit to a 1% strain interval below the yield stress. Transition stress was marked at the point where the stress–
strain curve deviated a set amount from the linear fit (inset). These calculations were automated using a custom matlab script.
Three failure modes were classified for each experiment depending on rupture location: midsubstance (M), grip (G), and near grip (NG). Ruptures that occurred within the gage section were classified as “midsubstance” and ruptures that originated at the grips, or propagated into the grips, were classified as “grip”. If tears occurred in the filleted region of DB coupons, or within approximately 1 mm of the grip in ST coupons, they were classified as “near grip.” If grip and near grip failures were grouped, they were called “non-midsubstance” failures.
The stress–strain curve generated from each experiment was analyzed using a custom matlab program to automate the measurement of the tensile mechanical properties. Three points of interest were identified on the stress–strain curve (Fig. 3(c)): the ultimate tensile strength (UTS), yield stress, and transition stress. The transition stress is the point between the toe region and linear region and physically represents the straightening of the crimped collagen fibers [30]. A reduction of material stiffness in the linear region may signify yield stress [11], where damage begins accumulating until the UTS is reached and rupture occurs. The UTS and failure strain were selected at the point of maximum stress, while the yield stress was determined at the point of maximum slope by taking the first derivative of the stress–strain curve [11,31]. The linear modulus was approximated using a linear fit of the stress–strain data between the yield point and a point on the stress–strain curve that had 1% less strain than the yield point (Fig. 3(c)). The transition stress was then identified as the point in the toe region of the stress–strain curve where the stress deviated from the fitted line of the linear modulus by 5% of the yield stress (Fig. 3(c), inset). This objective methodology was input into a matlab script that fully automated the mechanical analysis of all 80 experiments (average runtime per experiment = 2.7±0.3 s; 3.6 GHz processor).
Finite Element Analysis.
To approximate differences in the volumetric stress distributions between the four coupon geometries, computational finite element simulations of the tensile tests were run using abaqus/explicit (SIMULIA, Providence, RI). Hexahedral meshes were built using dimensions of the four different coupon punch geometries (Figs. 2(a)–2(d)). To isolate the effect of coupon geometry on the distribution of stress, all simulations used the same constitutive model, material parameters, and boundary conditions. A hyperelastic transversely isotropic material was selected with an isotropic matrix term (neo-Hookean; Young's modulus = 15 MPa, Poisson's ratio = 0.3 [32]) embedded with nonlinear tension-only fibers. These fibers consisted of uniaxial spring elements that each had an initial length of 0.2 mm and were distributed throughout the coupon cross-sectional area with a density of 36 spring elements per 1 mm2. Similar to Blankevoort and Huiskes [33], the force–strain behavior of each individual spring element was represented using piecewise constitutive equations to model the toe and linear regions:
| (1) |
where f is force, ε is axial strain, ε1 is a strain constant, and k1–k5 are spring constants. The six constants for the piecewise functions were calibrated (ε1 = 0.075, k1 = 63.4 N, k2 = 0.781 N, k3 = −0.003 N, k4 = 1.276 N, k5 = −0.066 N) using experimental force–displacement data from a uniaxial test of a representative ST-LOW specimen. The root-mean-square error of this model fit to the test data was 0.46 N, and these six calibrated parameters were used for all finite element simulations. Prior to axial stretching, the grip regions of the coupons (Figs. 2(a)–2(d); shaded region) were compressed by 20% to approximate the strain observed during gripping (data not shown). An axial stretch of 17.5% of the grip-to-grip length was then applied to each coupon by kinematic displacement of the grip region. This stretch magnitude approximated the stretch at UTS observed experimentally. To eliminate artifacts from localized element deformation, a percent volume threshold of 5% was used, where the maximum principal stress was selected as the stress value that 5% of the material had exceeded. The ratio between maximum principal stress within the gage section and the midsubstance regions was calculated.
Statistics.
The effect of layering technique on intraspecimen thickness variation was determined with a Kruskal–Wallis Test. The effect of the three coupon factors (coupon shape, aspect ratio, friction tabs) on failure mode (midsubstance, near grip, and grip) was assessed with a Fischer's exact test. The main effects and interaction effects of the three coupon factors on all measured mechanical properties (ultimate stress, yield stress, transition stress, ultimate strain, yield strain, transition strain, and modulus) were assessed using a multivariate analysis of variance (MANOVA) with Tukey posthoc testing. MANOVA tests were also used to directly assess the effect of the four different coupon types (DB-HIGH, DB-LOW, ST-HIGH, ST-LOW) on mechanical properties, and to directly assess the effect of failure mode on mechanical properties. Significance was set to p = 0.05 for all comparisons, and all results are reported as mean±one standard deviation.
3 Results
Effect of Test Methods on Coupon Dimensions.
The first part of this study was to compare the performance of different tissue layering techniques. The mean intraspecimen variation in thickness when layering the raw meniscus with the vibratome was 16.1±7.4%, and when layering the meniscus embedded in cellulose with the deli-slicer was 6.6±3.4% (Table 1). This 59% decrease in intraspecimen variation was significant (p = 0.002). However, if the deli-slicer was used to layer the raw meniscus (not embedded), the intraspecimen variation was 13.0±6.1%, and there was no significant improvement in intraspecimen thickness variation relative to the vibratome (Table 1).
Table 1.
Effect of layering technique on coupon physical dimensions
| Layering instrument | Tissue form | Thickness (mm) | Intraspecimen Variation (%) |
|---|---|---|---|
| Vibratome | Raw | 1.31 ± 0.24 | 16.1 ± 7.4a |
| Deli-Slicer | Raw | 1.16 ± 0.07 | 13.0 ± 6.1a |
| Deli-Slicer | Embedded | 1.19 ± 0.08 | 6.6 ± 3.4 |
Significantly greater than Deli-Slicer embedded (p < 0.05).
The second part of this study was to conduct tensile tests with four different coupon geometries. The measured coupon dimensions for tensile testing (Table 2) were on average 11% different than the coupon die dimensions (Figs. 2(a)–2(d)). The average intraspecimen variations for width and thickness within the gage section were less than 6% (Table 2).
Table 2.
Specimen dimensions for mechanical testing (sample size for each cell = 20; data combines coupons with and without friction tabs)
| Coupon geometry (ASTM) | Lengtha (mm) | Thicknessb (mm) | Widthb (mm) | Intraspecimen thickness variationb (%) | Intraspecimen width variationb (%) |
|---|---|---|---|---|---|
| DB-HIGH (D412) | 17.1 ± 0.4 | 0.98 ± 0.15 | 1.08 ± 0.12 | 5.3 ± 2.1 | 5.3 ± 1.6 |
| DB-LOW (D638) | 16.8 ± 0.3 | 1.08 ± 0.20 | 1.58 ± 0.12 | 4.3 ± 1.4 | 3.6 ± 1.4 |
| ST-HIGH (D3039) | 14.8 ± 0.3 | 1.07 ± 0.21 | 1.76 ± 0.27 | 5.4 ± 2.2 | 2.9 ± 1.1 |
| ST-LOW | 14.9 ± 0.4 | 1.13 ± 0.13 | 3.54 ± 0.32 | 5.2 ± 2.0 | 2.9 ± 2.9 |
Measured grip-to-grip.
Measured within the gage section.
Effect of Coupon Factors on Midsubstance Failures.
Coupon type had a significant effect on midsubstance ruptures (p < 0.001), with the highest incidence of 90% midsubstance ruptures occurring in the DB-HIGH group when using friction tabs (Fig. 4). Midsubstance ruptures occurred more frequently in DB than ST specimens (p < 0.001), with DB specimens having on average 70% midsubstance ruptures compared to 15% for ST specimens (Table 3, Fig. 4). The incidence of grip failures was greater in ST than DB specimens (p < 0.001), with grip failures occurring in 60% of ST specimens and only 5% of DB specimens. Using friction tabs resulted in 21% more midsubstance ruptures, but this difference was not significant (p = 0.50). Coupons with a higher aspect ratio resulted in 30% more midsubstance failures, but this difference was also not significant (p = 0.26). The incidence of grip failures was not affected by aspect ratio nor the inclusion of friction tabs (p > 0.8).
Fig. 4.
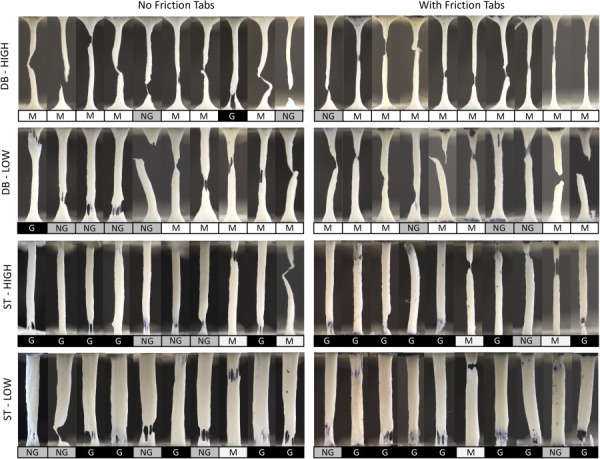
Ruptures of meniscus specimens from all 80 tensile tests (M—midsubstance, G—grip, NG—near grip). Dumbbell coupons (DB) had a 70% rate of midsubstance failures compared to a 15% rate of midsubstance failures by straight coupons (ST).
Table 3.
Tensile mechanical behavior of bovine meniscus with different types of coupon geometries (sample size for each cell = 20; data pools coupons with and without friction tabs)
| Coupon geometry (ASTM) | Ultimate stressa (MPa) | Yield stressa (MPa) | Transition stressa (MPa) | Ultimate strainb (%) | Yield strainb (%) | Transition strainb (%) | Linear modulus (MPa) | Midsubstance failure rate |
|---|---|---|---|---|---|---|---|---|
| DB-HIGH (D412) | 9.8 ± 4.1c | 5.1 ± 2.2c | 1.8 ± 0.6c,d | 16.2 ± 2.1 | 9.4 ± 2.2 | 5.2 ± 1.2 | 79.6 ± 31.4c | 80%c,d |
| DB-LOW (D638) | 11.4 ± 5.3c,d | 5.5 ± 3.1c,d | 2.0 ± 0.8c,d | 18.1 ± 2.6 | 10.1 ± 2.5* | 5.7 ± 1.4 | 80.2 ± 38.9c | 60%c,d |
| ST-HIGH (D3039) | 7.5 ± 4.4 | 3.3 ± 1.7 | 1.3 ± 0.6 | 15.3 ± 4.6 | 7.7 ± 3.4 | 4.5 ± 1.8 | 67.0 ± 39.0 | 20% |
| ST-LOW | 6.0 ± 3.4 | 2.8 ± 1.7 | 0.9 ± 0.4 | 16.4 ± 3.9 | 8.5 ± 2.7 | 4.8 ± 1.0 | 51.4 ± 23.7 | 10% |
Engineering stress.
Engineering strain, grip-to-grip.
Significantly greater than ST-LOW (p < 0.05).
Significantly greater than ST-HIGH (p < 0.05).
Effect of Coupon Factors on Mechanical Properties.
Coupon shape had a significant overall effect on measured mechanical properties (p < 0.001; Fig. 5, Table 4). Notably, dumbbell shaped coupons exhibited on average 57% greater ultimate strength (p < 0.001, Fig. 5(a)), 75% greater yield stress (p < 0.001, Fig. 5(a)), and 35% greater modulus compared to straight coupons (p = 0.02; Table 4). Coupons with higher aspect ratios were associated with greater stresses and lower strains, but these differences were only significant for ultimate strain (Fig. 5(b)). The inclusion of friction tabs increased ultimate strain by 15%, but had no effect on stress (Fig. 5(c)). A significant interaction existed between friction tabs and coupon shape, where removing the friction tabs resulted in a larger reduction in ultimate strength (p = 0.005), ultimate strain (p = 0.014), and modulus (p = 0.019) in ST coupons compared to DB coupons.
Fig. 5.
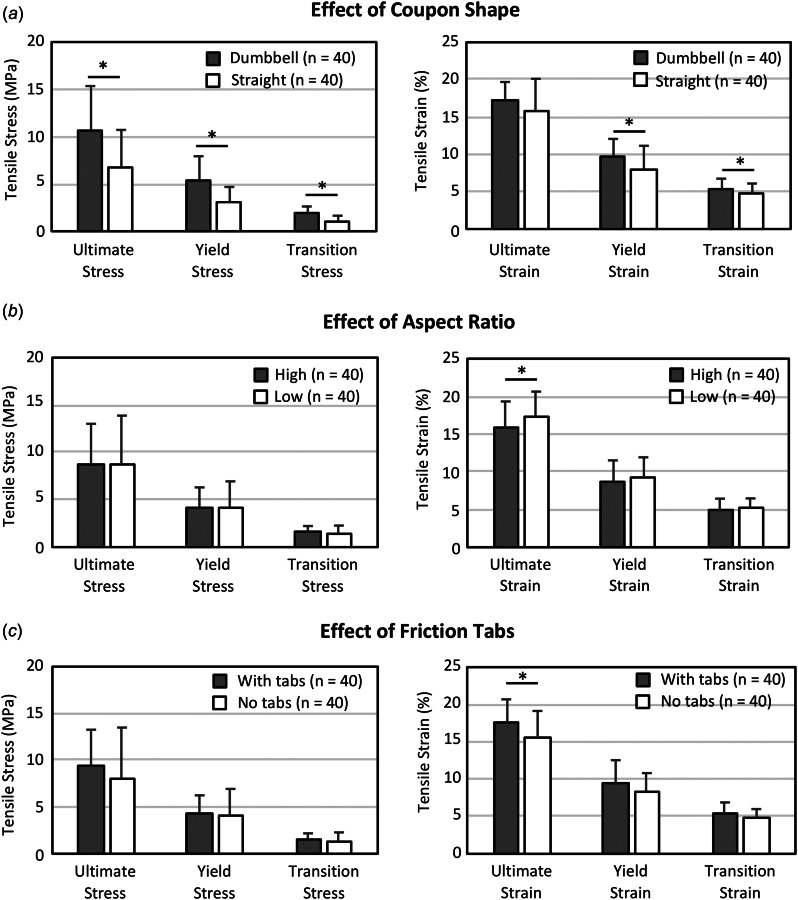
Main effects of coupon factors on mechanical properties. (a) Dumbbell (DB) coupons had significantly greater stress and strain than straight (ST) coupons, while there was little to no effect from (b) aspect ratio and (c) friction tabs. Each bar represents pooled specimens (n = 40) where significance was determined with a MANOVA (*p < 0.05). Note: All strains are measured grip-to-grip.
Table 4.
Comparison of tensile mechanical properties between different coupon shapes (DB, ST), aspect ratios (HIGH, LOW), and friction tabs (with tabs, no tabs)
| Coupon shape | Aspect ratio | Friction tabs | |||||||
|---|---|---|---|---|---|---|---|---|---|
| DB | ST | Effect size [95% CI] | HIGH | LOW | Effect size [95% CI] | With tabs | No tabs | Effect size [95% CI] | |
| Ultimate stress (MPa) | 10.6 ± 4.7 | 6.8 ± 3.9 | 0.9a [0.5, 1.3] | 8.7 ± 4.3 | 8.7 ± 5.2 | 0.0 [−0.4, 0.4] | 9.3 ± 4.0 | 8.1 ± 5.4 | 0.2 [−0.1, 0.6] |
| Yield stress (MPa) | 5.3 ± 2.6 | 3.0 ± 1.7 | 1.0a [0.6, 1.5] | 4.2 ± 2.1 | 4.2 ± 2.8 | 0.0 [−0.4, 0.4] | 4.3 ± 1.9 | 4.0 ± 2.9 | 0.1 [−0.3, 0.5] |
| Transition stress (MPa) | 1.9 ± 0.7 | 1.1 ± 0.6 | 1.2a [0.8, 1.6] | 1.5 ± 0.7 | 1.4 ± 0.8 | 0.1 [−0.2, 0.5] | 1.6 ± 0.6 | 1.4 ± 0.9 | 0.2 [−0.1, 0.6] |
| Ultimate strain (%) | 17.1 ± 2.5 | 15.8 ± 4.3 | 0.4 [0.0, 0.8] | 15.7 ± 3.6 | 17.2 ± 3.4 | −0.4a [−0.8, 0.0] | 17.5 ± 3.2 | 15.5 ± 3.6 | 0.6a [0.2, 1.0] |
| Yield strain (%) | 9.7 ± 2.3 | 8.1 ± 3.0 | 0.6a [0.2, 1.0] | 8.6 ± 3.0 | 9.3 ± 2.7 | −0.2 [−0.7, 0.2] | 9.4 ± 3.2 | 8.4 ± 2.4 | 0.3 [−0.1, 0.8] |
| Transition strain (%) | 5.4 ± 1.3 | 4.6 ± 1.5 | 0.6a [0.1, 1.0] | 4.9 ± 1.6 | 5.2 ± 1.3 | −0.2 [−0.7, 0.2] | 5.3 ± 1.6 | 4.8 ± 1.2 | 0.4 [0.0, 0.8] |
| Linear modulus (MPa) | 80 ± 35 | 59 ± 33 | 0.6a [0.2, 1.0] | 73 ± 35 | 66 ± 35 | 0.2 [−0.2, 0.6] | 72 ± 29 | 67 ± 40 | 0.1 [−0.3, 0.6] |
Effect sizes in bold represent a significant difference (p < 0.05).
Effect sizes and their confidence intervals (CI) give a 95% confidence that potential differences in mechanical properties between all nonsignificant comparisons have an absolute effect size ≤0.8. Sample size for each cell = 40 (data combined from the coupon factors not being compared).
The effect of failure mode on the measured mechanical properties was also analyzed. If grip and near grip failure modes were grouped and compared to midsubstance failures, specimens with midsubstance failures had significantly greater stresses and strains for all measured values (Fig. 6(a)). When examining only ST coupons, specimens with midsubstance failures again had greater stresses and strains than non-midsubstance failures, but only differences in ultimate and yield strain were significant (Fig. 6(b)). When examining only DB coupons, there were no significant differences in the mechanical properties of specimens with midsubstance or non-midsubstance failures (Fig. 6(c)). There were also no significant differences in modulus between the three different failure types (p > 0.3), regardless of whether grip and near failures were grouped. If midsubstance failures were directly compared to grip failures (G) for all DB and ST tests, specimens with midsubstance failures had on average 37% greater ultimate stress (not significant, p = 0.09), 61% greater yield stress (p = 0.01), 71% greater transition stress (p < 0.001), 10% greater ultimate strain (not significant, p = 0.25), 27% greater yield strain (p = 0.01), and 28% greater transition strain (p = 0.002) than specimens with grip failures. However, there were no significant differences in the mechanical properties of specimens with near grip failures (NG) compared to midsubstance or grip failures.
Fig. 6.
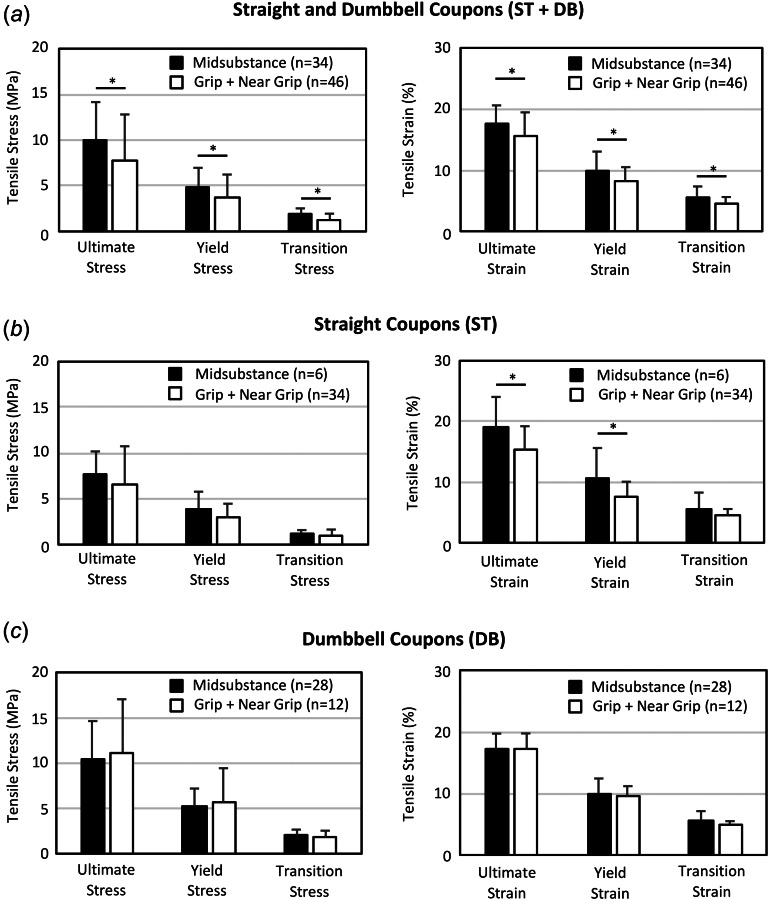
Effect of failure mode on the measured mechanical properties. (a) When ST and DB specimens were grouped, midsubstance failures were associated with greater stresses and strains compared to non-midsubstance failures (grip + near grip), but these differences were (b) less significant when examining only ST coupons, and (c) no differences were detected when examining only DB coupons. *significant difference (p < 0.05).
Finite Element Analysis.
Maximum principal stresses in the DB-HIGH coupon were 2× greater at the midsubstance than near the grip (Fig. 7). Conversely, principal stresses in both ST coupons were 2× greater near the grip line than at the midsubstance. The DB-LOW coupon had 39% greater principal stresses at the midsubstance compared to the grip line.
Fig. 7.
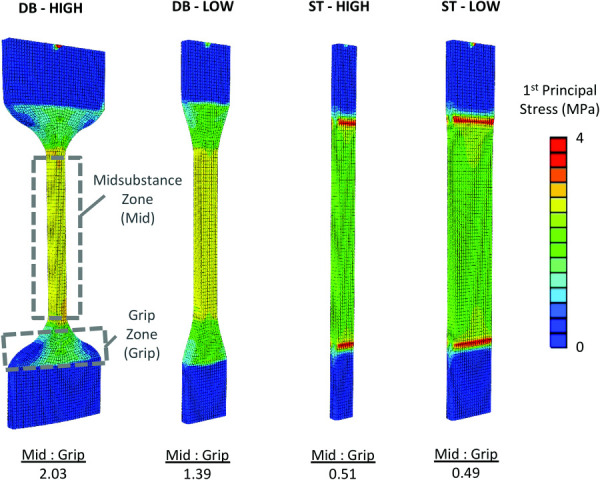
Finite element simulations of meniscus tensile tests using different coupon geometries. In ST specimens, grip compression creates large stresses near the grip zone (grip) relative to the midsubstance zone (mid). In DB coupons, the reduced cross-sectional area of the gage section results in greater stresses at the midsubstance relative to the grip zone.
Discussion
Uniaxial tensile testing is a fundamental experiment to characterize the mechanical integrity of soft connective tissues, yet a lack of test standards has hindered the quality and reproducibility of these experiments. For the first time, this study compared test methods from ASTM standards to identify best practices for tensile testing of meniscus and other soft fibrous tissues.
A valid failure mode for a tensile test is when specimen rupture occurs in the gage section (i.e., midsubstance). In general, ASTM recommends that coupons that fail outside of the gage section, at or near the grips, should be discarded [4,34]. Midsubstance failures are desired because the gage section provides a long region of known uniform tensile stress to study material behavior representative of the larger structure, while regions at or near the grips have unknown complex stress states caused by grip compression and the curved coupon geometry (Fig. 7). We found that DB coupons resulted in midsubstance failures in 70% of tests, while ST coupons had midsubstance failures in only 15% of tests. Finite element analysis supported this experimental finding by showing that the greatest tensile stresses in ST coupons occur at the grips, while in DB coupons the reduced cross-sectional area of the gage section (midsubstance) is subjected to the greatest tensile stress (Fig. 7). Due to the structural heterogeneity of soft tissue, it was not surprising that a subset of DB and ST coupons failed away from the critical stress elements identified in these finite element models. Although the greater rate of midsubstance failures we observed in DB coupons was not unexpected, there has been uncertainty on whether cutting dumbbells from highly aligned fibrous tissue would be beneficial, since fascicles in the width tapered section of DB coupons would be transected and potentially not bear load [34]. Our results show a definitive benefit, suggesting the extracellular matrix is able to sufficiently transfer load through the tapered sections to warrant DB geometry.
The coupon shape also affected the measured mechanical properties. The ultimate stress, yield stress, and transition stress, along with linear modulus, were between 35 and 75% greater in DB coupons compared to ST coupons (Fig. 5(a), Table 3). An increase in the ultimate stress between DB and ST coupons was similarly observed by Peloquin et al. [11], who reported that using an expanded tab coupon design for bovine meniscus, which has a reduced width region similar to our DB coupons, resulted in a 33% increase in ultimate stress compared to straight coupons. Our finite element models may offer one possible explanation for these collective experimental findings. Due to the increased structural stiffness of the width tapered ends relative to the gage section, the midsubstance of the DB-LOW models had 1.2 times greater axial strain and axial stress compared to the midsubstance of the ST-HIGH models when the same grip-to-grip strain was applied, even though these coupons have the same cross-sectional area in the midsubstance (Fig. 7). When we then consider our high confidence that ST coupons fail at lower grip-to-grip strains than DB coupons (Table 4), likely due to high stress concentrations at the grips (Fig. 7), it makes physical sense that ST coupons have less measured strength than DB coupons. These results and interpretations emphasize the importance of using coupons with reduced width regions (i.e., dumbbell coupons) to not underestimate the tensile strength of soft tissue. This recommendation is supported by ASTM standards for elastomers, which state that straight coupons should only be used for tensile testing when it is not feasible to prepare a dumbbell coupon; however, ASTM also points out that straight coupons can still be quite useful for testing nonrupture stress–strain behavior [6]. Similar to other studies [10,11,35], we calculated strain from grip-to-grip displacements, and it is worth noting that the differences we observed in modulus and strain values between DB and ST coupons may have been different had we measured local strains inside the gage section.
An important and persistent question in tensile testing of soft tissue is whether failure mode influences the measured mechanical properties. In other words, what failure modes are acceptable when characterizing tissue strength and elongation to failure. In this study, DB and ST specimens with midsubstance failures had greater stresses and strains at all three points of interest (ultimate, yield, and transition) compared to specimens with non-midsubstance failures (grip + near grip; Fig. 6(a)). The apparent detrimental effect of non-midsubstance failures on mechanical properties seems logical, as grip and near grip ruptures indicate that the ultimate stress and strain of the tissue in the gage section was never reached, and failure occurred “prematurely” due to complex stresses near the grips. However, since coupon shape has a strong independent effect on mechanical properties (Fig. 5(a)), we need to also examine ST and DB coupons individually to rule out associative effects. If we first examine only ST coupons, specimens with midsubstance failures have 25% greater ultimate strain (p = 0.04) and 17% greater ultimate stress (p = 0.52) than specimens that failed near the grip (Fig. 6(b)). Although differences in ultimate stress were not significant, these ST results do follow the trend observed when pooling all coupons (Fig. 6(a)). Yet, when we examine the effect of failure mode on the mechanical properties of DB coupons, we see a very different outcome. The DB specimens with midsubstance failures had nearly equal ultimate strain (p = 0.9) and slightly less ultimate stress than specimens with non-midsubstance failures (Fig. 6(c); not significant, p = 0.7). These results indicate that non-midsubstance failures had no effect on the measured mechanical properties of DB coupons. Three prior studies have similarly found that failure mode did not affect the measured tensile strength of meniscus and tendon [11,26,36].
From a mechanical point of view, the negligible effect of failure mode on DB tensile strength is a perplexing result. One possible explanation is that a disproportionally higher number of stronger specimens fail at the grips, possibly due to grip induced microtears being propagated by large tensile stresses. This could give the outward appearance that specimens with grip failures have equal or even greater strength than specimens with midsubstance failures. An anecdotal observation from this study that supports this theory is that although only two out of forty DB specimens had grip failures (Fig. 4), one of the specimens with a grip failure had the greatest ultimate strength measured in this study (22.6 MPa). We also observed this phenomenon when conducting tensile tests to failure on dumbbell coupons of composite hydrogel films that were engineered to have different molecular compositions that influenced mechanical strength [37], as we found that stronger specimens were more susceptible to grip failure. While this theory would require future research to prove or disprove, it does highlight the interdependence of grip failures and tensile properties, and the challenges in interpreting the mechanical results from grip failures, even when they appear equivalent to midsubstance failures. Ideally, the confounding factors associated with grip failures would be reduced or eliminated by conducting tensile tests with a high percentage of midsubstance failures. We therefore strongly encourage researchers to use test methods that promote midsubstance failures in the gage section. We also encourage researchers to always report the number of specimens that fail at or near the grips, regardless of whether the specimens with grip failures were excluded from further analysis. In the event that a high percentage of tensile tests result in grip failures, we advise researchers to discuss possible reasons for this undesirable failure mode and the potential impact on the study results. This information will aid data interpretation and may lead to continued advancements in tensile test protocols.
The coupon geometries used in this study were adopted from ASTM standards for plastics [4], vulcanized rubber and thermoplastic elastomers [6], and polymer matrix composites [5]. These ASTM standards were considered relevant to dense connective tissue, which is a fiber reinforced matrix that exhibits viscoelastic behavior. Due to meniscal size restrictions, we were unable to cut coupons to the specified ASTM dimensions, but rather we cut scaled-down coupons based on critical aspect ratios (Fig. 2). To accurately cut DB coupons to targeted dimensions (Fig. 2), we used a 3D printed device called Print-A-Punch [27]. From our results, we would recommend using DB coupons based on ASTM tensile test standards for elastomers (DB-HIGH, Fig. 2(a)) when testing tissue along the fiber direction. This coupon geometry should give a high percentage of midsubstance failures, and the 80% incidence of midsubstance failures we observed with these coupons in this study is higher than most other meniscus studies in the literature, which range between 9 and 89% [10,11,18,21,23]. However, if the amount of tissue is limited, using a narrower coupon based on ASTM standards for plastics (DB-LOW, Fig. 2(b)) should also give a reasonable percentage of midsubstance failures.
In addition to providing dimensions and tolerances for tensile test coupons, ASTM provides suggestions on how to reduce the risk of grip failure. One recommendation is to increase the aspect ratio of the gage section (L:W) or increase the aspect ratio between the coupon's outer and reduced width (WO:W; Fig. 2) [4]. Accordingly, we found that meniscus coupons with higher aspect ratios had 30% more midsubstance failures, but this increase was not significant. Our finite element analysis offers a potential explanation for this lack of significance. In DB coupons, both coupon geometries had a sufficient WO:W ratio (Fig. 2) to place the maximum principal stress inside the gage section; while in ST coupons, the difference in gage aspect ratio had a minimal effect on the high stresses at the grips relative to the midsubstance (Fig. 7). Nevertheless, the most midsubstance failures occurred when using a DB coupon with the highest aspect ratios (DB-HIGH; Fig. 2(a)). Based on our results and ASTM guidelines, we would recommend the following minimum aspect ratios for tensile testing of soft tissue. The length and width of the gage section should have an aspect ratio of at least 5:1 (L:W; Fig. 2), and the coupon's outer and reduced width should have an aspect ratio of at least 3:1 (WO:W; Fig. 2). These minimal aspect ratios align with ASTM standards for plastics. To increase the likelihood of ruptures within the gage section, these aspect ratios can be increased to better match ASTM standards for elastomers.
Another ASTM recommendation to reduce grip failures is to add friction tabs at the tissue–grip interface [4,5]. This technique is often used in soft tissue studies [13,21,24], but its efficacy is unclear. Although our DB experiments did not have any grip failures when using friction tabs (Fig. 4), we did not find a significant effect of friction tabs on the incidence of midsubstance failures. Interestingly, specimens with friction tabs did have 13% greater ultimate strains at failure (Fig. 5(c)), which may indicate that the friction tabs caused slipping at the grip–tissue interface, although this was not evident in the stress–strain curves. Our results suggest that the benefit of adhering friction tabs to the tissue may not outweigh the additional complexity of this experimental step. It is important to note that we used metal grips with fine flat serrated teeth, and that friction tabs may have a different effect on grip failures when using grips with other teeth configurations.
The DB coupon dimensions used in this study are good matches to several previous studies that characterized tensile properties in meniscus [20,23] and ligament [1], but they markedly differ from soft tissue studies that use modified DB coupons with a short reduced width region [11,12,17,22]. Omitting a long reduced width region with a uniform cross-sectional area (gage section) could lead to the erroneous calculation of tensile properties by (1) imposing failure on a small localized region that may not represent the larger continuous structure, and (2) creating a stress state at the failure site that is more complex than simple tension [34].
According to ASTM, test coupons must be fabricated to specific dimensions that do not exceed tolerance limits [4–6]. This ensures experimental transparency and reproducibility between research groups. For nonplanar soft tissue, coupons should therefore be fabricated using instruments that can layer tissue to a consistent thickness with low intraspecimen variation. By using a light-duty commercial deli-slicer, embedded meniscus was layered with mean intraspecimen variations between 4.3 and 6.6% (Tables 1 and 2), while a standard tissue layering instrument (vibratome) [38] had intraspecimen variations of 16.1% (Table 1). For comparison, ASTM thickness tolerances for plastic tensile coupons are specified to be within 12.5% of the mean thickness [4]. Therefore, a deli-slicer is an appropriate instrument to layer soft fibrous tissue to maintain dimensional tolerances consistent with ASTM standards.
Similar to differences between a circular saw and jigsaw, the deli-slicer is a powerful tool that has mechanical advantages over a vibratome. For example, our deli-slicer's 12″ diameter blade at 360 rpm has a blade speed ~36 times faster than a vibratome operating at 80 Hz (1 mm amplitude)—and has a cutting edge that is 26 times longer than the standard 36 mm cutting edge of a vibratome razor blade. As a result, the deli-slicer blade maintained a sharp edge that cleanly cut a meniscus layer in under three seconds, whereas the vibratome took approximately 100 s to cut a meniscus layer and tended to tear meniscus samples, creating an uneven surface (Fig. 1(f)). It is possible that the vibratome would have performed better if the meniscus was embedded (Fig. 1(c)), but we did not test this technique since our cellulose mixture was incompatible with the vibratome's saline bath.
Importantly, to achieve low dimensional variability with a deli-slicer, we needed to (1) embed and freeze the tissue in cellulose to create a planar cutting surface, and (2) apply even pressure to the frozen embedded tissue while cutting in one continuous motion. Mastering these techniques required practice. The ideal mixture of cellulose powder to water was qualitatively found to be 8:3 (cellulose:water). This mixture provided sufficient structural support without hindering slicing due to high ice content. We also needed to use a commercial deli-slicer model with rigid stainless steel components. The first deli-slicer we purchased was for home use (Continental Electric, Gary, IN; Model PS77711), and had too much flexion between the fence and blade (Fig. 1(d)), resulting in nonuniform layers. Overall, the excellent performance of this novel layering technique, in addition to the low-cost, speed, and portability of a deli-slicer, makes it an attractive alternative to established instruments, such as vibratomes and microtomes [38], for fabricating material testing coupons from soft tissue.
The tensile properties measured in this study can be compared to published values. Interestingly, the UTS and linear modulus from this study are closer to values previously reported for human than bovine. Our linear modulus and UTS results were within 30% and 15% of linear modulus and UTS values for human meniscus, respectively [10,13,35], but were on average 55% and 50% less than published values for bovine meniscus, respectively [3,11,27]. While differences in tensile properties would be expected due to variations between studies in coupon harvest location, layering cutting plane, coupon geometry, tissue hydration, and bovine age and breed, such large differences could also suggest that our methods have underestimated the tensile properties. However, considering the high incidence of midsubstance failures in our DB coupons, along with the relative consistency in mechanical properties between 80 specimens with variable coupon geometries (Fig. 2), the relatively weaker tensile properties measured in this study appear to be an accurate representation of the bovine meniscus being tested.
This study had limitations. First, tests were performed using a saline drip to hydrate the specimen. Although drip systems are common in tensile tests of soft tissue, this method can cause nonphysiological levels of hydration that influence mechanical properties [39]. Next, all experiments were performed at a single 1%/s strain rate typical for quasi-static experiments, and results may not be applicable for very high rates of strain [40]. All specimens were harvested from the central region of the medial meniscus and therefore our results may only be applicable to this location, though at least one prior study found no significant differences in mechanical properties with respect to region or medial/lateral location [10]. Finally, we used bovine meniscus as a surrogate for human tissue. Although there are similarities in the structural composition and mechanical properties of bovine and human meniscus [41], human meniscus is anatomically smaller than bovine and therefore coupon geometries would need to be scaled down for tensile testing in humans.
In conclusion, this study provided specimen dimensions and test protocols, based on ASTM standards, that can limit the incidence of grip failures and improve the transparency and reproducibility of meniscus tensile testing. Due to compositional and organizational similarities of the collagen networks in soft connective tissue, the recommendations from this study could be extended to tensile experiments of other soft connective tissues, including ligament, tendon, and the annulus fibrosus. The broad adoption of evidence-based test standards for mechanical testing can help advance collective research efforts in normal, diseased, and engineered musculoskeletal tissue.
Acknowledgment
We gratefully acknowledge support from the Biomolecular Research Center at Boise State University, along with Greenfield Meats (Meridian, ID) for their donation of bovine knee joints.
Funding Data
National Science Foundation (Grant No. 1554353; Funder ID: 10.13039/100000001).
National Institute of General Medical Sciences (Grant No. P20GM109095; Funder ID: 10.13039/100000057).
References
- [1]. Quapp, K. M. , and Weiss, J. A. , 1998, “ Material Characterization of Human Medial Collateral Ligament,” ASME J. Biomech. Eng., 120(6), pp. 757–763. 10.1115/1.2834890 [DOI] [PubMed] [Google Scholar]
- [2]. Lynch, H. A. , Johannessen, W. , Wu, J. P. , Jawa, A. , and Elliott, D. M. , 2003, “ Effect of Fiber Orientation and Strain Rate on the Nonlinear Uniaxial Tensile Material Properties of Tendon,” ASME J. Biomech. Eng., 125(5), pp. 726–731. 10.1115/1.1614819 [DOI] [PubMed] [Google Scholar]
- [3]. Danso, E. K. , Honkanen, J. T. J. , Saarakkala, S. , and Korhonen, R. K. , 2014, “ Comparison of Nonlinear Mechanical Properties of Bovine Articular Cartilage and Meniscus,” J. Biomech., 47(1), pp. 200–206. 10.1016/j.jbiomech.2013.09.015 [DOI] [PubMed] [Google Scholar]
- [4].ASTM, 2003, Standard Test Method for Tensile Properties of Plastics, ASTM International, West Conshohocken, PA, Standard No. D638-02a.https://www.astm.org/DATABASE.CART/HISTORICAL/D638-02A.htm [Google Scholar]
- [5].ASTM, 2000, Standard Test Method for Tensile Properties of Polymer Matrix Composite Materials, ASTM International, West Conshohocken, PA, Standard No. D 3039/D 3039M–00.https://www.astm.org/DATABASE.CART/HISTORICAL/D3039D3039M-00.htm [Google Scholar]
- [6].ASTM, 2006, Standard Test Methods for Vulvanized Rubber and Thermoplastic Elastomers—Tension, ASTM International, West Conshohocken, PA, Standard No. D 412–06a.https://www.astm.org/DATABASE.CART/HISTORICAL/D412-06A.htm [Google Scholar]
- [7].ASTM, 2009, Standard Test Methods for Tension Testing of Metallic Materials," ASTM International, West Conshohocken, PA, Standard No. 9EB/EBM–09. [Google Scholar]
- [8]. Scholze, M. , Singh, A. , Lozano, P. F. , Ondruschka, B. , Ramezani, M. , Werner, M. , and Hammer, N. , 2018, “ Utilization of 3D Printing Technology to Facilitate and Standardize Soft Tissue Testing,” Sci. Rep., 8(1), p. 11340. 10.1038/s41598-018-29583-4 [DOI] [PMC free article] [PubMed]
- [9]. Goertzen, D. J. , Budney, D. R. , and Cinats, J. G. , 1997, “ Methodology and Apparatus to Determine Material Properties of the Knee Joint Meniscus,” Med. Eng. Phys., 19(5), pp. 412–419. 10.1016/S1350-4533(97)00011-8 [DOI] [PubMed] [Google Scholar]
- [10]. Tissakht, M. , and Ahmed, A. M. , 1995, “ Tensile Stress-Strain Characteristics of the Human Meniscal Material,” J. Biomech., 28(4), pp. 411–422. 10.1016/0021-9290(94)00081-E [DOI] [PubMed] [Google Scholar]
- [11]. Peloquin, J. M. , Santare, M. H. , and Elliott, D. M. , 2016, “ Advances in Quantification of Meniscus Tensile Mechanics Including Nonlinearity, Yield, and Failure,” ASME J. Biomech. Eng., 138(2), p. 021002. 10.1115/1.4032354 [DOI] [PMC free article] [PubMed] [Google Scholar]
- [12]. Werbner, B. , Zhou, M. , and O'Connell, G. , 2017, “ A Novel Method for Repeatable Failure Testing of Annulus Fibrosus,” ASME J. Biomech. Eng., 139(11), p. 111001. 10.1115/1.4037855 [DOI] [PubMed] [Google Scholar]
- [13]. Lechner, K. , Hull, M. L. , and Howell, S. M. , 2000, “ Is the Circumferential Tensile Modulus Within a Human Medial Meniscus Affected by the Test Sample Location and Cross-Sectional Area?,” J. Orthop. Res., 18(6), pp. 945–951. 10.1002/jor.1100180614 [DOI] [PubMed] [Google Scholar]
- [14]. O'Connell, G. D. , Guerin, H. L. , and Elliott, D. M. , 2009, “ Theoretical and Uniaxial Experimental Evaluation of Human Annulus Fibrosus Degeneration,” ASME J. Biomech. Eng., 131(11), p. 111007. 10.1115/1.3212104 [DOI] [PMC free article] [PubMed] [Google Scholar]
- [15]. Von Forell, G. A. , Hyoung, P. S. , and Bowden, A. E. , 2014, “ Failure Modes and Fracture Toughness in Partially Torn Ligaments and Tendons,” J. Mech. Behav. Biomed. Mater., 35, pp. 77–84. 10.1016/j.jmbbm.2014.03.020 [DOI] [PubMed] [Google Scholar]
- [16]. Ristaniemi, A. , Stenroth, L. , Mikkonen, S. , and Korhonen, R. K. , 2018, “ Comparison of Elastic, Viscoelastic and Failure Tensile Material Properties of Knee Ligaments and Patellar Tendon,” J. Biomech., 79, pp. 31–38. 10.1016/j.jbiomech.2018.07.031 [DOI] [PubMed] [Google Scholar]
- [17]. Schmidt, E. C. , Chin, M. , Aoyama, J. T. , Ganley, T. J. , Shea, K. G. , and Hast, M. W. , 2019, “ Mechanical and Microstructural Properties of Pediatric Anterior Cruciate Ligaments and Autograft Tendons Used for Reconstruction,” Orthop. J. Sport. Med., 7(1), p. 2325967118821667. 10.1177/2325967118821667 [DOI] [PMC free article] [PubMed] [Google Scholar]
- [18]. Peloquin, J. M. , Santare, M. H. , and Elliott, D. M. , 2018, “ Short Cracks in Knee Meniscus Tissue Cause Strain Concentrations, but Do Not Reduce Ultimate Stress, in Single-Cycle Uniaxial Tension,” R. Soc. Open Sci., 5(11), p. 181166. 10.1098/rsos.181166 [DOI] [PMC free article] [PubMed] [Google Scholar]
- [19]. Kolz, C. W. , Suter, T. , and Henninger, H. B. , 2015, “ Regional Mechanical Properties of the Long Head of the Biceps Tendon,” JCLB, 30(9), pp. 940–945. 10.1016/j.clinbiomech.2015.07.005 [DOI] [PubMed] [Google Scholar]
- [20]. Fischenich, K. M. , Lewis, J. , Kindsfater, K. A. , Bailey, T. S. , and Haut Donahue, T. L. , 2015, “ Effects of Degeneration on the Compressive and Tensile Properties of Human Meniscus,” J. Biomech., 48(8), pp. 1407–1411. 10.1016/j.jbiomech.2015.02.042 [DOI] [PubMed] [Google Scholar]
- [21]. Freutel, M. , Scholz, N. B. , Seitz, A. M. , Ignatius, A. , and Dürselen, L. , 2015, “ Mechanical Properties and Morphological Analysis of the Transitional Zone Between Meniscal Body and Ligamentous Meniscal Attachments,” J. Biomech., 48(8), 1350–1355. 10.1016/j.jbiomech.2015.03.003 [DOI] [PubMed] [Google Scholar]
- [22]. Lakes, E. H. , Kline, C. L. , McFetridge, P. S. , and Allen, K. D. , 2015, “ Comparing the Mechanical Properties of the Porcine Knee Meniscus When Hydrated in Saline Versus Synovial Fluid,” J. Biomech., 48(16), pp. 4333–4338. 10.1016/j.jbiomech.2015.10.046 [DOI] [PubMed] [Google Scholar]
- [23]. Abdelgaied, A. , Stanley, M. , Galfe, M. , Berry, H. , Ingham, E. , and Fisher, J. , 2015, “ Comparison of the Biomechanical Tensile and Compressive Properties of Decellularised and Natural Porcine Meniscus,” J. Biomech., 48(8), pp. 1389–1396. 10.1016/j.jbiomech.2015.02.044 [DOI] [PubMed] [Google Scholar]
- [24]. Criscenti, G. , De Maria, C. , Sebastiani, E. , Tei, M. , Placella, G. , Speziali, A. , Vozzi, G. , and Cerulli, G. , 2016, “ Material and Structural Tensile Properties of the Human Medial Patello-Femoral Ligament,” J. Mech. Behav. Biomed. Mater., 54, pp. 141–148. 10.1016/j.jmbbm.2015.09.030 [DOI] [PubMed] [Google Scholar]
- [25]. Shi, D. F. , Wang, D. M. , Wang, C. T. , and Liu, A. , 2012, “ A Novel, Inexpensive and Easy to Use Tendon Clamp for In Vitro Biomechanical Testing,” Med. Eng. Phys., 34(4), pp. 516–520. 10.1016/j.medengphy.2011.11.019 [DOI] [PubMed] [Google Scholar]
- [26]. Ng, B. H. , Chou, S. M. , and Krishna, V. , 2005, “ The Influence of Gripping Techniques on the Tensile Properties of Tendons,” Proc. Inst. Mech. Eng. Part H, 219(5), pp. 349–354. 10.1243/095441105X34239 [DOI] [PubMed] [Google Scholar]
- [27].Nelson, S. J., Creechley, J. J., Wale, M. E. , and Lujan, T. J., . 2020, “ Print-A-Punch: A 3D Printed Device to Cut Dumbbell-Shaped Specimens From Soft Tissue for Tensile Testing,” J. Biomech., 112, p. 110011.1016/j.jbiomech.2020.110011 [DOI] [PMC free article] [PubMed] [Google Scholar]
- [28]. Lujan, T. , and Underwood, C. , 2007, “ Effect of Dermatan Sulfate Glycosaminoglycans on the Quasi-Static Material Properties of the Human Medial Collateral Ligament,” J. Orthop. Res., 25(7), pp. 894–903. 10.1002/jor.20351 [DOI] [PubMed] [Google Scholar]
- [29]. Creechley, J. J. , Krentz, M. E. , and Lujan, T. J. , 2017, “ Fatigue Life of Bovine Meniscus Under Longitudinal and Transverse Tensile Loading,” J. Mech. Behav. Biomed. Mater., 69, pp. 185–192. 10.1016/j.jmbbm.2016.12.020 [DOI] [PMC free article] [PubMed] [Google Scholar]
- [30]. Fratzl, P. , 2008, Collagen: Structure and Mechanics, Springer, Berlin. [Google Scholar]
- [31]. Goh, K. L. , Holmes, D. F. , Lu, Y. , Purslow, P. P. , Kadler, K. E. , Bechet, D. , and Wess, T. J. , 2012, “ Bimodal Collagen Fibril Diameter Distributions Direct Age-Related Variations in Tendon Resilience and Resistance to Rupture,” J. Appl. Physiol., 113(6), pp. 878–888. 10.1152/japplphysiol.00258.2012 [DOI] [PMC free article] [PubMed] [Google Scholar]
- [32]. Danso, E. K. , Julkunen, P. , and Korhonen, R. K. , 2018, “ Poisson's Ratio of Bovine Meniscus Determined Combining Unconfined and Confined Compression,” J. Biomech., 77, pp. 233–237. 10.1016/j.jbiomech.2018.07.001 [DOI] [PubMed] [Google Scholar]
- [33]. Blankevoort, L. , and Huiskes, R. , 1996, “ Validation of a Three-Dimensional Model of the Knee,” J. Biomech., 29(7), pp. 955–961. 10.1016/0021-9290(95)00149-2 [DOI] [PubMed] [Google Scholar]
- [34]. Davis, J. R. , 2004, Tensile Testing, 2nd ed., ASM International, Cleveland, OH. [Google Scholar]
- [35]. Tanaka, M. L. , Vest, N. , Ferguson, C. M. , and Gatenholm, P. , 2014, “ Comparison of Biomechanical Properties of Native Menisci and Bacterial Cellulose Implant,” Int. J. Polym. Mater. Polym. Biomater., 63(17), pp. 891–897. 10.1080/00914037.2014.886226 [DOI] [Google Scholar]
- [36]. Smith, C. W. , Young, I. S. , and Kearney, J. N. , 1996, “ Mechanical Properties of Tendons: Changes With Sterilization and Preservation,” ASME J. Biomech. Eng., 118(1), pp. 56–61. 10.1115/1.2795946 [DOI] [PubMed] [Google Scholar]
- [37]. Thurston, J. H. , Clifford, A. J. , Henderson, B. S. , Smith, T. R. , Quintana, D. , Cudworth, K. F. , Lujan, T. J. , and Cornell, K. A. , 2020, “ Development of Photoactive G-C3N4/Poly(Vinyl Alcohol) Composite Hydrogel Films With Antimicrobial and Antibiofilm Activity,” ACS Appl. Bio Mater., 3(3), pp. 1681–1689. 10.1021/acsabm.9b01240 [DOI] [PMC free article] [PubMed] [Google Scholar]
- [38]. Belkoff, S. M. , and Haut, R. C. , 2008, Experimental Methods in Biological Tissue Testing ( Springer Handbook of Experimental Solid Mechanics; ), Springer, Berlin. [Google Scholar]
- [39]. Haut, R. C. , and Powlison, A. C. , 1990, “ The Effects of Test Environment and Cyclic Stretching on the Failure Properties of Human Patellar Tendons,” J. Orthop. Res., 8(4), pp. 532–540. 10.1002/jor.1100080409 [DOI] [PubMed] [Google Scholar]
- [40]. Ng, B. H. , Chou, S. M. , Lim, B. H. , and Chong, A. , 2004, “ Strain Rate Effect on the Failure Properties of Tendons,” Proc. Inst. Mech. Eng. Part H, 218(3), pp. 203–206. 10.1243/095441104323118923 [DOI] [PubMed] [Google Scholar]
- [41]. Sweigart, M. A. , Zhu, C. F. , Burt, D. M. , Deholl, P. D. , Agrawal, C. M. , Clanton, T. O. , and Athanasiou, K. A. , 2004, “ Intraspecies and Interspecies Comparison of the Compressive Properties of the Medial Meniscus,” Ann. Biomed. Eng., 32(11), pp. 1569–1579. 10.1114/B:ABME.0000049040.70767.5c [DOI] [PubMed] [Google Scholar]