

Abstract
BACKGROUND AND PURPOSE: Discriminating pyogenic brain abscesses from cystic or necrotic tumors is sometimes difficult with CT or MR imaging. We compared findings of proton MR spectroscopy (1H-MRS) with those of diffusion-weighted imaging to determine which technique was more effective for this differential diagnosis.
METHODS: Fourteen patients (necrotic or cystic tumor [n = 7]; pyogenic abscess [n = 7]) who underwent 1.5-T 1H-MRS and diffusion-weighted imaging and had findings of ring-shaped enhancement after contrast agent administration were enrolled in this study. Diffusion-weighted imaging was performed with a single-shot spin-echo echo-planar pulse sequence (b = 1000 s/mm2). The apparent diffusion coefficient and ratio were also measured.
RESULTS: Spectra for two patients were unacceptable because of either poor shimming conditions or contamination from neighboring fat. Spectra in three of five patients with abscess had lactate, amino acids (including valine, alanine, and leucine), and acetate peaks; one of the three spectra had an additional peak of succinate. In one patient with abscess treated by antibiotics, only lactate and lipid peaks were detected. Spectra for four of seven patients with cystic or necrotic tumors showed only lactate peaks. Lactate and lipids were found in three patients with tumors. Hyperintensity was seen in all the pyogenic abscess cavities and hypointensity in all the cystic and necrotic tumors on diffusion-weighted images.
CONCLUSION: 1H-MRS and diffusion-weighted imaging are useful for differentiating brain abscess from brain tumor, but the latter requires less time and is more accurate than is 1H-MRS. 1H-MRS is probably more limited in cases of smaller peripheral lesions, skull base lesions, and treated abscesses.
Differentiating brain abscesses from cystic or necrotic tumors by CT or MR imaging can be difficult. Difficulties in the diagnosis of intracranial abscess are mainly due to the combination of often unspecified clinical findings and similarities in the morphologic appearance of some intracranial mass lesions, such as cystic gliomas, metastases, and brain abscesses (1, 2). Findings from several studies have suggested that proton MR spectroscopy (1H-MRS) can noninvasively contribute to the establishment of the differential diagnosis between brain tumors and abscesses (3–13).
Diffusion-weighted imaging provides a way to evaluate the diffusion properties of water molecules in tissue and has been used for diseases such as ischemia, tumors, epilepsy, and white matter disorders (14). In recent publications, diffusion-weighted imaging is said to be valuable in the differential diagnosis of abscesses and cystic necrotic tumors (15–18). The aim of this study was to compare 1H-MRS findings with those of diffusion-weighted imaging to determine which technique is more effective in discriminating pyogenic brain abscesses from cystic or necrotic tumors.
Methods
Patient Population
From February 1999 to November 2001, we performed 1H-MRS and diffusion-weighted imaging in 14 patients (10 men and four women; age range, 26–74 years [mean, 55 years]) with necrotic lesions and MR imaging evidence of ring-shaped enhancement after the injection of contrast material; seven patients had tumors, and seven had pyogenic abscesses. The tumors were glioblastomas (three patients), an anaplastic astrocytoma (one patient), metastases (three patients), and primary malignancy, including lung (2) and breast (1) cancer. Surgical or stereotactic biopsies were obtained, and histologic studies performed in all except one case (case 5). In the cases of abscess, bacteriologic analysis was also conducted. None of these lesions appeared hemorrhagic on T1-weighted images.
MR Imaging and Proton MR Spectroscopy
All MR imaging and 1H-MRS studies were performed using a 1.5-T system (Signa; GE Medical Systems, Milwaukee, WI) with a quadrature head coil. The routine imaging studies included multiplanar T1-weighted spin-echo (500/30/2 [TR/TE/NEX]), T2-weighted fast spin-echo (4000/100/2) with an echo train length of 8, and fast fluid-attenuated inversion recovery (9000/133/1; inversion time, 2200 ms) sequences. We used T1- or T2-weighted imaging to locate the voxels for the 1H-MRS studies. The selection of voxel position in the estimated center of the lesion was determined visually by examining the MR images in three orthogonal planes (sagittal, coronal, and axial) to define a 2 × 2 × 2 cm volume of interest. After 1H-MRS was performed, contrast-enhanced T1-weighted images were acquired in all patients.
1H-MRS was applied by using the method of point-resolved spectroscopy. After automated transmitter and receiver adjustment, the signal intensity over the volume of interest was shimmed to within a typical full width at a half maximum of 4 to 8 Hz in all examinations except one (case 6). Optimal water resonance suppression was achieved by irradiation of the water resonance with three chemical shift selective pulse sequences and spoiled gradients. The parameters used were 2000/270, 192 acquisitions, a spectral width of 2500 Hz, and 2048 data points for all patients. In 12 patients (patients 1–4 and 7–14), additional MR spectra were obtained with a TE of 135 to confirm the phase inversion associated with J-coupled metabolites of alanine, lactate, and amino acids, but not of lipids, which may be helpful to discriminate lactate or amino acid signals from lipid signals (5, 8). The acquisition time for each sequence was 7 minutes 54 seconds.
The 1H-MRS data files were transferred to an off-line workstation for postprocessing by using a spectroscopy analysis package according to the following steps: direct current correction, zero filling to 4096 data points, 1.0-Hz exponential apodization, Fourier transformation, and zero-order phase correction. Assignment of resonance peaks for the metabolites was based on previously documented 1H-MRS studies of necrotic brain tumors and brain abscesses (3, 5–13). Resonance peaks were arbitrarily assigned to one of three grades, low (+), medium (++), or high (+++), relative to the peak height of water. The method by which arbitrary peak grades were assigned has been described in detail elsewhere (8).
Diffusion-Weighted Imaging and Apparent Diffusion Coefficient Mapping
Diffusion-weighted imaging was performed after 1H-MRS and before the injection of contrast material. The imaging sequence for diffusion-weighted imaging was single-shot spin-echo echo-planar (10,000/93) with diffusion sensitivities of b = 0 s/mm2 and b = 1000 s/mm2. The diffusion gradients were applied sequentially in three orthogonal directions to generate three sets of axial diffusion-weighted images. Sections (5 mm thick) with 2.5-mm intersection gaps, a 24-cm field of view, and a 128 × 256 matrix were used for all images. The imaging time was 40 seconds. The signal intensity of the cystic or necrotic portion on diffusion-weighted images was defined by visual assessment as markedly low (signal intensity near that of CSF), slightly low (signal intensity between that of CSF and that of normal brain parenchyma), or slightly high, or markedly high compared with normal brain parenchyma. Three readers (P.H.L., W.L.C., H.B.P.) determined findings by consensus.
Analysis of diffusion changes was performed by calculating the apparent diffusion coefficient (ADC), based on the Stejskal and Tanner equation (19), as the negative slope of the linear regression line best fitting the points for b versus ln (SI), where SI is the signal intensity from a region of interest of the images acquired at the two b values. We developed a software package written in Matlab to process the diffusion-weighted images, and ADC maps were generated by performing this calculation on a pixel-by-pixel basis. Measurements of ADC were made in regions of interest in the lesion center and in regions of interest in comparable contralateral regions. Intersubject comparisons were made after computing the ADC ratio of the lesion with that in the control region.
Results
Spectra were of analyzable quality in all except two patients in whom the results were nondiagnostic because of either poor shimming conditions (one with brain stem abscess, case 6) or contamination from neighboring fat (one with abscess in the superficial brain surface close to the calvaria, case 5) (Fig 1
Fig 1.
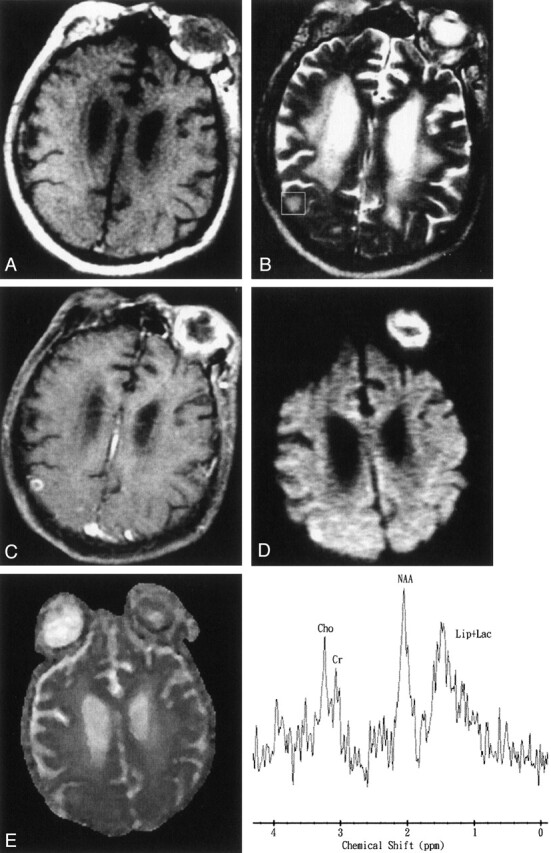
Images obtained in a 69-year-old man with Klebsiella pneumoniae bacteremia, renal abscess, brain abscess, and endophthalmitis of the left eye.
A, Axial T1-weighted image (500/30[TR/TE]) before administration of contrast material.
B, Axial T2-weighted image (4000/100). The 2 × 2 × 2 cm voxel (box) in the lesion, adjacent brain tissue, and neighboring fat represents the 1H-MRS volume of interest.
C, Axial contrast-enhanced T1-weighted MR image (500/30) shows a regular thin-walled ring-enhanced abscess approximately 9 mm in diameter in the superficial brain surface of right parietal region. Endophthalmitis in the left eye shows enhancement after contrast agent administration.
D, Axial diffusion-weighted (10,000/93; b = 1000 s/mm2) image shows marked hyperintensity in the abscess cavity and the left eye.
E, ADC map reveals slight hypointensity, representing restricted diffusion in the corresponding region.
F, In vivo 1H-MR spectrum (2000/270) was unacceptable because of contamination from neighboring fat and a very small lesion. The resonances of choline (Cho), creatine (Cr), and N-acetylaspartate (NAA) were interpreted to be caused by partial volume effects of the adjacent brain tissue. A hump resonance (1–1.5 ppm) was identified, and lactate (Lac) peak contaminated by neighboring fat with a lipid (Lip) peak were suggested. Multiple small peaks at various frequencies are present; these peaks may represent noise or unassigned metabolites.
The characteristics of patients based on the 1H-MRS and diffusion-weighted imaging findings are summarized in the Table. The predominant resonance lines (N-acetylaspartate, choline, and creatine/phosphocreatine) that are usually observed in the parenchyma of the normal brain were hardly detectable in either tumoral or abscess necrosis. In four patients (patients 2, 9, 11, and 13), 10–20% of the volume of interest contained adjacent normal or edematous brain tissues, as estimated from multisection images. 1H-MRS of brain abscess revealed multiple resonance peaks. The main findings were the resonances of amino acids (valine, leucine, and isoleucine) (0.9 ppm), acetate (1.9 ppm), alanine (1.5 ppm), and lactate (1.3 ppm) identified in four of the five patients (patients 1–4) with abscesses that were analyzed (Fig 2). A resonance peak for succinate (2.4 ppm) was also detected in patient 2. Only resonances of lactate and lipid were found at 1H-MRS in patient 7, who had an abscess occurring 35 days after beginning antibiotic treatment (Fig 3). Spectra in four of seven patients (patients 8, 9, 11, and 14) with cystic or necrotic tumor showed only the peak attributed to lactate (Fig 4). Lactate and lipid were found in three patients (patients 10, 12, and 13) with tumor.
TABLE 1:
1H-MRS and diffusion-weighted imaging findings in 14 patients with brain abscess or tumor
| Case No. | Age (y)/Sex | Diagnosis | Metabolites Detected | Signal Intensity on Diffusion-Weighted Image |
|---|---|---|---|---|
| 1 | 50/M | Brain abscess | Ace(+++), Ala(++), AA(+++), Lac(+++) | Markedly high |
| 2 | 44/M | Brain abscess | Ace(+++), Succ(++), Ala(++), AA(++), Lac(++), NAA(+), Cho(+), Cr/PCr(+) | Markedly high |
| 3 | 58/F | Brain abscess | Ace(+++), Ala(++), AA(+), Lac(++) | Markedly high |
| 4 | 26/F | Brain abscess | Ace(+++), Ala(++), AA(+), Lip(+), Lac(++) | Markedly high |
| 5 | 69/M | Brain abscess | * | Markedly high |
| 6 | 48/M | Brain stem abscess | ** | Markedly high |
| 7 | 45/M | Brain abscess | Lip(++), Lac(+) | Markedly high |
| 8 | 63/M | Glioblastoma | Lac(+++) | Markedly low |
| 9 | 74/M | Glioblastoma | Lac(++), NAA(+), Cho(+++), Cr/PCr(+) | Markedly low |
| 10 | 58/F | Glioblastoma | Lip(+), Lac(++) | Slightly low |
| 11 | 61/M | Anaplastic astrocytoma | Lac(+++), NAA(+), Cho(+++), Cr/PCr(+) | Markedly low |
| 12 | 52/M | Metastatic brain tumor | Lip(+), Lac(++) | Markedly low |
| 13 | 55/F | Metastatic brain tumor | Lip(+), Lac(++), NAA(+), Cho(+++), Cr/PCr(+) | Markedly low |
| 14 | 67/M | Metastatic brain tumor | Lac(+++) | Markedly low |
Note.—M indicates male; F, female; +, small peak; ++, moderate peak; +++, large peak; Ace, acetate; Ala, alanine; AA, amino acids; Lac, lactate; Succ, succinate; NAA, N-acetylaspartate; Cho, choline; Cr, creatine; PCr, phosphocreatine; Lip, lipids; *, unacceptable because of contamination from neighboring fat; **, unacceptable because of poor shimming conditions.
Fig 2.

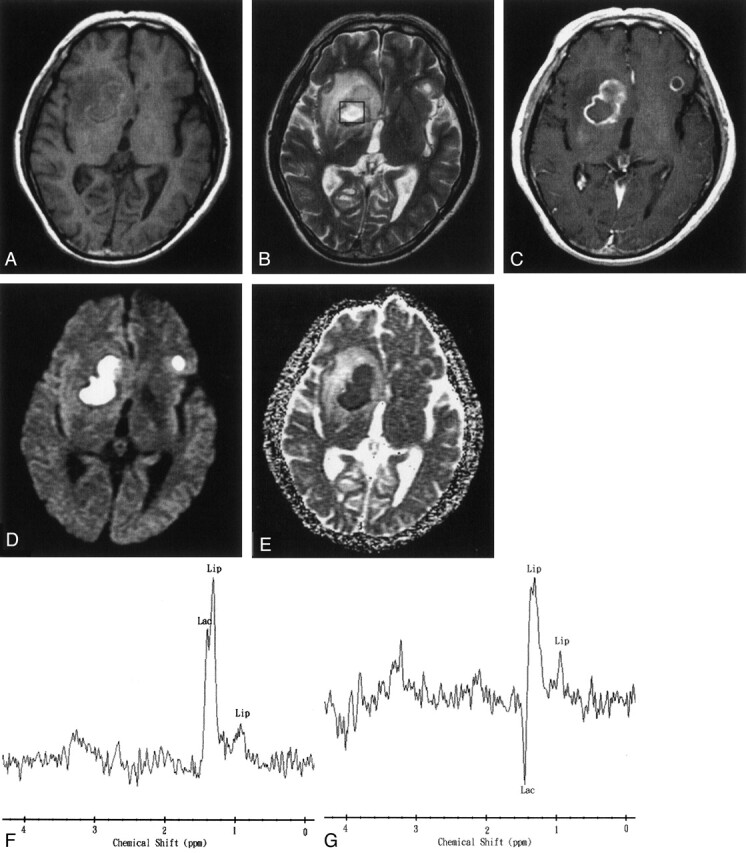
Images obtained in a 50-year-old man with surgically proven pyogenic brain abscess in the right basal ganglion.
A, Axial T1-weighted image (500/30) before administration of contrast material.
B, Axial T2-weighted image (4000/100). The 2 × 2 × 2 cm voxel (box) in the center of the lesion represents the 1H-MRS volume of interest.
C, Axial contrast-enhanced T1-weighted (500/30) MR image shows a ring-shaped cystic lesion and surrounding edema.
D, Axial diffusion-weighted (10,000/93; b = 1000 s/mm2) image shows marked hyperintensity in the abscess cavity and slight iso- to hypointensity surrounding the edema.
E, ADC map reveals hypointensity in the abscess cavity, representing restricted diffusion, and hyperintense areas surrounding the edema.
F and G, In vivo 1H spectra (2000/270 and 135) from the abscess cavity show resonances representing acetate (Ac), alanine (Ala), lactate (Lac), and amino acids (AA). At a TE of 135 (G), the phase reversal resonances are well depicted at 1.5, 1.3, and 0.9 ppm, which confirms the assignment to alanine, lactate, and amino acids, respectively.
Fig 3.
Images obtained 35 days after the start of initial antibiotic treatment in a 45-year-old man with multiple pyogenic brain abscesses.
A, Axial T1-weighted image (500/30) before administration of contrast material.
B, Axial T2-weighted image (4000/100). The 2 × 2 × 2 cm voxel (box) represents 1H-MRS volume of interest.
C, Axial contrast-enhanced T1-weighted (500/30) MR image shows two ring-shaped enhanced lesions in the right basal ganglion and left frontal lobe.
D, Axial diffusion-weighted (10,000/93; b = 1000 s/mm2) image shows markedly high signal intensity in the abscess cavity and slightly iso- to hypointense surrounding edema.
E, ADC map reveals low signal intensity in the abscess cavity, representing restricted diffusion, and hyperintense areas surrounding the edema.
F and G, In vivo 1H spectra (2000/270 and 135) from the abscess cavity show a lactate (Lac) peak (1.3 ppm) that is inverted at a TE of 135 and a lipid (Lip) peak (0.8–1.2 ppm). Note the similarity of this spectral pattern to that of a necrotic brain tumor.
Fig 4.
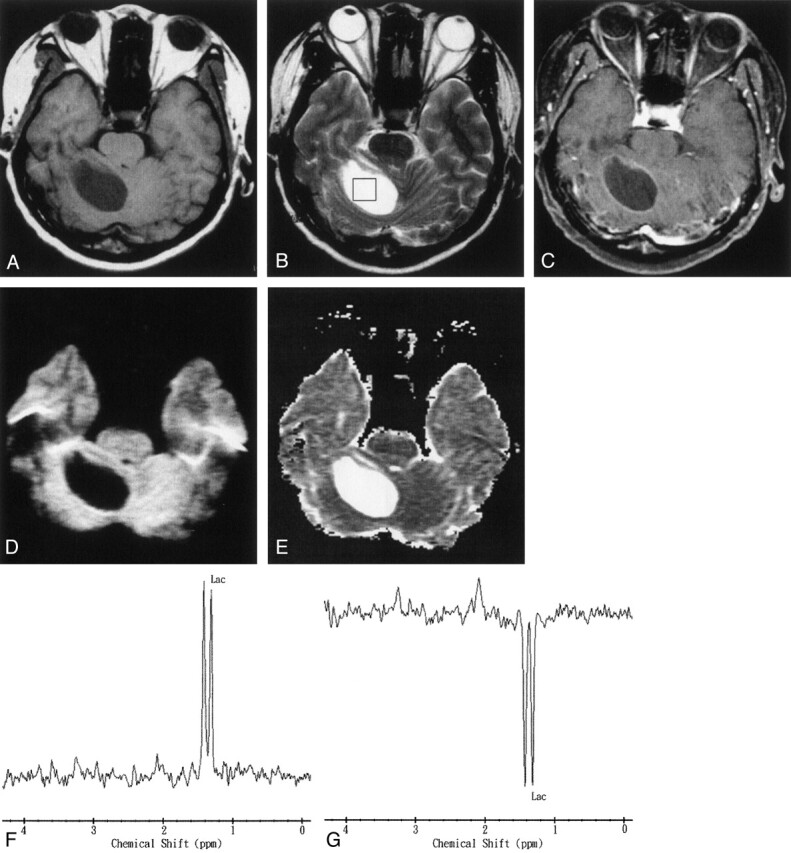
Images obtained in a 67-year-old man with a pathologically proven right cerebellar metastasis from primary lung adenocarcinoma.
A, Axial T1-weighted image (500/30) before administration of contrast material.
B, Axial T2-weighted image (4000/100). The 2 × 2 × 2 cm voxel (box) in the center of the lesion represents the 1H-MRS volume of interest.
C, Axial contrast-enhanced T1-weighted (500/30) MR image shows a ring-enhanced lesion in the right cerebellum.
D, Axial diffusion-weighted (10,000/93; b = 1000 s/mm2) image shows markedly low signal intensity in the necrotic part of the tumor.
E, ADC map reveals high signal intensity in the necrotic part of the tumor that is similar to that of CSF, reflecting marked diffusion.
F and G, In vivo 1H spectra (2000/270 and 135) from the necrotic center of the tumor show a lactate (Lac) peak at 1.3 ppm that is inverted at a TE of 135.
All pyogenic abscesses were hyperintense on high diffusion-weighted images and had low ADC values compared with those in normal-appearing brain (Figs 1–3). The ADC value and ADC ratio were 0.67 ± 0.17 × 10⁻³ mm2/s (mean ± SD) and 0.65, respectively. All tumors were hypointense on diffusion-weighted images of the cystic or necrotic area (Fig 4), and their cystic or necrotic areas had high ADC values (2.73 ± 0.34 × 10⁻³ mm2/s, mean ADC ratio = 3.53). The ADC value of the CSF was 3.63 ± 0.30 × 10⁻³ mm2/s. The ADC values of the gray and white matter were 0.85 ± 0.13 × 10⁻³ mm2/s and 0.8 ± 0.13 × 10⁻³ mm2/s, respectively.
Discussion
Diagnosis of a brain abscess is usually made on the basis of neuroimaging findings (eg, CT and MR imaging findings) and clinical examination. The neuroimaging appearance of some cystic or necrotic tumors is similar to that of brain abscesses. The medical management strategies for abscess and neoplasm are different. Correct diagnosis must be obtained before treatment of cystic brain lesions, which involves surgical procedures, can begin. 1H-MRS and diffusion-weighted imaging are said to be valuable in the differential diagnosis of abscesses and cystic necrotic tumors (3–13, 15–18). It is therefore important to compare the value of 1H-MRS with that of diffusion-weighted imaging for discriminating brain abscesses from cystic or necrotic tumors.
All cystic tumors and abscesses in our study showed findings of increased lactate, which is a nonspecific metabolite that results from anaerobic glycolysis (5, 6, 8–11). All cystic and necrotic tumors except three (one glioblastoma and two metastases) had lactate signal of variable peak height (Fig 4). In three cases, lactate and lipid signals were observed. The specific spectrum of the abscess cavity, illustrated by the case of patient 1 (Fig 2), shows elevation of acetate, succinate, and some amino acids, as well as lactate, and this spectrum appears to be significantly different from the spectra of cystic or necrotic brain tumors. Our results agree with those of previous studies (5–12). Increases in lactate, acetate, and succinate presumably originate from the enhanced glycolysis and fermentation of the infecting microorganisms (5–12). Amino acids such as valine and leucine are known to be the end products of proteolysis by enzymes released by neutrophils in pus (5–12).
Discrimination between amino acids (ie, valine, leucine, and isoleucine at 0.9 ppm) and lipid (at 0.8–1.2 ppm) is important, because lipid signals may exist in both brain tumors and abscesses, whereas amino acids are not seen in the in vivo proton MR spectra of brain tumors and are detectable only in vitro (7). It is known that with a TE of 135, phase inversion occurs as a result of J-coupling between lactate and amino acid, but not in lipid, a feature which may be helpful, along with the presence or absence of acetate or succinate, in differentiating brain abscess from tumor (5, 8) (Fig 2). The 1H-MRS results in four patients (patients 1–4), including one patient (patient 2) who was placed on antibiotics for only 2 days and others who were examined by 1H-MRS before the start of therapy, confirm the specific spectral pattern of brain abscess reported previously (5–10, 12). However, the failure of 1H-MRS to depict all specific abscess metabolites in patient 7, who had been treated with antibiotics 35 days before the first 1H-MRS examination, might show that spectral specificity is valid only for untreated abscesses or abscesses at the start of treatment. The findings of lactate and lipid peaks after treatment in patient 7 were nonspecific (Fig 3) and can be easily missed in patients with cystic or necrotic tumors, which are similar in morphologic appearance to brain abscesses. Although the number of cases we analyzed is small, our conclusion is supported by recently published studies presented by Dev et al (11) and Burtscher and Holtas (13). Dev et al reported a decline of the acetate and pyruvate in five patients after 1 week of aspiration and medical treatment. They think that the disappearance of metabolites of bacterial origin suggests a positive response to therapy. Burtscher and Holtas showed a dramatic change in the findings of follow-up 1H-MRS examination of abscesses occurring 29 and 113 days after beginning antibiotic treatment. All resonances (representing succinate, acetate, alanine, and amino acids), except that of lactate, had disappeared. That these spectral changes disappear with effective antibiotic treatment, as shown in previous studies as well as in our study, emphasizes the need for the neuroradiologist or spectroscopist interpreting the spectra to be aware of the case history. It is also important that the1H-MRS examinations be performed as early as possible, preferably before the start of antibiotic therapy. Knowledge of the expected spectral changes after treatment also offers the possibility of evaluating the effectiveness of nonsurgical treatment of brain abscesses. Further prospective studies with a large number of cases will be necessary to thoroughly evaluate the particular spectral peaks and the time course of the spectral changes observed with antibiotic treatment.
Diffusion-weighted imaging to distinguish between brain abscesses and cystic or necrotic brain tumors has been reported to be useful in several publications (15–18). In 1996, Ebisu et al (15) first reported a case of brain abscess with high signal intensity on diffusion-weighted images. The pus consistency itself could account for the restricted diffusion and therefore high diffusion-weighted imaging signal intensity. Subsequent studies showed the same result (16–18). The pyogenic brain abscesses in our study were in good agreement with the findings of these previous studies (Figs 1 and 2). High signal intensity of the abscess cavity on diffusion-weighted images was still noted in patient 7, despite 35 days of treatment with antibiotics (Fig 3). The ADC ratios for all pyogenic abscesses ranged from 0.45 to 0.8. This variation might be related to a difference in the concentration of inflammatory cells, and differences in necrotic tissue debris, bacteria, and viscosity of abscess fluid (16–18). Little doubt exists regarding the identification of the cystic or necrotic portion of the tumors, which are revealed by low signal intensity on diffusion-weighted images and a higher ADC value (15–18) (Fig 4).
Nevertheless, contrasting diffusion-weighted imaging studies of cystic or necrotic tumors still exist in the literature (20–21). Park et al (20) reported two cases of cystic or necrotic brain metastasis with markedly high signal intensity on diffusion-weighted images. Surgery revealed that the cyst had a thick and creamy necrotic content similar to pus. Holtas et al (21) reported a ring-enhanced brain metastasis with hyperintensity on diffusion-weighted images and a low ADC value in the necrotic part of the tumor. The reason for restricted diffusion was possibly early necrosis with intracellular edema of the lesions (21). The initial results of our brain abscesses–necrotic tumor comparison by diffusion-weighted imaging and 1H-MRS indicated that although the case number examined by both techniques was small, diffusion-weighted imaging was the more practical and accurate method. Several reasons support this conclusion. First, the diffusion-weighted imaging time is very short (40 seconds in our study). 1H-MRS is more time consuming: single-voxel 1H-MRS takes approximately several minutes and 2D chemical shift imaging takes approximately 10 minutes, depending on parameters used. Diffusion-weighted imaging is more practical in clinical use, especially in emergent situations. Second, single-voxel 1H-MRS (even with chemical shift imaging) is more limited in voxel size from 1.5 × 1.5 × 1.5 cm to 2 × 2 × 2 cm than is diffusion-weighted imaging, and the smaller lesion viewed by 1H-MRS will be more affected by the partial volume effect. Although 2D chemical shift imaging may have a smaller voxel than the single voxel technique in the case of small lesions, it is still more time consuming. If the lesion is located peripherally, images of the lesion produced by either single-voxel 1H-MRS or 2D chemical shift imaging might be contaminated by the effect of neighboring fat. Third, we had one case of a hyperintense pyogenic abscess (Fig 3, patient 7) on diffusion-weighted images, but 1H-MRS examination showed only lactate-lipid peaks (no amino acid peak [end-products of bacterial breakdown]), which is the same spectrum (only lactate-lipid peaks) that is found in cases of necrotic tumor. The results reported by Burtscher and Holtas (13), involving a case of abscess that had been treated by high-dose antibiotics, were similar to ours. Our patient had already received antibiotic treatment before undergoing 1H-MRS and diffusion-weighted imaging.
Conclusion
Diffusion-weighted imaging and 1H-MRS are useful as additional imaging techniques for establishing the differential diagnosis between brain abscesses and cystic or necrotic brain tumors. Diffusion-weighted imaging in the discrimination between brain abscesses and necrotic tumors requires less imaging time and is more accurate than 1H-MRS; the latter is probably more limited in the cases of smaller peripheral lesions, skull base lesions, and treated abscesses. There are, however, some conflicting reports in the literature regarding diffusion-weighted imaging, so the combination of 1H-MRS and diffusion-weighted imaging may improve results compared with the use of only a single technique to differentiate between brain abscesses and cystic or necrotic brain tumors.
Acknowledgments
We express our gratitude to our colleagues from the Departments of Radiology, Neurosurgery, Neurology, and Pathology, Veterans General Hospital-Kaohsiung, Kaohsiung, Taiwan. We thank Sam Ding, PhD, for helpful comments regarding 1H-MRS.
Footnotes
Supported by NCS grant 91-2314-B-0758-008.
References
- 1.Lau DW, Klein NC, Cunha BA. Brain abscess mimicking brain tumor. Heart Lung 1989;18:634–637 [PubMed] [Google Scholar]
- 2.Mamelak AN, Mampalam TJ, Obana WG, Rosenblum ML. Improved management of multiple brain abscesses: a combined surgical and medical approach. Neurosurgery 1995;36:76–85 [DOI] [PubMed] [Google Scholar]
- 3.Demaerel P, Van Hecke P, Van Oostende S, et al. Bacterial metabolism shown by magnetic resonance spectroscopy. Lancet 1994;344:1234–1235 [DOI] [PubMed] [Google Scholar]
- 4.Harada M, Tanouchi M, Miyoshi H, Nishitani H, Kannuki S. Brain abscess observed by localized proton magnetic resonance spectroscopy. Magn Reson Imaging 1994;12:1269–1274 [DOI] [PubMed] [Google Scholar]
- 5.Remy C, Grand S, Lai ES, et al. 1H MRS of human brain abscess in vivo and in vitro. Magn Reson Med 1995;34:508–514 [DOI] [PubMed] [Google Scholar]
- 6.Poptani H, Gupta RK, Jain VK, Roy R, Pandey R. Cystic intracranial mass lesions: possible role of in vivo MR spectroscopy in its differential diagnosis. Magn Reson Imaging 1995;13:1019–1029 [DOI] [PubMed] [Google Scholar]
- 7.Grand S, Lai ES, Esteve F, et al. In vivo 1H MRS of brain abscesses versus necrotic brain tumors. Neurology 1996;47:846–848 [DOI] [PubMed] [Google Scholar]
- 8.Kim SH, Chang KH, Song IC, et al. Brain abscess and brain tumor: discrimination with in vivo H-1 MR spectroscopy. Radiology 1997;204:239–245 [DOI] [PubMed] [Google Scholar]
- 9.Martinez-Perez I, Moreno A, Alonso J, et al. Diagnosis of brain abscess by magnetic resonance spectroscopy. J Neurosurg 1997;86:708–713 [DOI] [PubMed] [Google Scholar]
- 10.Chang KH, Song IC, Kim SH, et al. In vivo single voxel proton MR spectroscopy in intracranial cystic masses. AJNR Am J Neuroradiol 1998;19:401–405 [PMC free article] [PubMed] [Google Scholar]
- 11.Dev R, Gupta RK, Poptani H, Roy R, Sharma S, Husain M. Role of in vivo proton magnetic resonance spectroscopy in the diagnosis and management of brain abscesses. Neurosurgery 1998;42:37–43 [DOI] [PubMed] [Google Scholar]
- 12.Grand S, Passaro G, Ziegler A, et al. Necrotic tumor versus brain abscess: importance of amino acids detected at 1H MR spectroscopy: initial results. Radiology 1999;213:785–793 [DOI] [PubMed] [Google Scholar]
- 13.Burtscher IM, Holtas S. In vivo proton MR spectroscopy of untreated and treated brain abscesses. AJNR Am J Neuroradiol 1999;20:1049–1053 [PMC free article] [PubMed] [Google Scholar]
- 14.Rowley HA, Grant PE, Roberts TP. Diffusion MR imaging: theory and applications. Neuroimaging Clin N Am 1999;9:343–361. [PubMed] [Google Scholar]
- 15.Ebisu T, Tanaka C, Umeda M, et al. Discrimination of brain abscess from necrotic or cystic tumors by diffusion-weighted echo planar imaging. Magn Reson Imaging 1996;14:1113–1116 [DOI] [PubMed] [Google Scholar]
- 16.Kim YJ, Chang KH, Song IC, et al. Brain abscess and necrotic or cystic brain tumor: discrimination with signal intensity on diffusion-weighted MR imaging. AJR Am J Roentgenol 1998;171:1487–1490 [DOI] [PubMed] [Google Scholar]
- 17.Noguchi K, Watanabe N, Nagayoshi T, et al. Role of diffusion-weighted echo-planar MRI in distinguishing between brain abscess and tumour: a preliminary report. Neuroradiology 1999;41:171–174 [DOI] [PubMed] [Google Scholar]
- 18.Desprechins B, Stadnik T, Koerts G, Shabana W, Breucq C, Osteaux M. Use of diffusion-weighted MR imaging in differential diagnosis between intracerebral necrotic tumors and cerebral abscesses. AJNR Am J Neuroradiol 1999;20:1252–1257 [PMC free article] [PubMed] [Google Scholar]
- 19.Stejskal EO, Tanner JE. Spin diffusion measurement: spin echoes in the presence of a time-dependent field gradient. J Chem Physics 1965;42:288–292 [Google Scholar]
- 20.Park SH, Chang KH, Song IC, Kim YJ, Kim SH, Han MH. Diffusion-weighted MRI in cystic or necrotic intracranial lesions. Neuroradiology 2000;42:716–721 [DOI] [PubMed] [Google Scholar]
- 21.Holtas S, Geijer B, Stromblad LG, Maly-Sundgren P, Burtscher IM. A ring-enhancing metastasis with central high signal on diffusion-weighted imaging and low apparent diffusion coefficients. Neuroradiology 2000;42:824–827 [DOI] [PubMed] [Google Scholar]