

Abstract
BACKGROUND AND PURPOSE: The options for treating giant fusiform basilar aneurysms are limited, and the potential impact of planned interventions is difficult to assess. We developed a computational framework to evaluate the impact that interventions might have on hemodynamic conditions.
METHODS: A computational fluid dynamics approach was used to determine the velocity field, wall shear stress, and pressure distribution within a model of a basilar artery before and after a simulated occlusion of one vertebral artery. The vascular geometry in a patient with a giant fusiform basilar artery aneurysm was determined by using contrast-enhanced MR angiography, and the numerical simulation approach was used to calculate the flow fields in the presenting geometry and to predict the flow field that would occur if a vertebral artery were occluded.
RESULTS: In the model geometry, computational fluid dynamics indicated that there would be a symmetric flow pattern with a strong central stream and large recirculation zones at the walls. After simulated occlusion of one vertebral artery, the primary stream was diverted to one side, resulting in high pressure and increased wall shear stress. For the patient-specific geometry, flow patterns were shown to depend strongly on how much flow there was in each vertebral artery.
CONCLUSION: Contrast-enhanced MR angiography is an effective tool for demonstrating the luminal boundaries of large intracranial aneurysms. Computational fluid dynamics is a powerful tool for determining the prevailing flow conditions in vascular territories and for modeling the possible alterations of the flow field that would result from interventional treatments.
Despite many advances in the therapy of cerebral aneurysms (1), a small but significant number of these aneurysms cannot be adequately controlled with conventional surgical or endovascular techniques. Aneurysms that defy conventional treatment are typically large (10–25 mm in diameter) or giant (>25 mm in diameter) aneurysms (2). Giant aneurysms represent 3–5% of all cerebral aneurysms in general neurosurgical populations (3–5). Untreated giant intracranial aneurysms present a high risk of hemorrhage, progressive neurologic deficits from cerebral compression, or distal thromboembolism, causing stroke and death (4, 6–9). The mortality rate of untreated giant aneurysms reported by Peerless et al (9) was 68% after 2 years and 85% after 5 years. All survivors had marked neurologic dysfunction. In a recent study, one-third of the patients exhibited symptoms and signs of mass effect and neural compression that reflected the location of the aneurysm (10).
Fusiform aneurysms are particularly difficult to treat. They cannot be coiled, and stent placement often presents the danger of occluding vital branching arteries, especially in the posterior circulation (10). One possible treatment is to attempt to reduce the hemodynamic forces acting on the aneurysm by sacrificing a proximal supplying artery. Clinicians have little or no quantitative guidance in selecting this treatment option.
To overcome this limitation, we use MR angiography to determine aneurysm geometry and MR velocimetry to quantify flow; we then apply computational fluid dynamics approaches to determine the pressure and shear stresses on the aneurysm wall. The purpose of this study was to use computational modeling to derive biophysical parameters affecting cerebral aneurysms from data collected from conventional MR techniques, and to examine possible effects of surgical intervention.
Methods
Computational modeling of the velocity field in the vasculature requires a prescription of the luminal surface geometry and flow velocities through the inlet and outlet branch vessels. This study comprised two sets of simulations. In the first, an idealized geometry and boundary flow velocities were used to predict hemodynamics in a fusiform basilar aneurysm before and after a simulated occlusion of one vertebral artery. The second set of simulations was an investigation for an actual patient-derived anatomy and boundary flow velocities that were measured in vivo. In the idealized case, the boundary conditions were schematically modeled to provide a representative geometric configuration and flow values. In the patient study, the luminal boundaries were determined by using contrast-enhanced MR angiography, and flow velocities were determined by using phase-contrast MR imaging methods.
In both settings, a computational fluid dynamics program that was developed in-house was used. The computational scheme used is an artificial compressibility method, and the governing Navier-Stokes equations are solved by using a structured mesh (11). The program uses an artificial compressibility scheme that incorporates a first-order pseudotime derivative of pressure in the continuity equation and simplifies the iteration process at each time step. The time-marching of the solution in the pseudotime domain gives a steady flow solution. Pulsatile flow solution is obtained by implementing physical time derivatives of velocity. The numerical scheme is of third-order accuracy in space and of second-order accuracy in time. The simulation package has previously been used to simulate laminar incompressible flows in a three-dimensional carotid artery bifurcation and a basilar tip aneurysm (11). It is robust, providing stable performance in calculating flow solutions. Although the program is capable of evaluating pulsatile flow, for simplicity we present here the results for one steady flow solution near peak systole, as this is representative of the flow conditions that manifest in these cases.
In all cases, the geometry under consideration is distal to the vertebral junction. Proximal to that junction, the vertebral arteries have a long, relatively straight course, and our inlet flow was modeled as fully developed parabolic flow, an assumption that is consistent with profiles measured in vivo by using MR velocimetry. Since the outlet flow velocities can be measured in vivo by using MR velocimetry, the outlet boundary condition was specified by adjusting the pressure at the outlet to achieve the measured flow rate.
Schematic Geometry
To obtain a reference model for evaluating the effect of occlusion of one vertebral artery on flow through a fusiform basilar aneurysm, the geometry shown in Fig 1A was specified. Computational fluid dynamics calculations were then performed for that geometry, assuming equal flow in each vertebral artery (Fig 1B). The effect of occluding one vertebral artery was then modeled. To predict the hemodynamics that would follow occlusion of a vertebral artery, the redistribution of flow through the great vessels of the neck must be taken into account. This was achieved by using a network model that accounts for all possible collateral pathways. A large-scale model of the cerebral vasculature described by Quick et al (12) predicts that occlusion of a vertebral artery would decrease basilar flow to 91% of baseline. The inlet flow of one vertebral artery was therefore set to zero and that of the other vertebral artery was set to 182% of baseline, and the corresponding velocity field was calculated (Fig 1C).
Fig 1.

Computational fluid dynamics results in a schematic model of a giant basilar aneurysm.
A, Coronal projection of the schematic geometry shows a spherical aneurysm just distal to the vertebral junction.
B, Equal inlet flow in both vertebral arteries. Velocity field in the coronal plane shows the highest velocities in the center of the vessels and slow recirculating flow (blue) on the walls of the aneurysm. Also shown is a transverse plane through the center of the aneurysm (arrow).
C, Simulated occlusion of one vertebral artery (arrowhead). Velocity stream is diverted to the aneurysm wall (arrow) ipsilateral to the simulated occluded vessel.
Patient-Specific Geometry
Patients who were known to have a fusiform basilar aneurysm were recruited to this study. All subjects gave informed consent after the local institutional review board approved the procedures. Herein, we report on the evaluation of one of the subjects that was studied.
Contrast-enhanced MR angiography was used to identify the location and morphology of the aneurysm. The patient was positioned in the magnet, and a contrast agent was injected into the antecubital vein by using a power injector (Medrad, Pittsburg, PA). A total of 30 mL of Gadolinium-DTPA (Nycomed, Princeton, NJ) was injected at 2.5 mL/s, followed by a 10-mL flush of saline to clear the line. Fluoroscopic real-time images were acquired, and the full MR angiographic study (parameters provided below) was initiated when arrival of contrast material in the great vessels of the neck was visually identified.
A 3D volume was selected to encompass the anatomy of interest with a 240-mm field of view by using a 46.8-mm-thick coronal slab with a 400 × 380 × 39 matrix zero-filled to 512 × 512 × 78. The resultant images had acquired resolution of 0.6 × 0.63 × 1.2 mm and were interpolated to 0.47 × 0.47 × 0.6 mm. Maximum intensity projections were obtained from multiple viewing angles on volumes that were selected to closely conform to the volume of interest and to eliminate confounding vessels. For modeling purposes, geometries of vascular territories of interest were extracted from the high-spatial-resolution 3D MR angiograms. The high-spatial-resolution MR images were converted to binary images. Each image section was fitted with rational splines, followed by fitting in the longitudinal direction. Although some smoothing occurs, the extracted geometry possesses the important principal geometric features of the original images.
Flow velocities were extracted from phase-contrast MR imaging. The section level of interest was determined from a 3D MR angiographic study that identified vessel segments with a relatively uniform cross-section and a straight course. A thin, 4-mm section was oriented transverse to the axis of the vessel, as determined from two orthogonal views. A velocity-encoded phase-contrast study was acquired with pixel dimensions of 0.8 × 0.8 mm, by using a velocity encoding value of 90 cm/s. Cardiac triggering was used, with electrocardiographic leads. Velocity measurements were acquired at 15 phases through the cardiac cycle. Velocity encoding was applied along the section-select direction only, providing an estimate of through-plane flow. Postprocessing provides flow velocities on a pixel-by-pixel basis, and these were averaged to provide the mean flow through the vessel (Fig 2).
Fig 2.

A and B, Phase-contrast MR images acquired transverse to the carotid (A) and basilar (B) arteries.
C, Velocity waveform shows mean flow through the basilar artery during one cardiac cycle.
Computational fluid dynamics modeling was performed for the specific geometry and flow conditions that were determined from the patient study. The calculated velocity field is shown in Fig 3A, and the distribution of pressure is shown in Fig 3B.
Fig 3.

Computational fluid dynamics results in the patient-specific geometry with velocity boundary conditions as determined in vivo by MR velocimetry.
A, Calculated velocity field (m/s). Note highly asymmetric flow secondary to near occlusion of the right vertebral artery. There is a large region of slow recirulating flow (blue) in the pouch of the aneurysm.
B, Calculated distribution of pressure (range from 0 to 150 pascal). The pressure distribution has no regions of pronounced increased pressure, with a smooth drop from inlet to outlet vessels.
Results
Schematic Geometry
For the geometry of a representative fusiform basilar aneurysm with symmetric inflow, the velocity of flow was high in the center of the basilar aneurysm, but low near the walls of the aneurysm itself (shown as blue in Fig 1B). Occluding one of the vertebral arteries was predicted to significantly alter the flow distribution (Fig 1C). A pronounced shift in the flow velocities was noted in the aneurysm itself, increasing velocities along one wall of the aneurysm and decreasing velocities along the other. This redirection of flow increased pressure along one wall of the aneurysm (specifically at the impinging site).
Alteration in wall shear stress was also predicted (Fig 4) after occlusion. The shear stresses in the basilar and vertebral arteries were of similar magnitude before occlusion, and the shear stress on the aneurysm wall was low before occlusion because the lateral aspects of the aneurysm were filled with relatively slowly recirculating blood. After occlusion, the shear stress increased at the vertebral junction and at the site of impingement by a factor of about three.
Fig 4.

Calculated wall shear stress along the lateral side of the vertebrobasilar system shown in Fig 1. The variable S is the distance measured along the outside wall, which includes the vertebral artery to be occluded. Shear stress is shown for symmetric inflow (solid line) and for simulated occlusion of the ipsilateral vertebral artery (dotted line).
Patient-Specific Geometry
Contrast-enhanced MR angiograms depicted a large fusiform aneurysm in a patient who also had a stenotic vertebral artery (Fig 5). Phase-contrast MR velocimetry determined that the stenotic vertebral artery was severely hemodynamically compromised and that there was approximately 20 times greater flow through the contralateral vertebral artery.
Fig 5.
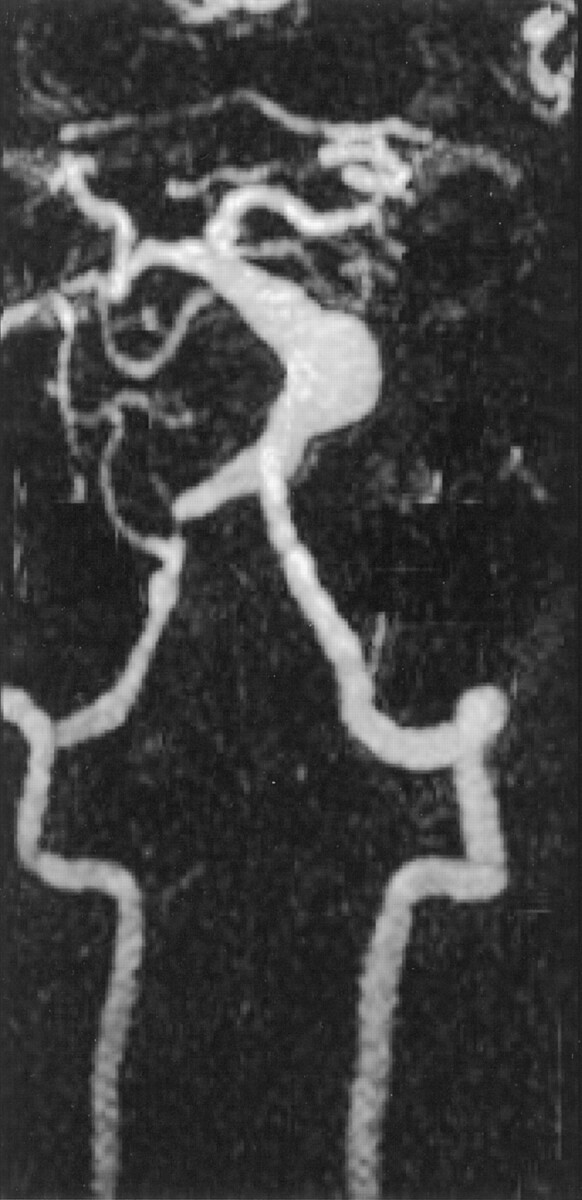
Coronal maximum intensity projection of a contrast-enhanced MR angiographic study in a patient with a fusiform basilar aneurysm. The vertebral and basilar arteries have been selected from the full data set. Also noted is a stenosis of the right vertebral artery.
Computational fluid dynamics simulation showed that, in this case, most flow was carried in a stream along the basilar wall on the side of the stenotic vertebral artery (Fig 3A). The aneurysm was filled with a large volume of slowly recirculating blood. The distribution of pressure through the vertebrobasilar system was not predicted to have any large local values (Fig 3B).
Variation of Flow Boundary Conditions
Generally, flow through stenotic vessels remains relatively constant until the resistance of the stenosis exceeds that of other resistive components that are in series with the stenosis. At that point, the stenosis becomes a hemodynamically significant lesion, and further increases in stenosis lead to a rapid drop in flow through the stenotic vessel. An example of this is shown in Fig 6. Computational fluid dynamics methods allowed us to examine the effects of perturbations of the inlet flow conditions on the overall flow patterns within the aneurysmal geometry. In particular, it was informative to consider what the flow conditions might have been if the stenosis had begun to form but had not yet substantially changed the volume flow so that the volume flow through both vertebral arteries remained approximately equal (corresponding to a 70% stenosis in Fig 6)
Fig 6.

Plots of changes in velocity (dashed line) and volume flow (solid line) that are predicted by theory in response to increasing stenosis. Note that conservation of flow predicts a velocity increase for relatively small increases in stenosis, but that volume flow only starts to drop appreciably once the stenosis becomes hemodynamically limiting (ie, after the stenosis exceeds approximately 70%).
Symmetric Vertebral Flow
We prescribed equal volume flow through each vertebral artery at a flow rate of 1 mL/s. The flow velocity distribution and the pressure distribution are shown in Fig 7. The distribution of wall shear stress on the surface of the flow lumen is shown in projection onto the coronal plane in Fig 8.
Fig 7.

Computational fluid dynamics results in the patient-specific geometry assuming that there is an equal flow rate through the vertebral arteries.
A, Calculated velocity field (m/s). A high velocity jet is predicted through the stenotic vertebral artery impinging on the wall of the aneurysm. Flow reciruclation is noted on both sides of the jet.
B, Calculated distribution of pressure (range from 0 to 150 pascal). The pressure distribution shows a region of pronounced elevation of pressure on the outside wall of the aneurysm.
Fig 8.
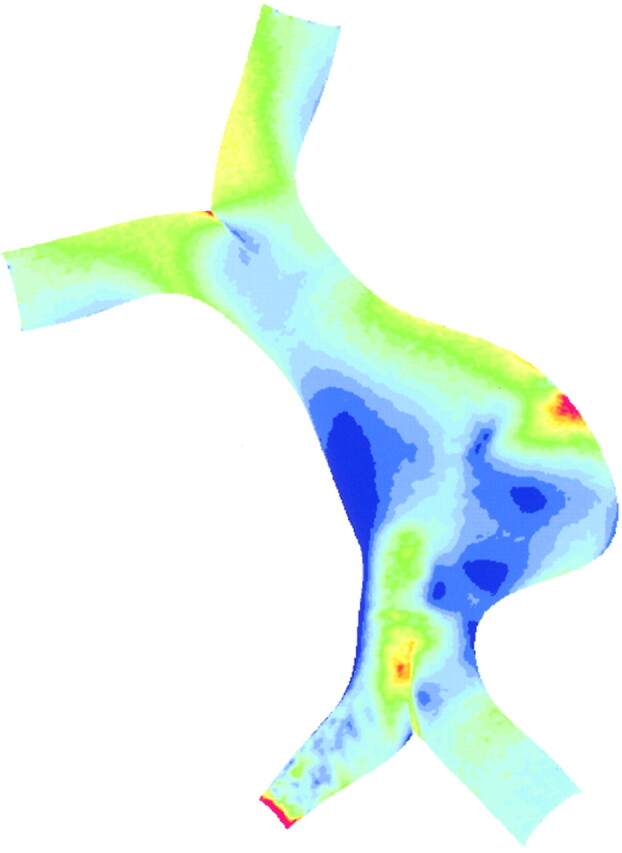
Wall shear values calculated for the patient-specific geometry assuming equal flow rate through the vertebral arteries. Wall shear stress ranges from 0 to 5 pascal. A region of high wall shear stress is predicted adjacent to the site of impingement of the flow jet noted in Fig 7A.
When the inlet flow conditions were altered to simulate the flow that might have prevailed before the vertebral stenosis became hemodynamically limiting, numerical simulation showed a very different hemodynamic picture. A high velocity jet from the stenotic vertebral artery impinged on the far basilar wall (Fig 7A), resulting in a region of localized increased pressure on the aneurysm wall (Fig 7B). The region of slow recirculating flow previously located within the aneurysm was displaced by the flow jet to the side of the basilar trunk proximal to the stenotic vertebral artery. A high-pressure zone distal to the vertebral junction caused by the merging of flow from the two vertebral branches (Fig 7B) was also noted. Similarly, evaluation of the wall shear data also indicated a region of increased wall shear stress close to the impingement site (Fig 8).
Discussion
Computational fluid dynamics can be used in conjunction with MR angiography and MR velocimetry to predict noninvasively the distribution of hemodynamic forces in vascular structures. Computational fluid dynamics provides detailed flow field and wall shear stress information. This approach can also be used to simulate the effects of different interventions that might be used for treating vascular disorders.
MR imaging provides powerful methods for collecting 3D data sets of vascular anatomy and in particular of the aneurysm luminal surface. A number of MR angiographic methods are available for evaluating the intracranial vasculature. Although time-of-flight MR angiographic methods are of great value in many situations and do not require administration of contrast agent, they present substantial artifacts in large aneurysms where there is magnetization saturation in blood that has extensive recirculation in the volume of interrogation. Contrast-enhanced MR angiography using paramagnetic contrast agents (gadopentetate dimeglumine), however, is successful in providing excellent coverage with high spatial resolution over a 3D volume in a relatively short study time (∼20 seconds). With appropriate acquisition timing (fluoroscopically determined in this case), good arterial visualization was provided without venous enhancement.
Flow velocities can be determined in the vessels of interest by using MR velocimetry. This method is not limited by intervening tissue, bone, or gas, as is the case for sonography, the other clinical technique for assessing flow velocities. Specifically, sonography is unable to provide access to flow values in the basilar artery or in the vertebral arteries immediately proximal to their junction. The velocity measurements obtained with MR methods provide important inputs for the computational fluid dynamics model, permitting characterization of the wall shear and flow.
To calculate the velocity by using computational fluid dynamics, several assumptions have to be made either implicitly or explicitly. The arterial wall is assumed to be rigid in the model. This results in an overestimation of the wall shear, but this is considered to be significant only at peak systole (13). Since the aneurysm is approximately twice as stiff as the normal vessels, possibly due to the lack of elastin (14, 15), the rigid wall assumption is appropriate. In large arteries, the blood is treated as a Newtonian fluid (ie, the fluid stress is proportional to the strain rate of the fluid). This assumption is acceptable for most regions except in regions of small strain rate, and no significant difference has been reported for non-Newtonian flows in large arteries. The appropriateness of this assumption in large aneurysms where recirculation is slow is unknown and is under investigation. Flow varies through the cardiac cycle, and in this study we considered only steady flow. The condition we have described reflects flow patterns in which the hemodynamic forces are close to maximal and are expected to have most clinical relevance. However, our numerical scheme can easily include pulsatility, and we are actively investigating the effects of pulsatile flow on flow patterns within the aneurysm.
Although computational fluid dynamics methods have been used previously to investigate flow conditions in aneurysmal structures, we are unaware of any previous studies in which these methods were used to simulate the effects of proposed interventions designed to treat intracranial aneurysms. We describe a number of results that are somewhat counterintuitive and provide a framework for analyzing the impact of proposed interventional strategies.
The schematic example illustrated by Fig 1 implies that the take down of a feeding vessel can result in a redistribution of flow forces that might not necessarily improve the long-term stability of the aneurysm. Occluding one of the vertebral arteries in that case results in a shift of the principal flow stream so that it impinges on the vessel wall, resulting in an increase in the maximum wall shear stress that is exerted on the aneurysm.
For the case of the patient-specific geometry, our simulations indicate the importance of knowing the hemodynamic conditions when planning treatment. The hemodynamic forces that exist through the aneurysmal region are substantially different when the flow in the feeding vessels changes, even for nearly identical vascular geometries. As the patient presented, one vertebral artery is effectively already nearly occluded and the patient would be unlikely to receive any benefit from a procedure that would occlude that vertebral artery. However, had the total flow through the stenotic vertebral artery been found to be comparable to that in the contralateral vertebral artery (ie, had the stenosis not yet become hemodynamically limiting), the simulations indicate that there would have been a pronounced high velocity jet and associated high-pressure zone on the contralateral aneurysm wall. In that case, occlusion of the stenotic artery would substantially reduce the flow impact on the aneurysm wall.
Conclusion
Aneurysmal disease of the intracranial arteries can have devastating sequelae. In many cases, interventional neuroradiologists or neurosurgeons face a situation in which they do not know what the possible outcomes of their interventions might be. With this study, we demonstrated that numerical methods can be used to provide some guidance in this decision-making process. The validity of the predictions of numerical simulations requires long-term follow-up studies in which changes in vascular anatomy can be correlated with the calculated hemodynamic forces in that vascular territory. Our results lay the groundwork for prospectively predicting the hemodynamic impact on aneurysm growth and for predicting the effect of interventional procedures that are undertaken to occlude feeding vessels in an attempt to ameliorate hemodynamic forces on patients with otherwise untreatable aneurysmal disease.
References
- 1.Bederson JB, Awad IA, Wiebers DO, et al. Recommendations for the management of patients with unruptured intracranial aneurysms: a statement for healthcare professionals from the Stroke Council of the American Heart Association. Stroke 2000;31:2742–2750 [DOI] [PubMed] [Google Scholar]
- 2.Sahs AL, Perret GE, Locksley HB, Nishioka H. Intrancranial Aneurysms and Subarachnoid Hemorrhage: A Cooperative Study. Philadelphia: Lippincott,1969. :296
- 3.Morley TP, Barr HW. Giant intracranial aneurysms: diagnosis, course, and management. Clin Neurosurg 1969;16:73–94 [DOI] [PubMed] [Google Scholar]
- 4.Pia HW, Zierski J. Giant cerebral aneurysms. Neurosurg Rev 1982;5:117–148 [DOI] [PubMed] [Google Scholar]
- 5.Weir B. Special aneurysms: saccular. In: Weir B, ed. Aneurysms Affecting the Nervous System. Baltimore: Williams & Wilkins,1987. :185–208
- 6.Kodama N, Suzuki J. Surgical treatment of giant aneurysms. Neurosurg Rev 1982;5:155–160 [DOI] [PubMed] [Google Scholar]
- 7.McCormick WF, Acosta-Rua GJ. The size of intrancranial aneurysms: an autopsy study. J Neurosurg 1970;33:422–427 [DOI] [PubMed] [Google Scholar]
- 8.Michel W. Posterior fossa aneurysms stimulating tumors. J Neurol Neurosurg Psychiatry 1974;37:218–223 [DOI] [PMC free article] [PubMed] [Google Scholar]
- 9.Peerless S, Wallace M, Drake C. Giant intracranial aneurysms. In: Youmans J, ed. Neurological Surgery: A Comprehensive Reference Guide to the Diagnosis and Management of Neurological Problems. Philadelphia: W. B. Saunders,1990. :1742–1763
- 10.Lawton MT, Spetzler RF. Surgical strategies for giant intracranial aneurysms. Acta Neurochir Suppl (Wien) 1999;72:141–156 [DOI] [PubMed] [Google Scholar]
- 11.Jou L, Berger S. Numerical simulation of the flow in the carotid bifurcation. Theor Computational Fluid Dynamics 1998;10:239–248 [Google Scholar]
- 12.Quick CM, Leonard EF, Young WL. Adaptation of the cerebral circulation to brain arteriovenous malformations increases feeding arterial pressure and decreases regional hypotension. Neurosurgery 2002;50:167–175 [DOI] [PubMed] [Google Scholar]
- 13.Anayiotos AS, Jones SA, Giddens DP, Glasgov S, Zarins CK. Shear stress at a compliant model of the human carotid bifurcation. J Biomech Eng 1994;116:98–106 [DOI] [PubMed] [Google Scholar]
- 14.He C, Roach M. The composition and mechanical properties of abdominal aortic aneurysms. J Vasc Surg 1994;20:6–13 [DOI] [PubMed] [Google Scholar]
- 15.Toth M, Nadasy G, Nyary I, et al. Sterically inhomogeneous viscoelastic behavior of human saccular cerebral aneurysms. J Vasc Res 1998;35:345–355 [DOI] [PubMed] [Google Scholar]